
Hello Folks,
Below you can find a recap of questions asked at the office hours sessions last week and those sent in that were not covered at the session. Feel free to comment and continue the discussion, as well as attend future sessions that can be found on the Community Events calendar!
Q: I noticed that Advanced Analytics has a new UI. Can I get more information about this?
A: Sure. We recently released the new UI in Advanced Analytics. More details can be found in our release notes: https://docs.netskope.com/en/new-features-and-enhancements-in-release-103-0-0.html#UUID-d621a40f-66ac-8fd8-6a32-bf4b08b6fb20_section-idm4549363501561633616174212254
Q: Some deactivated users scheduled important reports coming out of their personal folders. Are there any ways to move those reports to our group folder?
A: Yes. If you need to access deactivated accounts, please file a support ticket and we will help you with this.
Q: I’m gathering data on the risk management of my organization compared with industry peers. Can I leverage Advanced Analytics on this topic?
A: Absolutely! The Industry Benchmarks Dashboard in the library is a great starting point. It helps you compare your organization to your peers in the industry via risk score. The lower the score, the better. The dashboard also provides an in-depth investigation of your risk score from 3 dimensions: threat activities, application risk, and user risk. Please note that this dashboard is read-only.
Q: How can I reduce my risk scores shown in the Industry Benchmarks Dashboard?
A: To reduce your risk score, we recommend following best practices provided in the dashboard. Please keep in mind this is only a percentile score, and your ability to impact this may be limited. E.g., you may reduce your organization’s risk by implementing security awareness training, but everyone else in your industry can be doing the same thing. In this case, your risk score may remain unchanged.
Q: I’m very interested in my user risk score from the Industry Benchmarks Dashboard. How can I learn more about this?
A: The user risk score is calculated based on User Behavior policies, so we recommend checking the User Behavior Analytics (UBA/UEBA) Dashboard. This can tell you if there was a peak in alerts, who the users were, or if there was a particular policy that drove the change. You can find the dashboard in our community: https://community.netskope.com/t5/Advanced-Analytics-Dashboard/UEBA-Dashboard/ba-p/4056. Feel free to download and import it to your own environment for more details.
Q: I found a significant change in my user risk score from the Industry Benchmarks Dashboard. How can I know why that change happened?
A: There is an alert trend in the User Behavior Analytics (UBA/UEBA) Dashboard. You can adjust the filter and check if the alert trend corresponds to the change of your risk score. This can help you with your investigation.
Q: How can I, precisely, better tune my UEBA policies?
A: Advanced Analytics may not help you with this topic. The account or customer success team should be able to help. We will have a Behavior Analytics webinar this week, which can be a great starting point for this topic. More details including the registration link can be found here: https://community.netskope.com/t5/North-American-Events/Behavior-Analytics-Overview/ev-p/3942.
Q: Can I get visibility into AI usage in my organization with Advanced Analytics?
A: Yes. You can find the AI Dashboard - Alpha Version from our community: https://community.netskope.com/t5/Advanced-Analytics-Dashboard/AI-dashboard-Alpha-version/ba-p/4042. Feel free to import the dashboard to your environment and customize it.
Q: I want to know more about departing users’ activities. Are there any existing dashboards I can use?
A: You can start with the User/Organization Unit Summary Dashboard in the library. By adjusting the User Group filter and the Organization Unit filter, you can see activities by particular users.
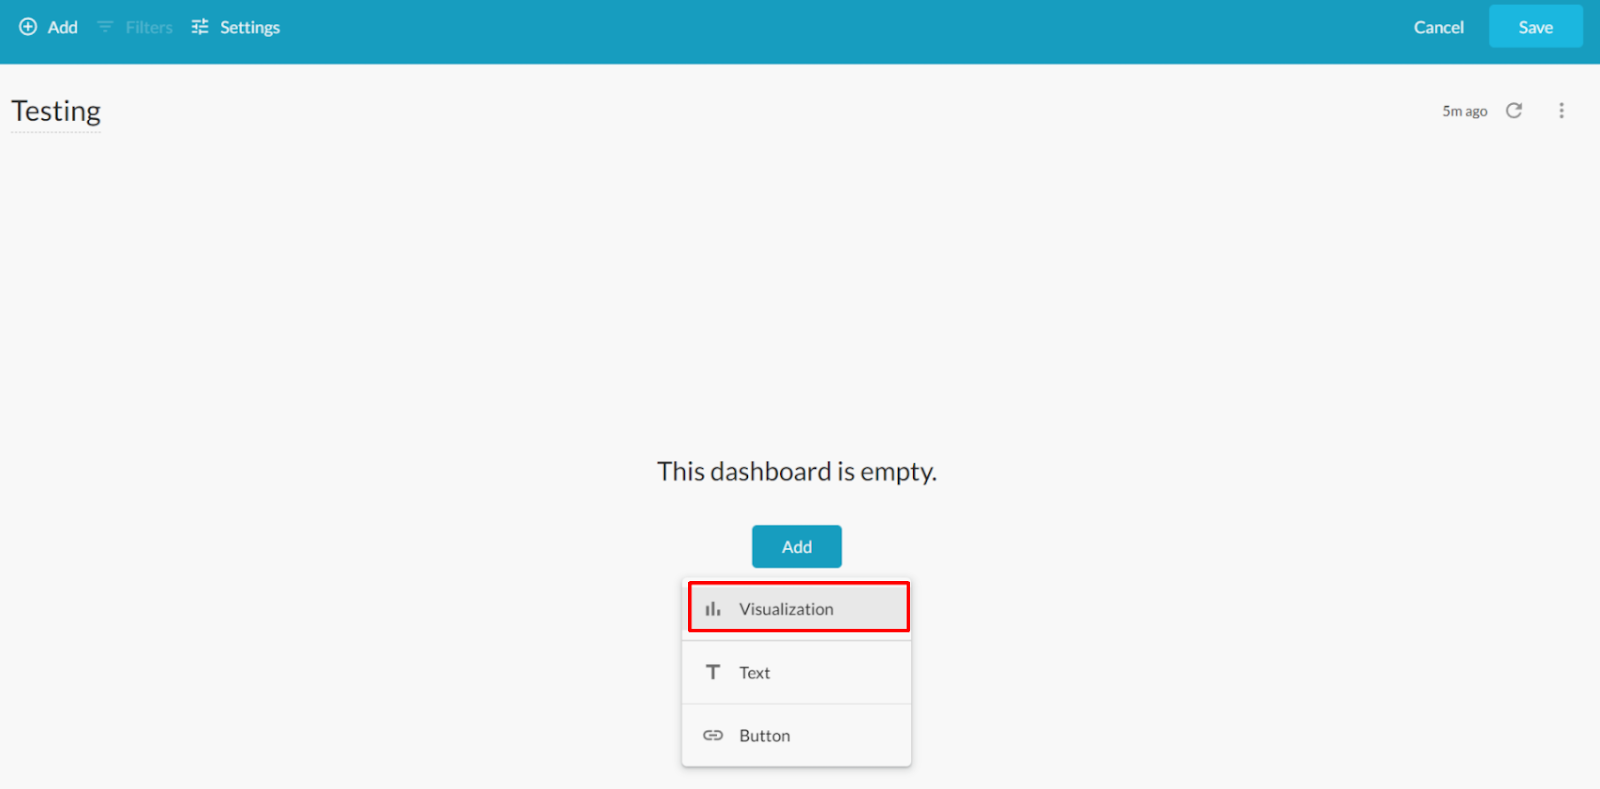
Q: I love the Sankey chart. Can you show me how to create it from scratch?
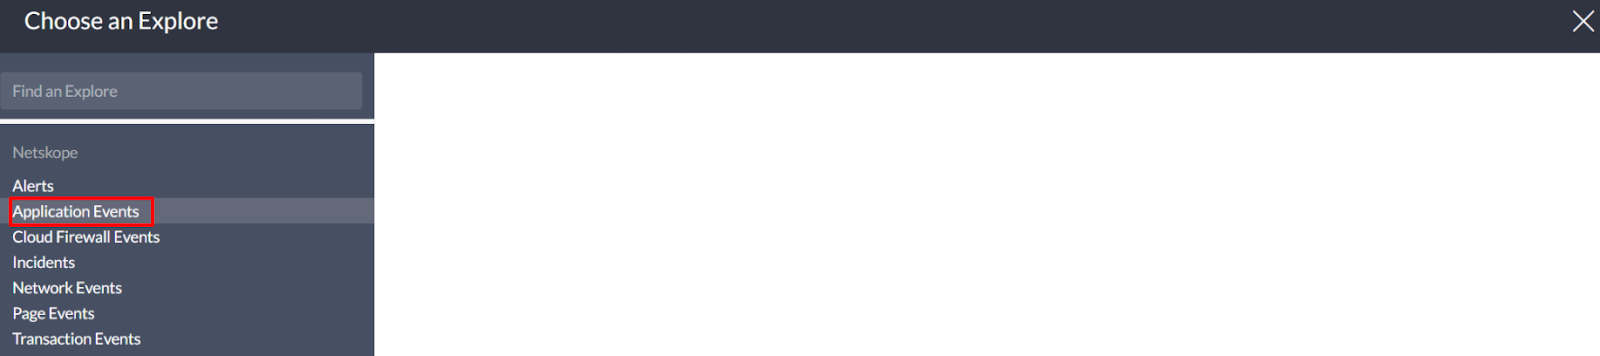
A: In a new dashboard, click the Add button and choose Visualization. You will then be able to choose your preferred data collection. We are using Application Events here.
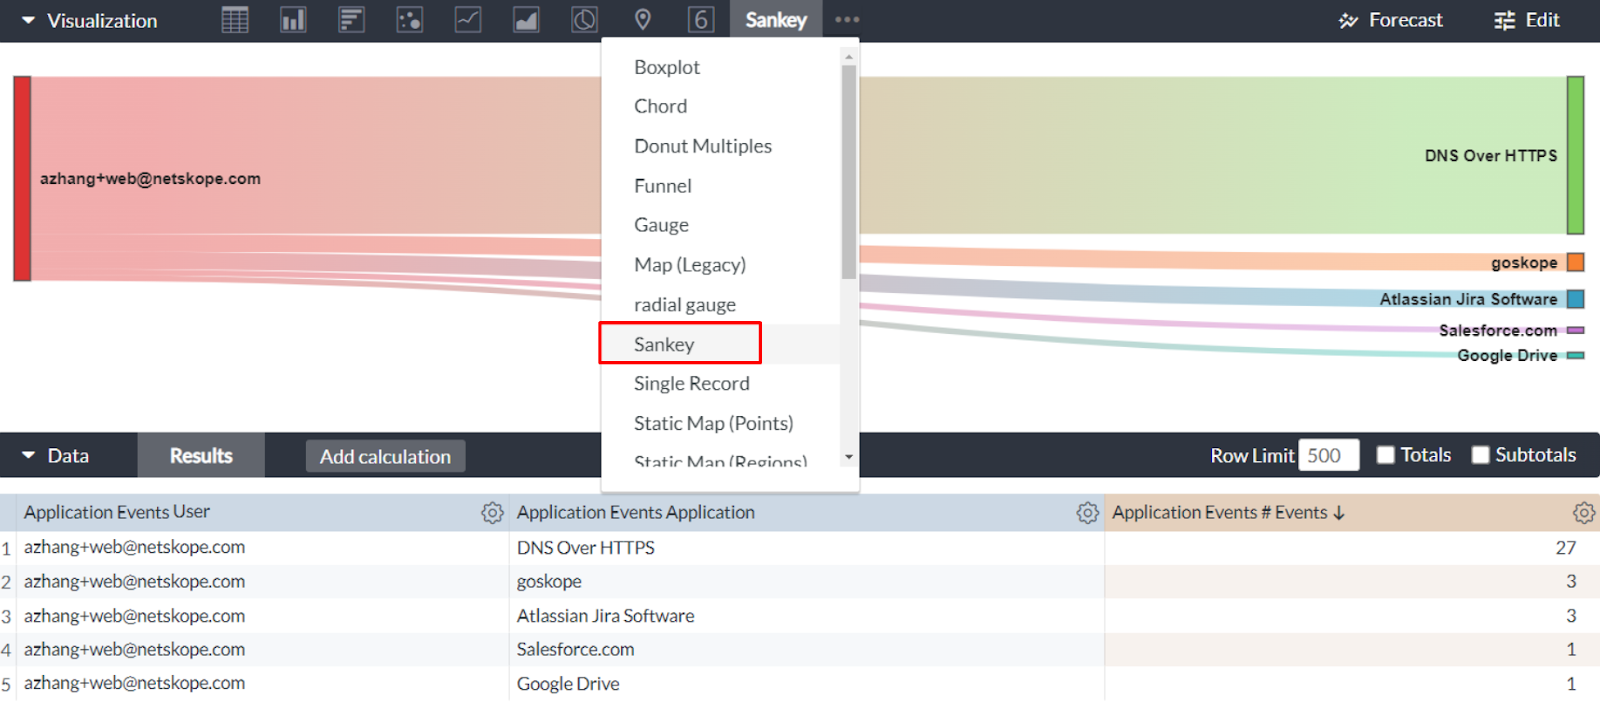
By selecting the data collection, you will then enter the visual (widget) edit mode. Basically, a Sankey chart shows you relationships (e.g., data upload) between two or more subjects. So, it must contain at least TWO dimensions and ONE measure. We are using User and Application as two dimensions and # Events as the measure here.
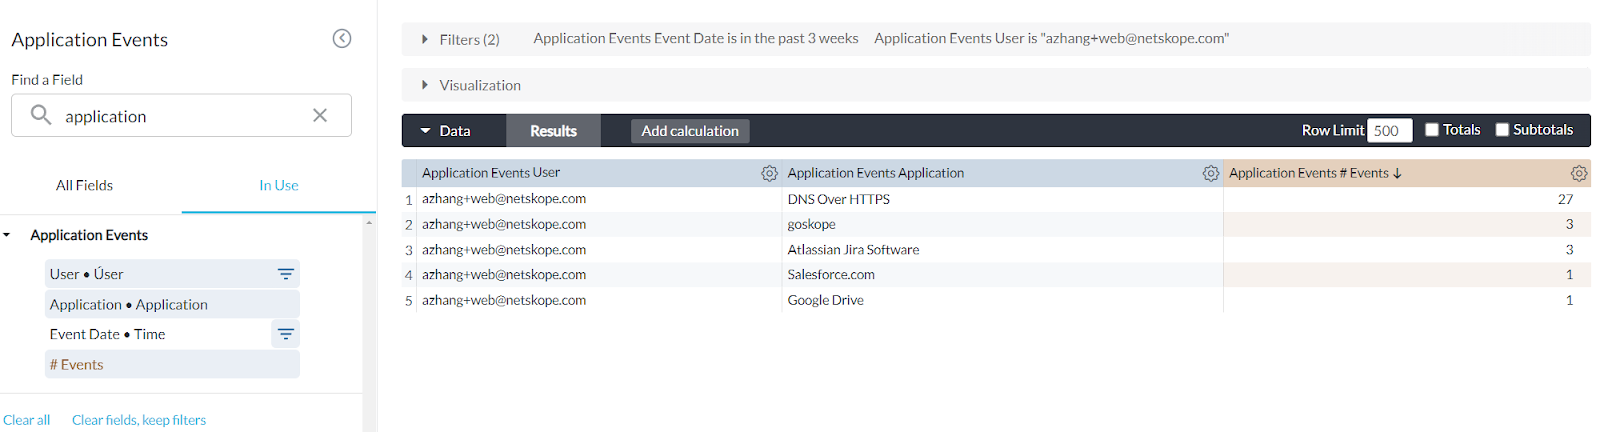
Expand the visualization sections. In the visualization tool bar, click the 3-dot button and select Sankey in the drop-down menu. You will then get the Sankey chart. The chart shows you the number of events moving from the user (left) to corresponding applications (right). The band width here reflects the number of events. A wider band represents a higher number of events.
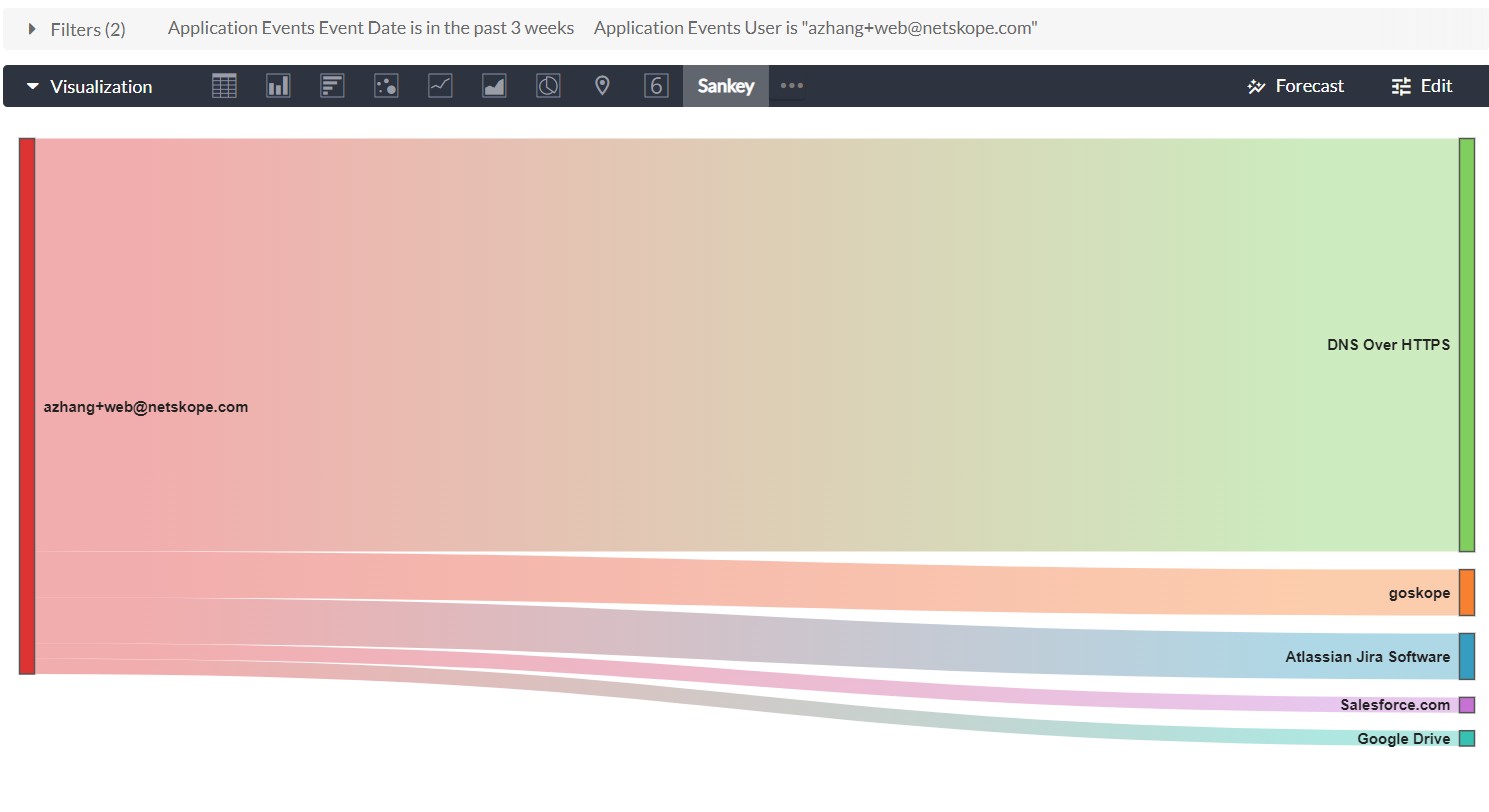
The Sankey chart is good to show leadership to influence change, as it reflects relationships between things. However, it cannot handle too much data. You may have to limit it to 4-5 dimensions or less and limit rows of data to approximately 20-30.
Q: I’m new to Advanced Analytics. How and where can I start my journey?
A: We highly recommend starting with existing dashboards, either in the library or community. Tags can help you find dashboards you are interested in. You can explore any dashboards based on your needs, and customize them in your environment. You can also find tons of resources (e.g., hot topic discussion, dashboard intro, and upcoming AA events, etc.). Feel free to let us know if you need any help!
Q: I found great resources from the Netskope Academy Customer Learning Portal. Can I request access for other colleagues as well?
A: Actually, you don’t have to do so. Customers can self register by sending an email to training@netskope.com.
Q: I got a notification "You don't have access to classic reports." Is this a license issue or just a permission issue for my login?
A: If you are a customer who has 3m+ of data retention with Advanced Analytics, you will no longer be able to access classic reports. You should have the ability to migrate any legacy classic reports to Advanced Analytics. There is no longer a need for you to use classic reports, as there is less functionality. If you have Base Advanced Analytics with 7 days of data, you will retain your ability to toggle between Advanced Analytics and Classic Reports.
Q: Can you explain what an instance is?
A: “Instance” is a concept used by Netskope to differentiate various access to the same application. E.g., your organization’s OneDrive for business vs. your partners OneDrive for business.
Q: I have a lot of different dashboards in my folder. How can I quickly revisit or locate specific dashboards I need?
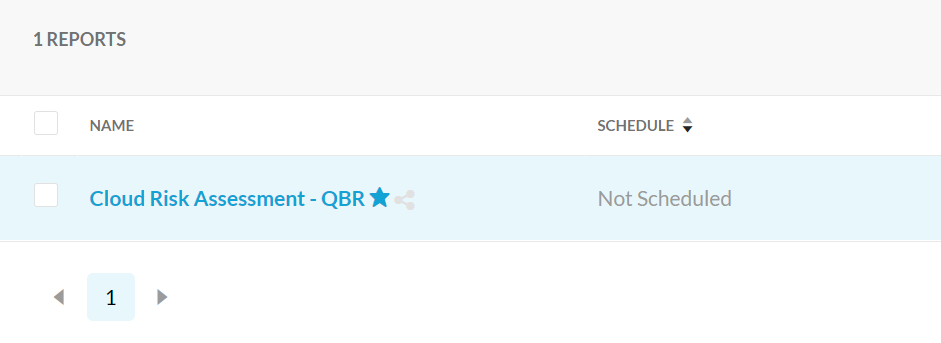
A: All predefined dashboards are in the library and can be copied to your group or personal folders. If there are too many dashboards in your space, you can click the Star button next to the dashboard title to “favorite” it, which will help you revisit the dashboard.
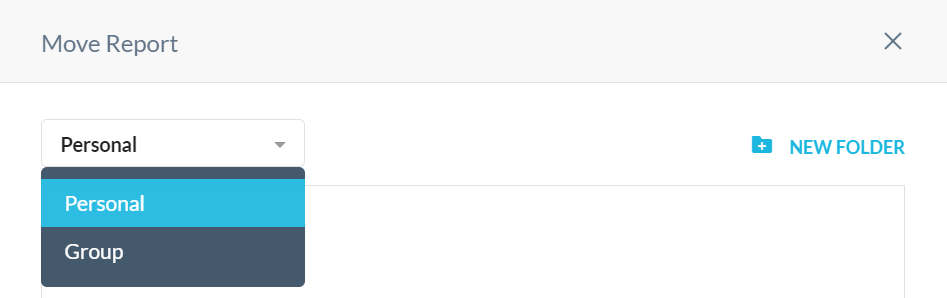
Q: There is a mess in my group folder, can I move some dashboards to my personal folder.
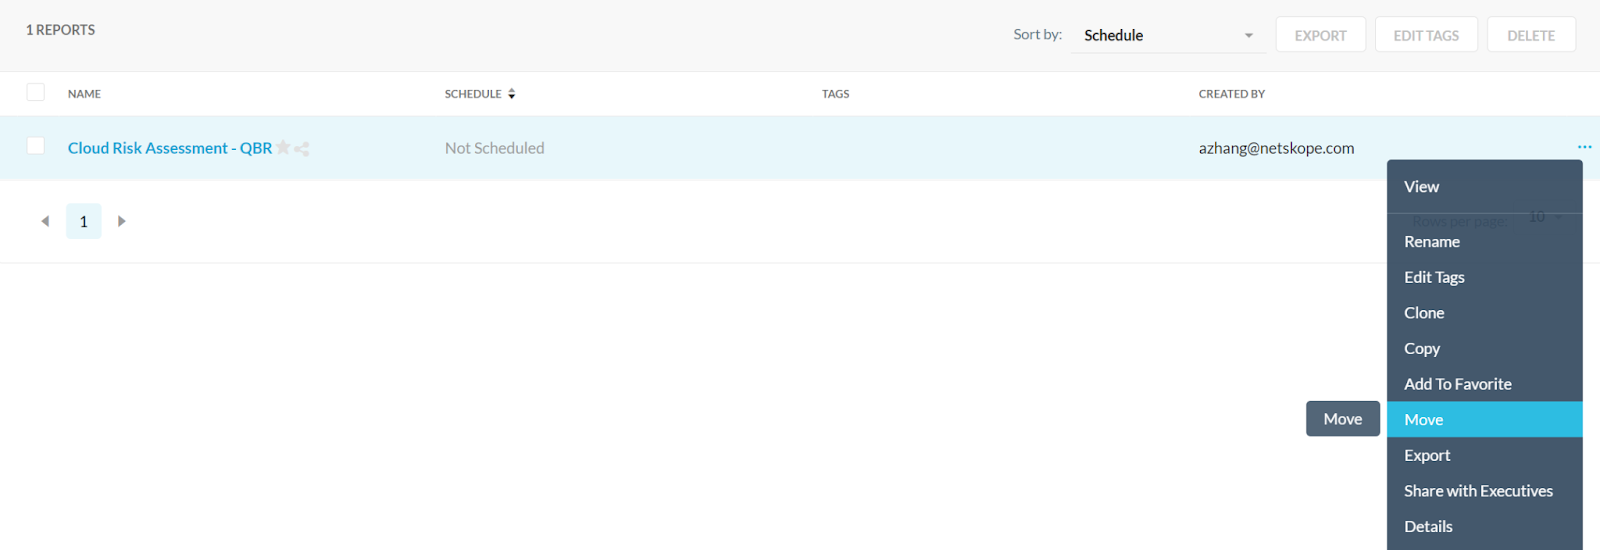
A: Yes. Dashboards can be moved across. You can do this by clicking the 3-dot button on the right side of your dashboard list and selecting Move in the drop-down menu. You will then be able to move the dashboard to your personal folder.
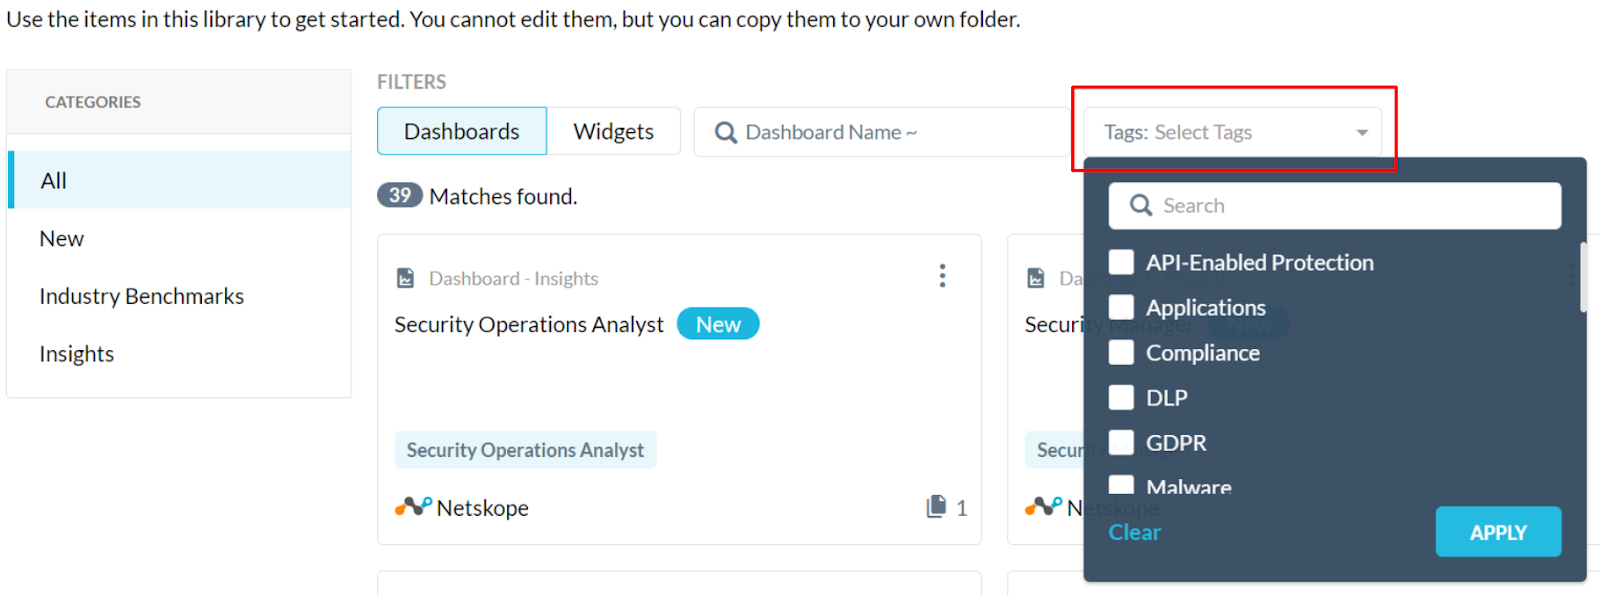
Q: How can I filter particular dashboards based on tags?
A: By selecting tags from the drop-down tag list in the library, you can then filter particular dashboards based on these tags.
Q: I want to know more about where my data is going. Are there any existing dashboards that can be used?
A: Of course! If you are interested in general data traffic, the Data Governance & Privacy Dashboard in the library can be a great starting point. If you focus more on traffic destined for particular countries, you can leverage the Geolocation Data Flows Dashboard which can be found in our community: https://community.netskope.com/t5/Advanced-Analytics-Dashboard/Do-you-know-where-your-data-is-going/ba-p/1124.
Besides, you can also explore the allowed data movement to unmanaged applications and non-corporate instances using the Risky Data Movement Dashboard from the community: https://community.netskope.com/t5/Advanced-Analytics-Dashboard/Risky-Data-Movement-Understand-data-movement-to-un-managed-apps/ba-p/2156