


Hello Folks,
Below you can find a recap of questions asked at the office hours sessions last week and those sent in that we were not able to cover at the session. Feel free to comment and continue the discussion, as well as attend future sessions that can be found on the Community Events calendar!
Q: I’m new to Advanced Analytics. How and where can I start my journey?
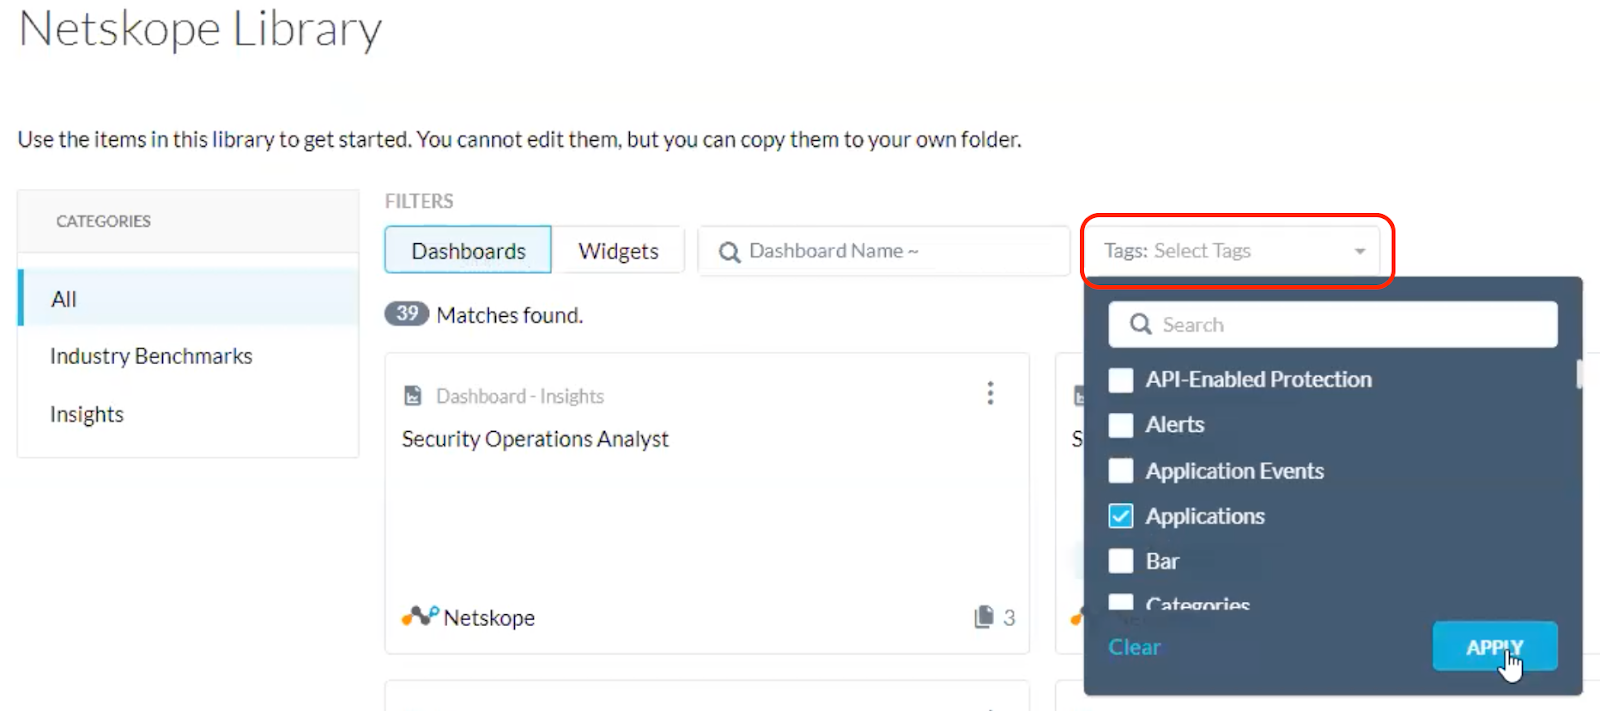
A: Here is a link to a helpful video on how to get started quickly https://www.youtube.com/watch?v=R1X131ouyY0. We highly recommend starting with existing dashboards, either in the library or community. Tags can help you find dashboards you are interested in. You can explore any dashboards based on your needs, and customize them in your environment. You can also find tons of resources (e.g., hot topic discussion, dashboard intro, and upcoming AA events, etc.) here on the Netskope Community. Feel free to let us know if you need any help!
Q: What reports can be used to show executives a summary of cloud usage, threat, and risk assessment, etc.?
A: “CISO dashboard” and “Cloud Risk Assessment - QBR” dashboard are 2 good options. You may also use the “Industry Benchmarks” dashboard to provide a high level view of how your environment compares to your industry peers. All these dashboards can be found in the Netskope Library section of Advanced Analytics.
Q: How to better operationalize using advanced analytics?
A: Operationalization means different things depending on product, use case, and your top needs. Below you can find some common operationalization topics and Advanced Analytics dashboards to address these.
- Tag your Applications and Instances: One of the first recommendations when starting to leverage the Netskope platform is to identify corporate/IT-managed applications and instances. This is important to do before writing policies to control traffic. For example, upload of data (sensitive or not) is probably ok when it is going to corporate applications and instances. Alternatively, uploads to non corporate applications and personal instances should be monitored and controlled for sensitive data movement. Use the dashboard at the link below to enable you to identify your corporate apps and instances. Based on this information, tag them in the Netskope U. https://community.netskope.com/t5/Advanced-Analytics-Dashboard/Tag-your-applications-and-instances/ba-p/2424
- Evaluate and Tune SSL Decrypt Bypasses: Use the “SSL Decrypt Policies” dashboard available at the link below to understand how much traffic is being bypassed for SSL decrypt. Using this information, tune the settings/policies to only bypass what is needed. https://community.netskope.com/t5/Advanced-Analytics-Dashboard/Tune-Bypasses-using-the-SSL-Decrypt-Bypass-Dashboard/ba-p/3830
- Tune DLP Policies: Use the “DLP Policies” dashboard to identify noisy DLP policies and identify the source of noise to tune the policies.
Q: I love the Sankey chart. Can you show me how to create it from scratch?
A: Sure. Here is a video to walk you through reading and creating Sankey diagrams: https://www.youtube.com/watch?v=4-2yh_u3_9k&list=PLoCX2twqHg72m7Cds9C_FKV5_9G2ZjnYH&index=16&t=4s
Additionally here are written instructions around this topic:
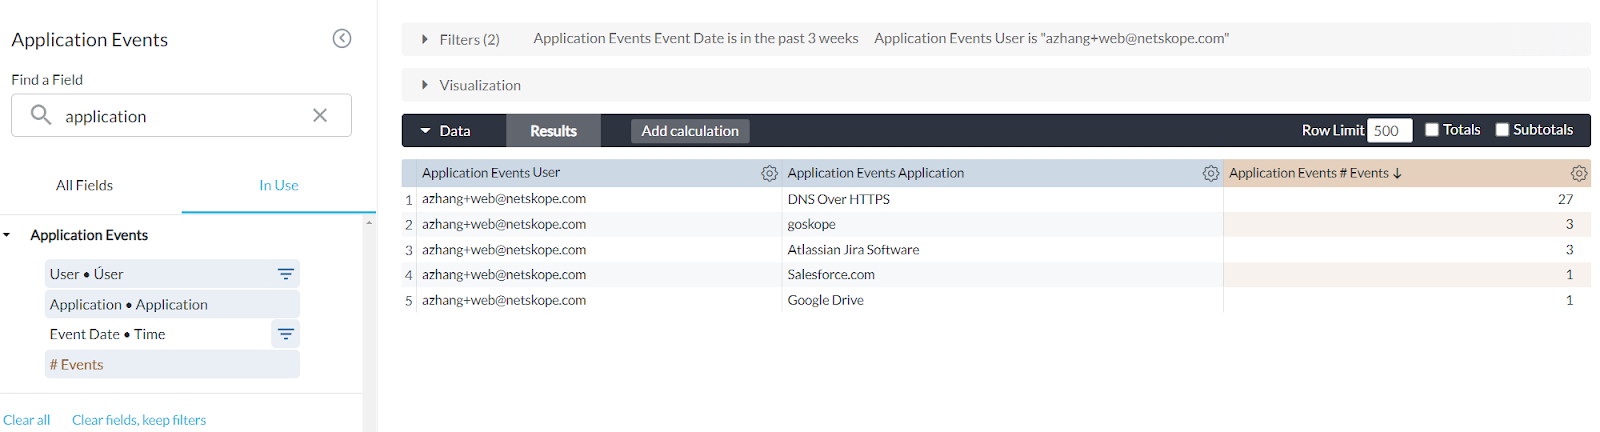
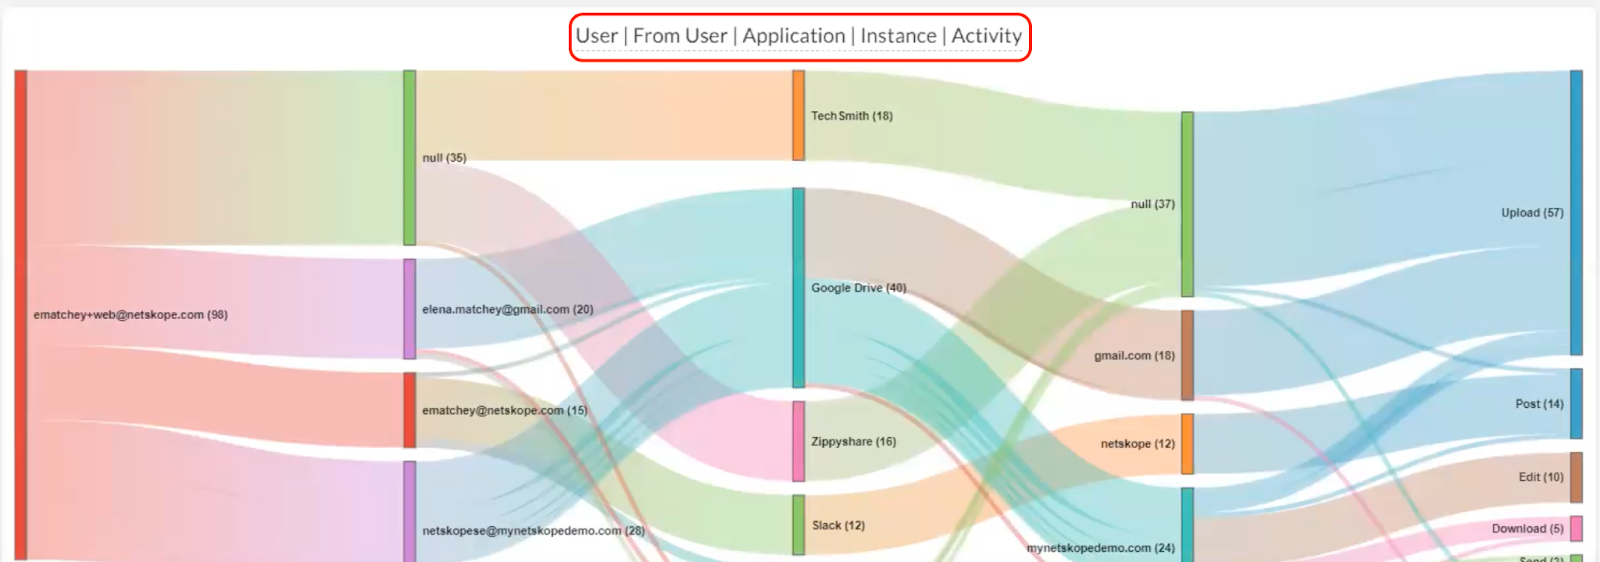
To start, please pick your preferred data collection and enter the visual (widget) edit mode. Basically, a Sankey chart shows relationships (e.g., data upload) between two or more subjects. So, it must contain at least TWO dimensions and ONE measure. We are using User and Application as two dimensions and # Events as the measure here.
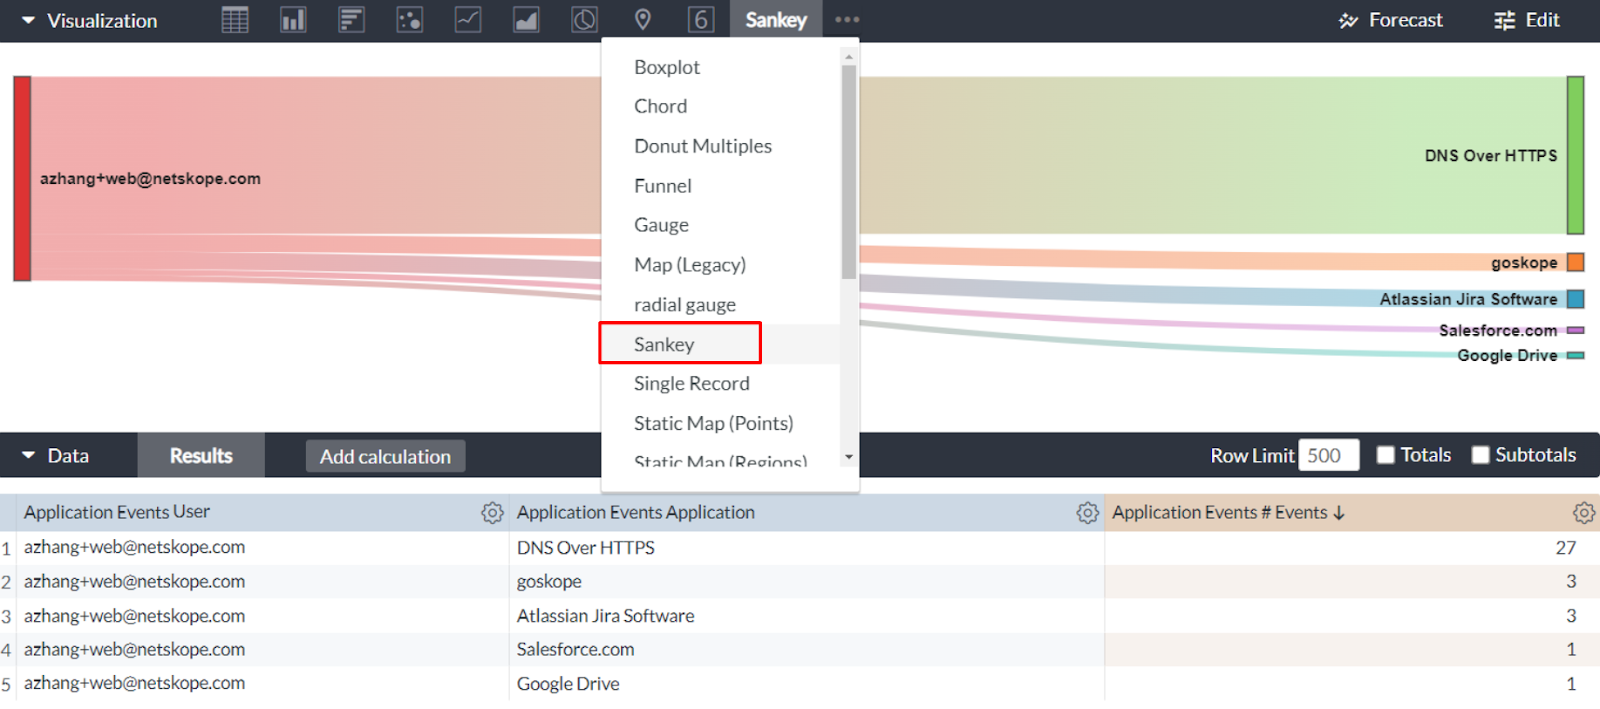
Expand the visualization sections. In the visualization tool bar, click the 3-dot button and select Sankey in the drop-down menu. You will then get the Sankey chart. The chart shows you the number of events moving from the user (left) to corresponding applications (right). The band width here reflects the number of events. A wider band represents a higher number of events.
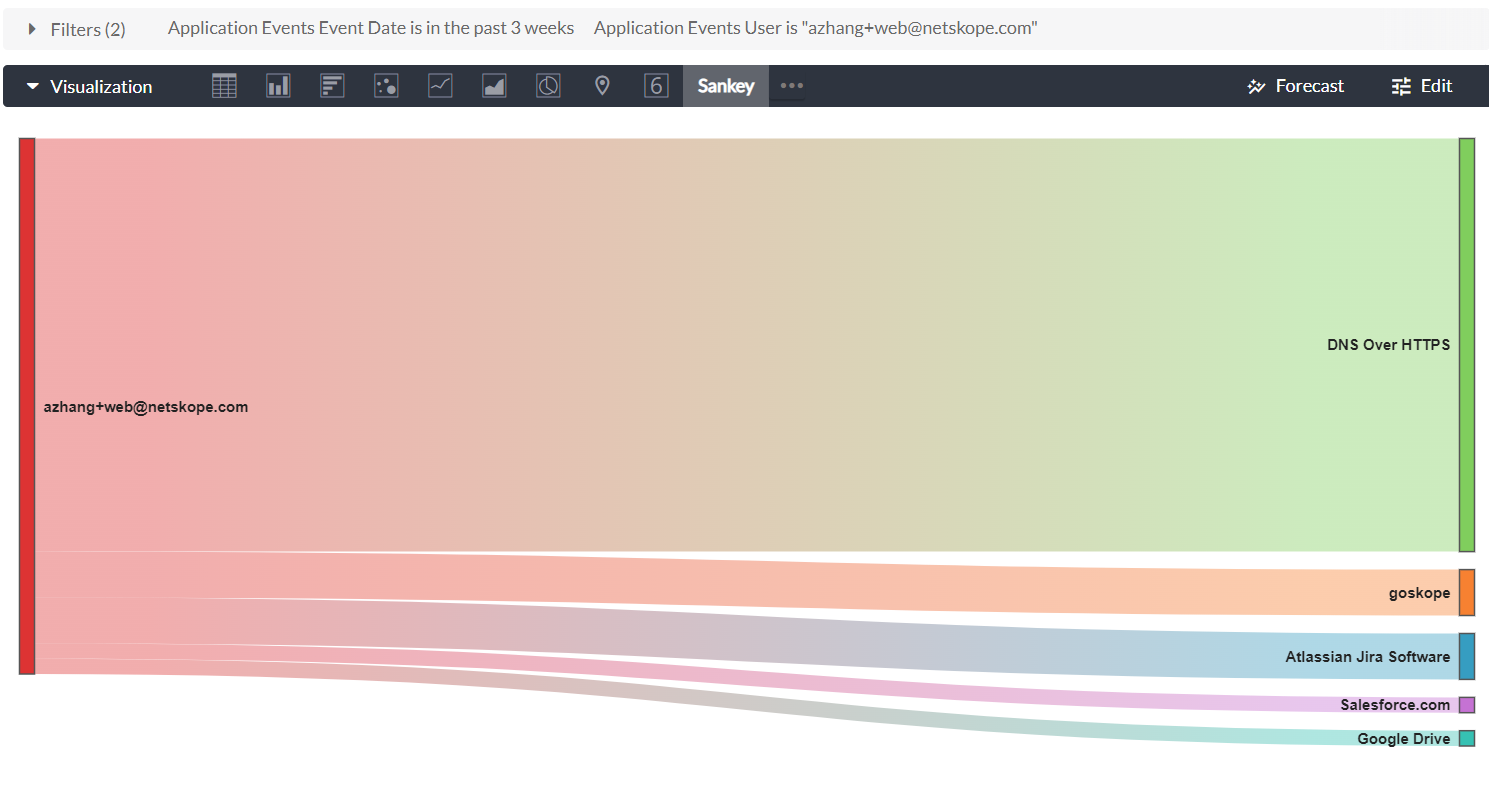
A Sankey chart is good to present insights to leadership, as it reflects quantifiable metrics between things. However, it cannot handle too much data. To avoid data cutoff which may cause misinterpretation, we recommend limiting it to 2-4 dimensions or less and limiting rows of data to approximately 20-30.
Q: There are 2 “bands” in my Sankey chart that have similar “bandwidth.” Can I add numbers to each “band” to show exact values?
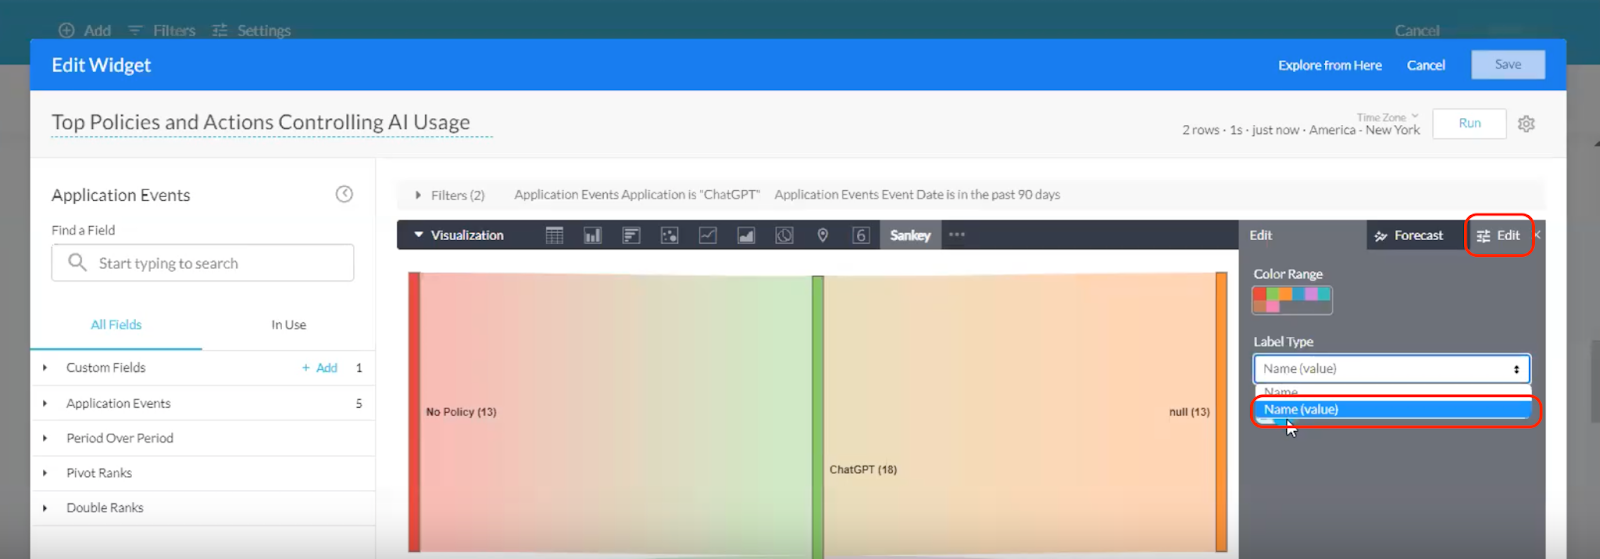
A: Good point! In the edit mode, you can do this by selecting “Name (value)” from the Label Type drop-down list in the visualization section. You will then see numbers/values next to each subject.
Q: I want to add names to all columns in my Sankey chart. How can I do that?
A: At this time, the only way to do this is typing in column names in the visual title.
Q: What does the “∅” refer to in my dashboard?
A: This symbol refers to “null,” which indicates that there is no value to be displayed.
Q: Do I have to keep downloading dashboards or will they update automatically in my tenant?
A: Dashboards in the Netskope Library are occasionally updated, and those changes are made without your intervention. Dashboards you have copied into the Group & Personal folders are never changed by Netskope without your explicit permission. Dashboards on the community are occasionally updated, and you will have to re-import them into your environment to get the new changes.
Q: For how long would data be stored in Advanced Analytics?
A: NAA has a data retention license (7 days, 3 months, 6 months & 13 months). Please be sure to pick the appropriate license so that we store data for those periods.
Q: I’m new to NAA and would like to investigate the usage of particular applications, including corresponding user info. Where can I start?
A: Netskope library is always a great starting point. You can quickly locate relevant dashboards by choosing particular tags from the Tag list (e.g., Applications).
To learn more about application usage, we recommend starting with the Application Activity Summary Dashboard in the library. The dashboard allows you to explore application usage details (e.g., top users, events, objects, files uploaded/downloaded, etc.). For User information, please check out the User/Org Summary dashboard, also in the library. Please remember you can always copy the dashboard to your folder and customize it. Visit our YouTube channel for more details about dashboard customization.
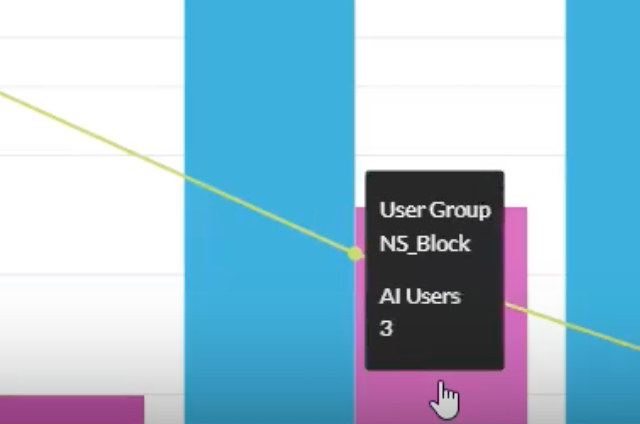
Q: I’m interested in AI application usage in my organization. Can I leverage Advanced Analytics on this topic?
A: Of course! You can find our latest AI Dashboard from the Netskope community. The dashboard gives you visibility into AI application usage in your environment (e.g., app names, top users, activities, actions, usage trends, policies, etc.). The Application dashboard level filter also allows you to view data for particular AI applications (e.g., ChatGPT). Feel free to download and import the json.zip file into your environment to see what your data looks like.
Q: How did you identify AI applications & sites?
A: At this time, we identify AI applications and websites based on a hard coded list of ~30 known generative AI domains. We have application/website category data coming soon, which will help us capture AI data in the future.
Q: The names of some subjects in my visual got cut off. How can I have the visual display full names of subjects?
A: Whenever you mouse over a subject, you should be able to see its full name.
Changing the visual type (e.g., to a table) or resizing the visual may also help. If the issue still cannot get resolved through these methods, feel free to contact us and we can help you rename the subjects.
Q: How can I improve dashboard performance (e.g., load time) in Advanced Analytics?
A: Please check our community post here for more information about improving NAA performance.
Q: I need some ideas about the best practices on DLP metrics. Where can I get more resources about this?
A: Our DLP Best Practices & Deep Dive Webinar can help. The DLP Policies Dashboard in Netskope library can also be another good resource.
Q: How can I drill in for more data around DEM and SLA with Advanced Analytics?
A: For user performance and SLAs please use the Digital Experience Management (DEM) product. This product is continuing to develop, stay tuned for updates. In the meantime, you can use Advanced Analytics to perform in depth analytics on which Netskope Hostname POP is in use as well as leverage transactions data to research SSL errors users encounter.


