

Summary
During certain troubleshooting situations, Netskope Support may request various debugging output from the Google Chrome Developer Tools (DevTools for short). Specifically, HAR (HTTP Archive) is a file format used by several HTTP session tools to export detailed traffic data for analysis.
Environment
Users experiencing cloud app page loading or performance issues while using a browser. Application access issues Reverse proxy (SAML/Auth).
Cause
Netskope Support and Engineering require HAR debug output from the affected client to provide app traffic data for analysis.
Resolution
If requested by Netskope Support, please provide the HAR debug output with the following instructions (please reference the following link for additional details: (https://toolbox.googleapps.com/apps/har_analyzer/)
Warning
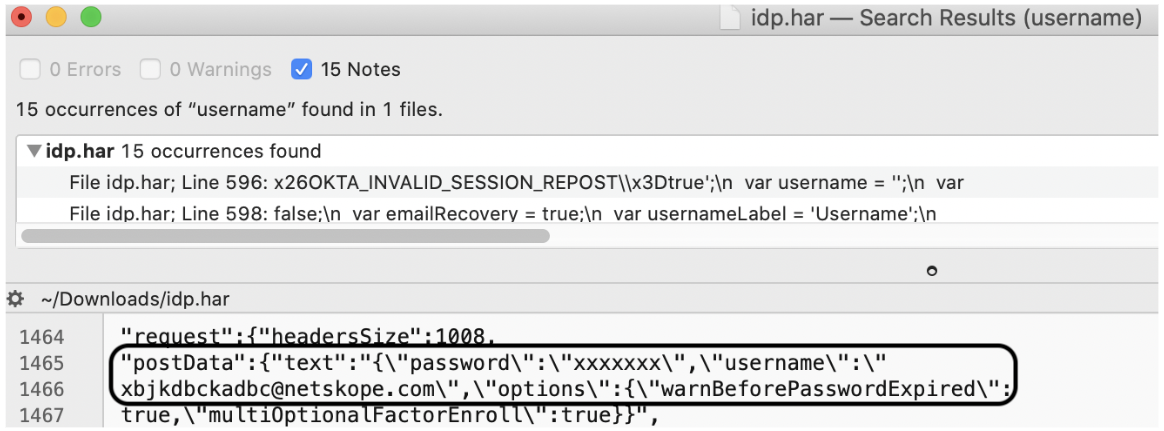
Please be cautious that the HAR capture will have sensitive information like Application login Username, Password etc in clear text.
After saving the HAR capture following the steps below, open the file using text editor. Search for the sensitive information and remove/mask it before uploading the Support ticket.
Note: The HAR output is available for Chrome, Firefox, and Internet Explorer (IE). For the instructions below, Google Chrome is referenced (the link above provides instructions for other browsers).
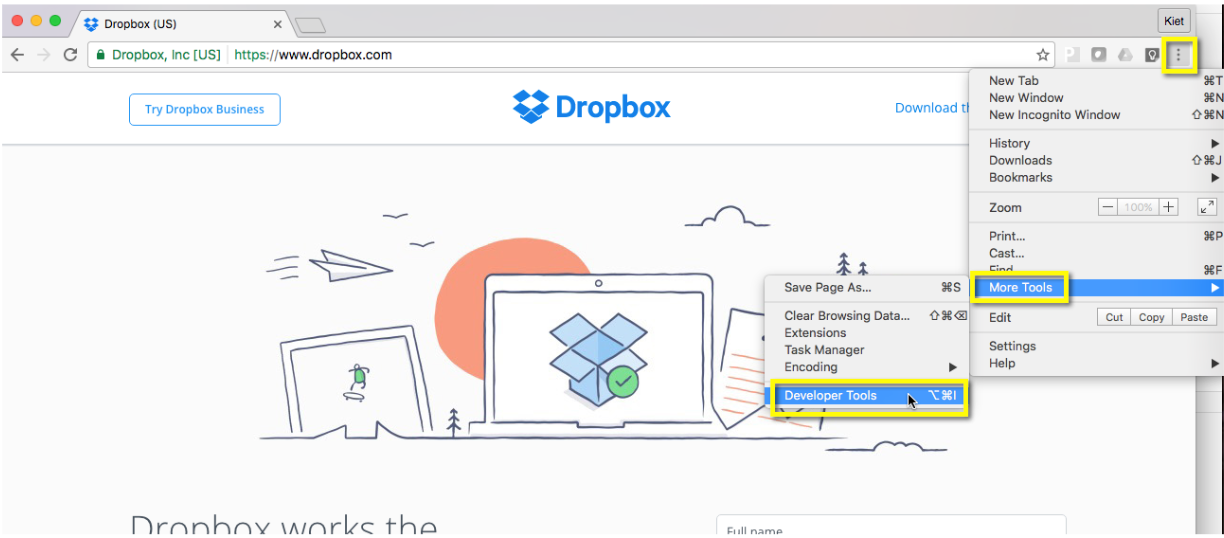
1. Open Google Chrome.
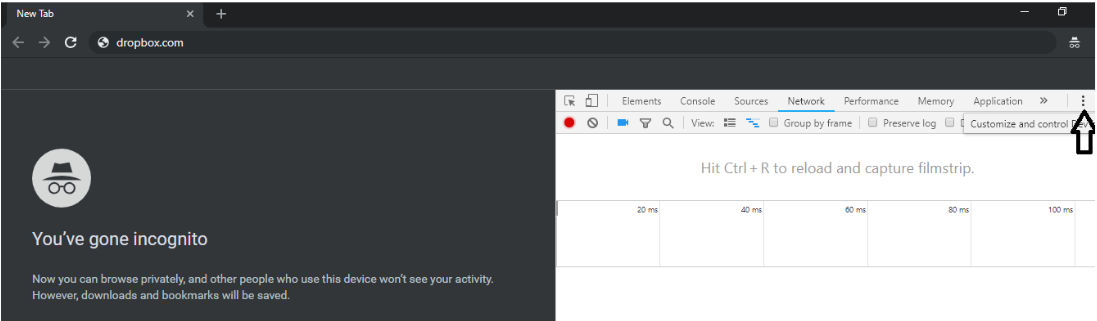
2. Enable DevTools.
3. Click on the Network tab.
4. Look for a Round Indicator at the top left of the Network tab. Make sure it is Red (default is red). If the indicator is grey, click the round indicator once to start recording.
5. Check the box next to Preserve log.
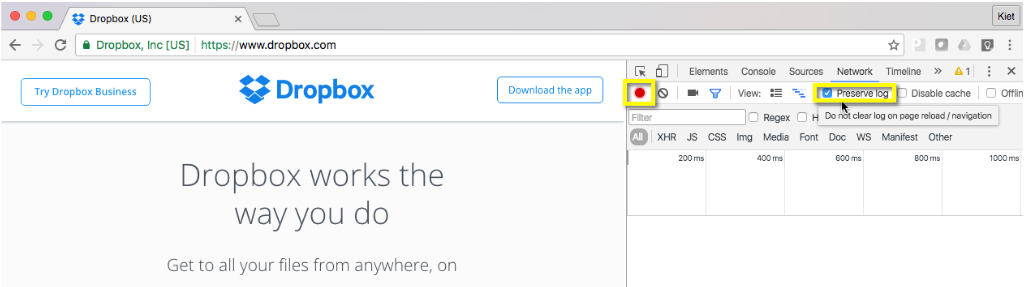
6. Optionally, you can use the clear button (a circle with a diagonal line through it) right before trying to reproduce the issue to clear the app traffic output.
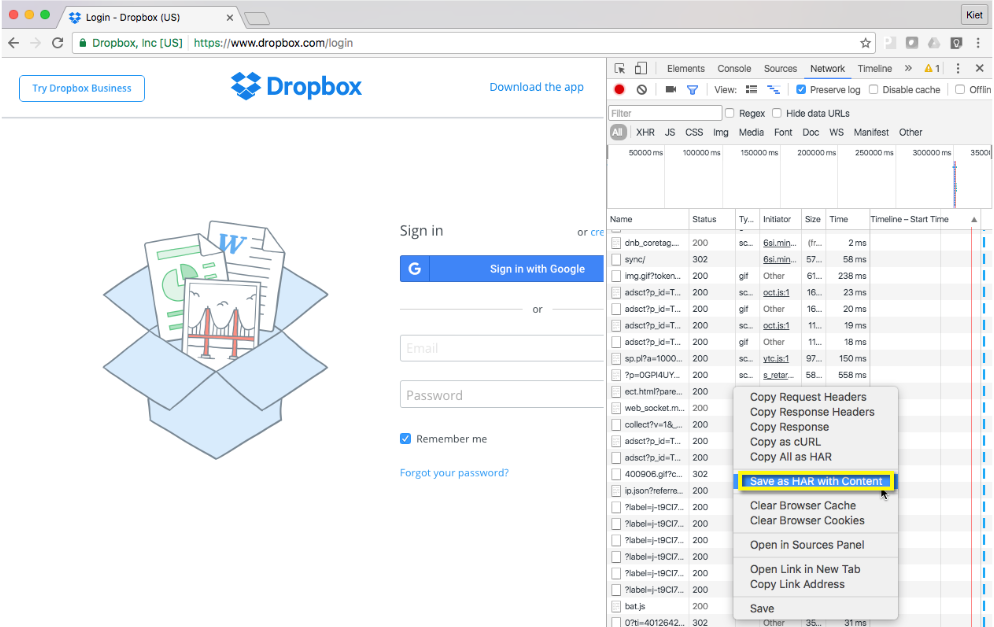
7. Save the capture by right-clicking on the grid and choosing Save as HAR with Content.
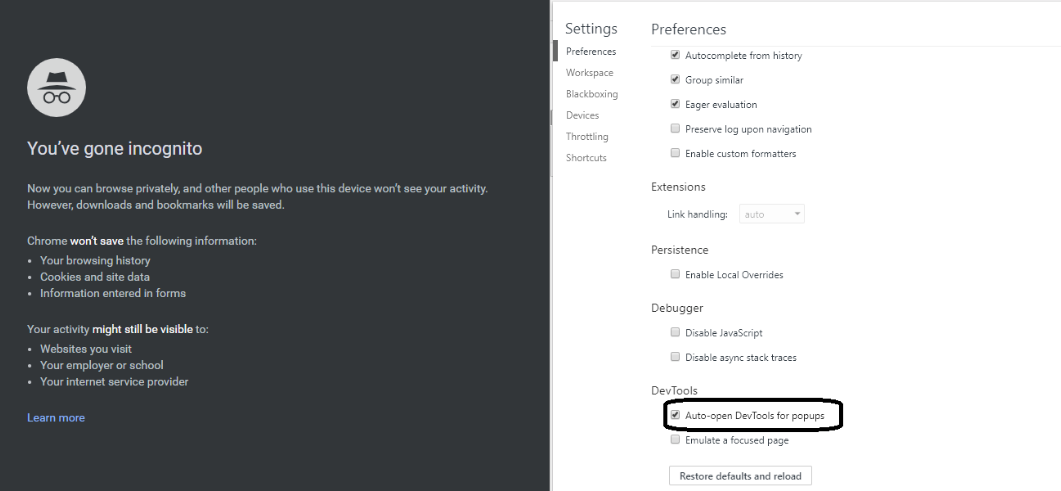
Steps to capture HAR in case of a link in the browser page opens up in a new browser tab/pop-up