


We've posted a number of "AI Usage" dashboard iterations in the last few weeks. This newest version will be posted to the library in the next couple of days. We've included the template in this post for those who want to try it out sooner! Please read the rest of this article for more information on the various views and a few disclaimers. Additionally, for guidance on how safely enable Generative AI, please check out the Netskope AI Solution Page and the AI forum.
The purpose of this dashboard is to give an overview of how users are interacting with Generative AI sites/apps/platforms. Some of the questions answered include:
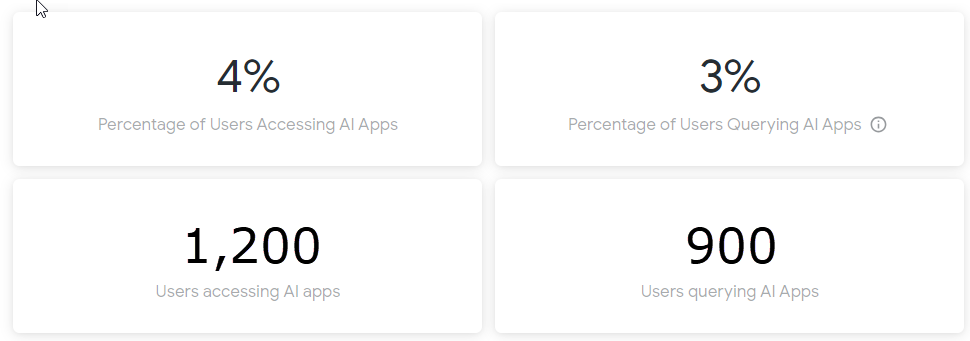
What percentage of my organization are accessing AI in any way? What is the actual count of users? Additionally, what percentage of my users are querying AI (i.e. asking it questions) and what is the actual count?
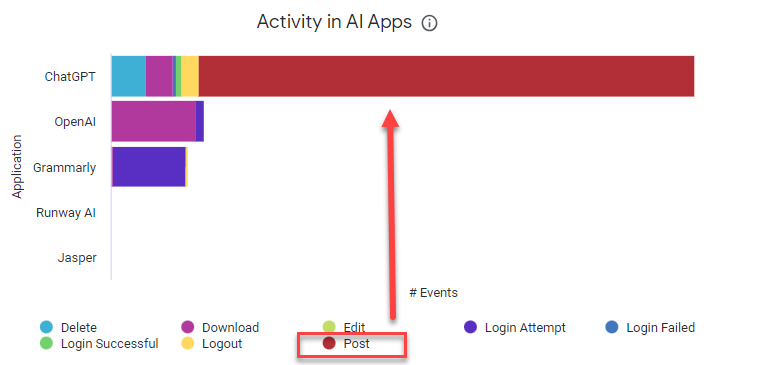
Which AI apps are being detected and what type of activities are being performed? Of special interest will be any Post or Upload activity since that indicates users are truly interacting with these apps:
What action is being taken on AI traffic for each app?

What does the usage look like over time? (*** Please reference notes at the bottom for more on this topic)

Understand the total users and total events for each AI application (not pictured)
Understand which user groups are using AI the most:

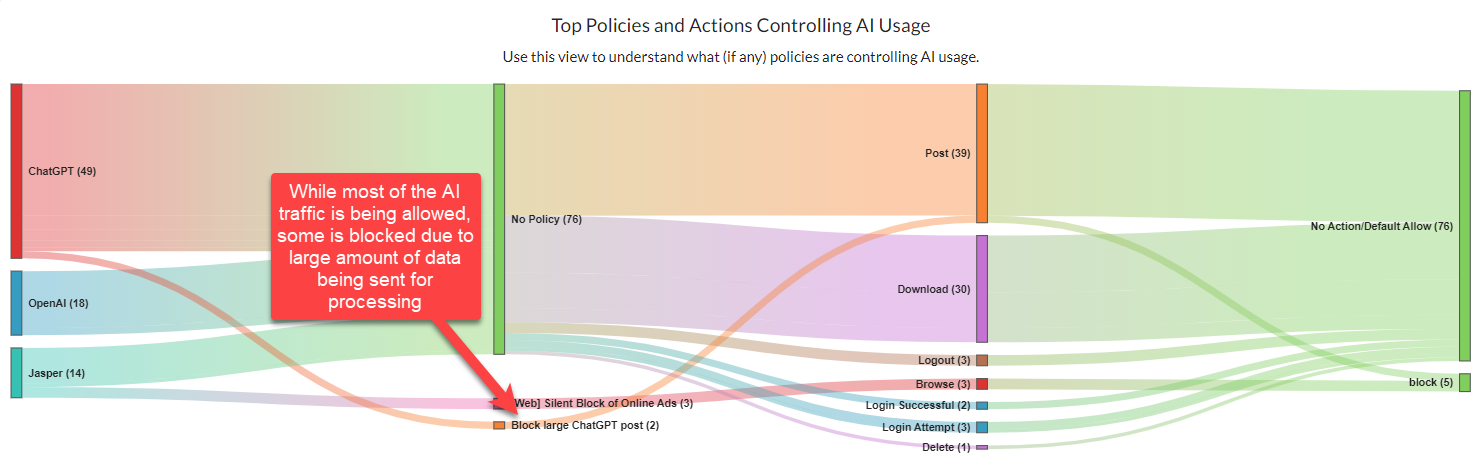
Determine how AI traffic is being controlled. What policies, if any, are triggering on AI traffic? What policy actions, if any, are being applied?
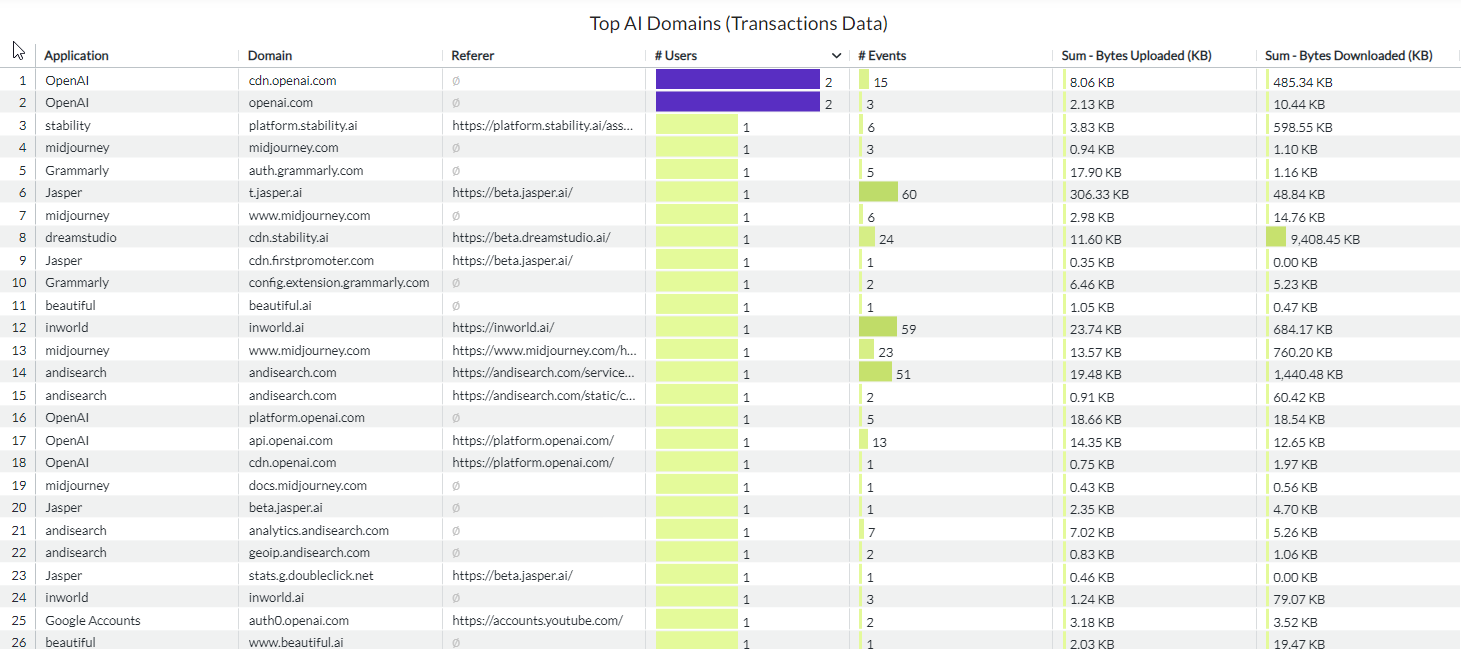
Not all AI traffic is tied to application, some traffic can only be detected via Page events and Web transactions. For detailed view into this traffic check out the tables at the bottom of the dashboard:
*** Please Note ***
- The "Generative AI" category has not been applied to event traffic retroactively. For this reason, when you look at the Usage trend you will only see events starting from the week of 6/4. If viewing historical AI usage traffic is an important use case there are 2 options: (1) Clear out the "Category" dashboard level filter and instead use the "Application" dashboard filters by entering the AI applications manually or (2) Use one of the older versions of the AI Usage dashboards which had had the application names hard coded. Please keep in mind you may need to add additional Gen AI apps that are missing from the list.
- The "Download" activity can be misleading. These downloads are not (for the most part) representing the "answers" that Gen AI has generated, rather in the case of ChatGPT these are font downloads. There is work currently being done to capture the data returned back from GenAI.
- It is possible to see some small amount of traffic attributed to non-GenAI apps like "Google Accounts" or "Twitter" and others. This is happening because the event URL is a GenAI but the traffic is being referred to anther app e.g. Google Account login. There is work being done to address this case.
- Additional troubleshooting tips for this dashboard can be found HERE .
