


Hello Folks,
Below you can find a recap of the topics discussed during the January Advanced Analytics office hours and those sent in that we were not able to cover in the session. Feel free to comment and continue the discussion, as well as attend our future sessions that can be found from the Community Events Calendar!
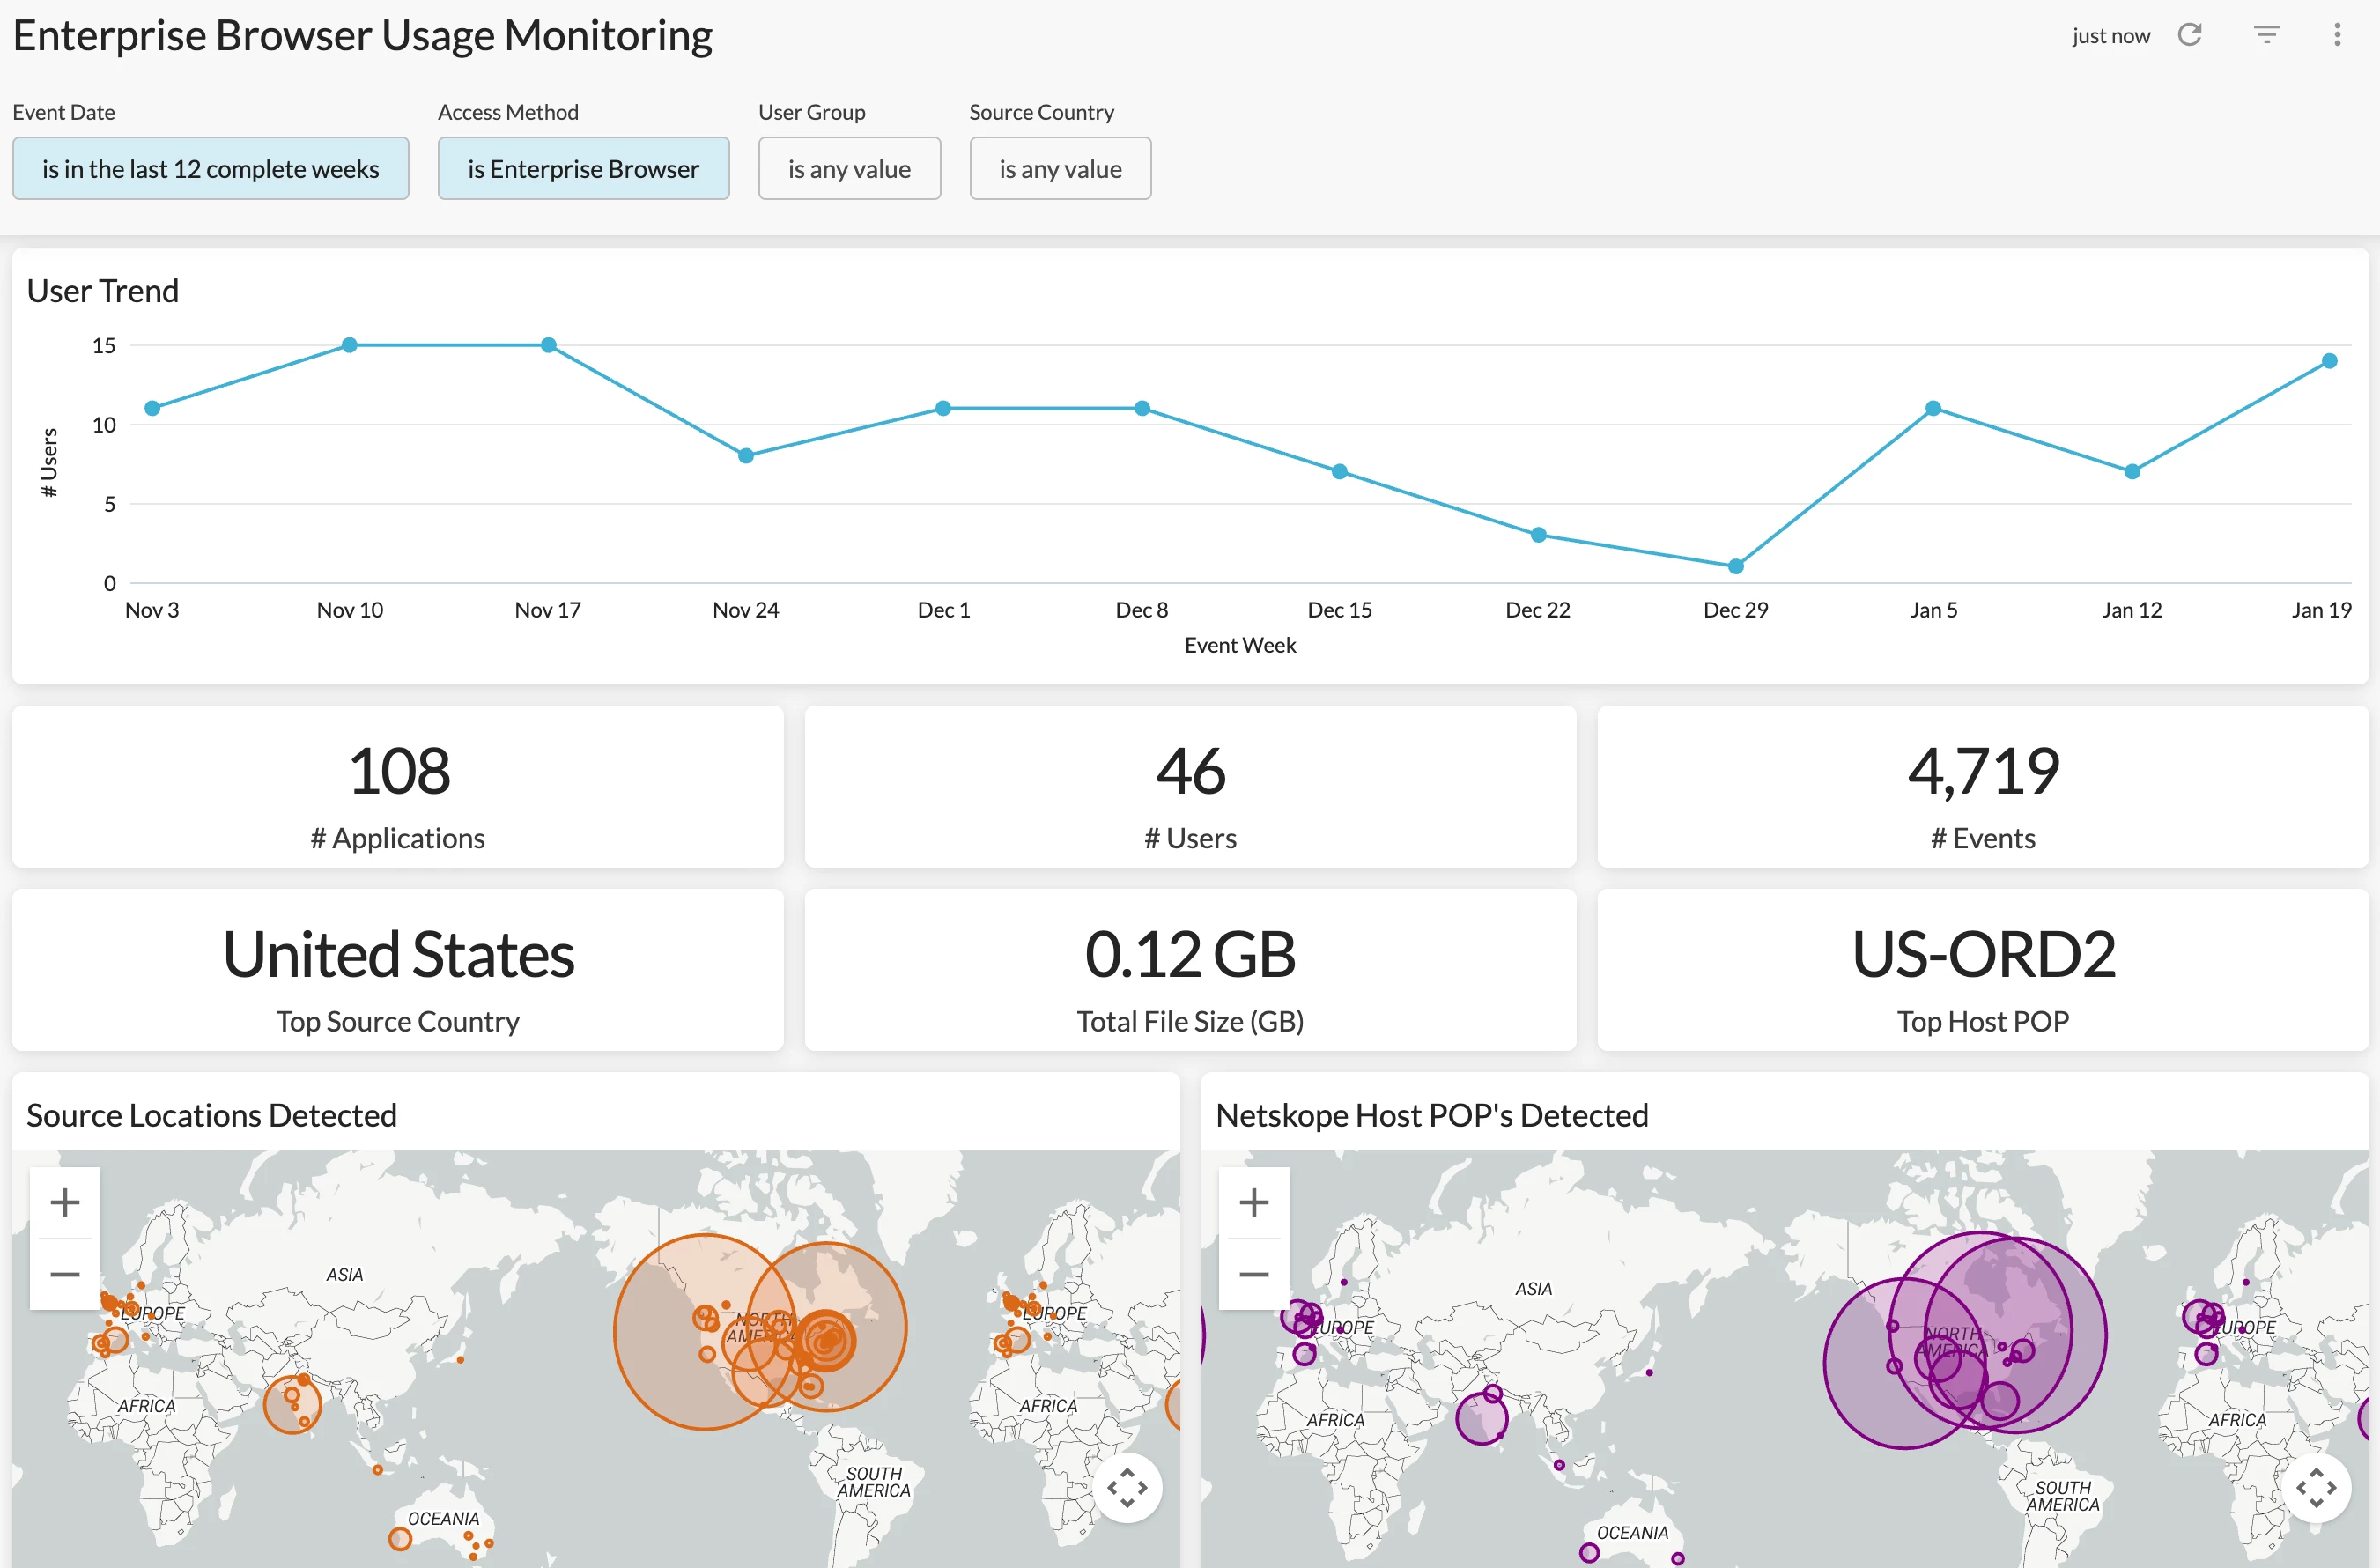
Q: Can Advanced Analytics help us monitor Enterprise Browser? What are the major use cases for Enterprise Browser?
A: Absolutely. The Enterprise Browser Usage Monitoring Dashboard is a good starting point. The dashboard allows you to monitor Enterprise Browser usage from two aspects: operations and security. Use this dashboard to understand:
- How your users are being onboarded to Enterprise Browser
- How heavily your users are using Enterprise Browser
- If there is any risky app usage and data movement with Enterprise Browser
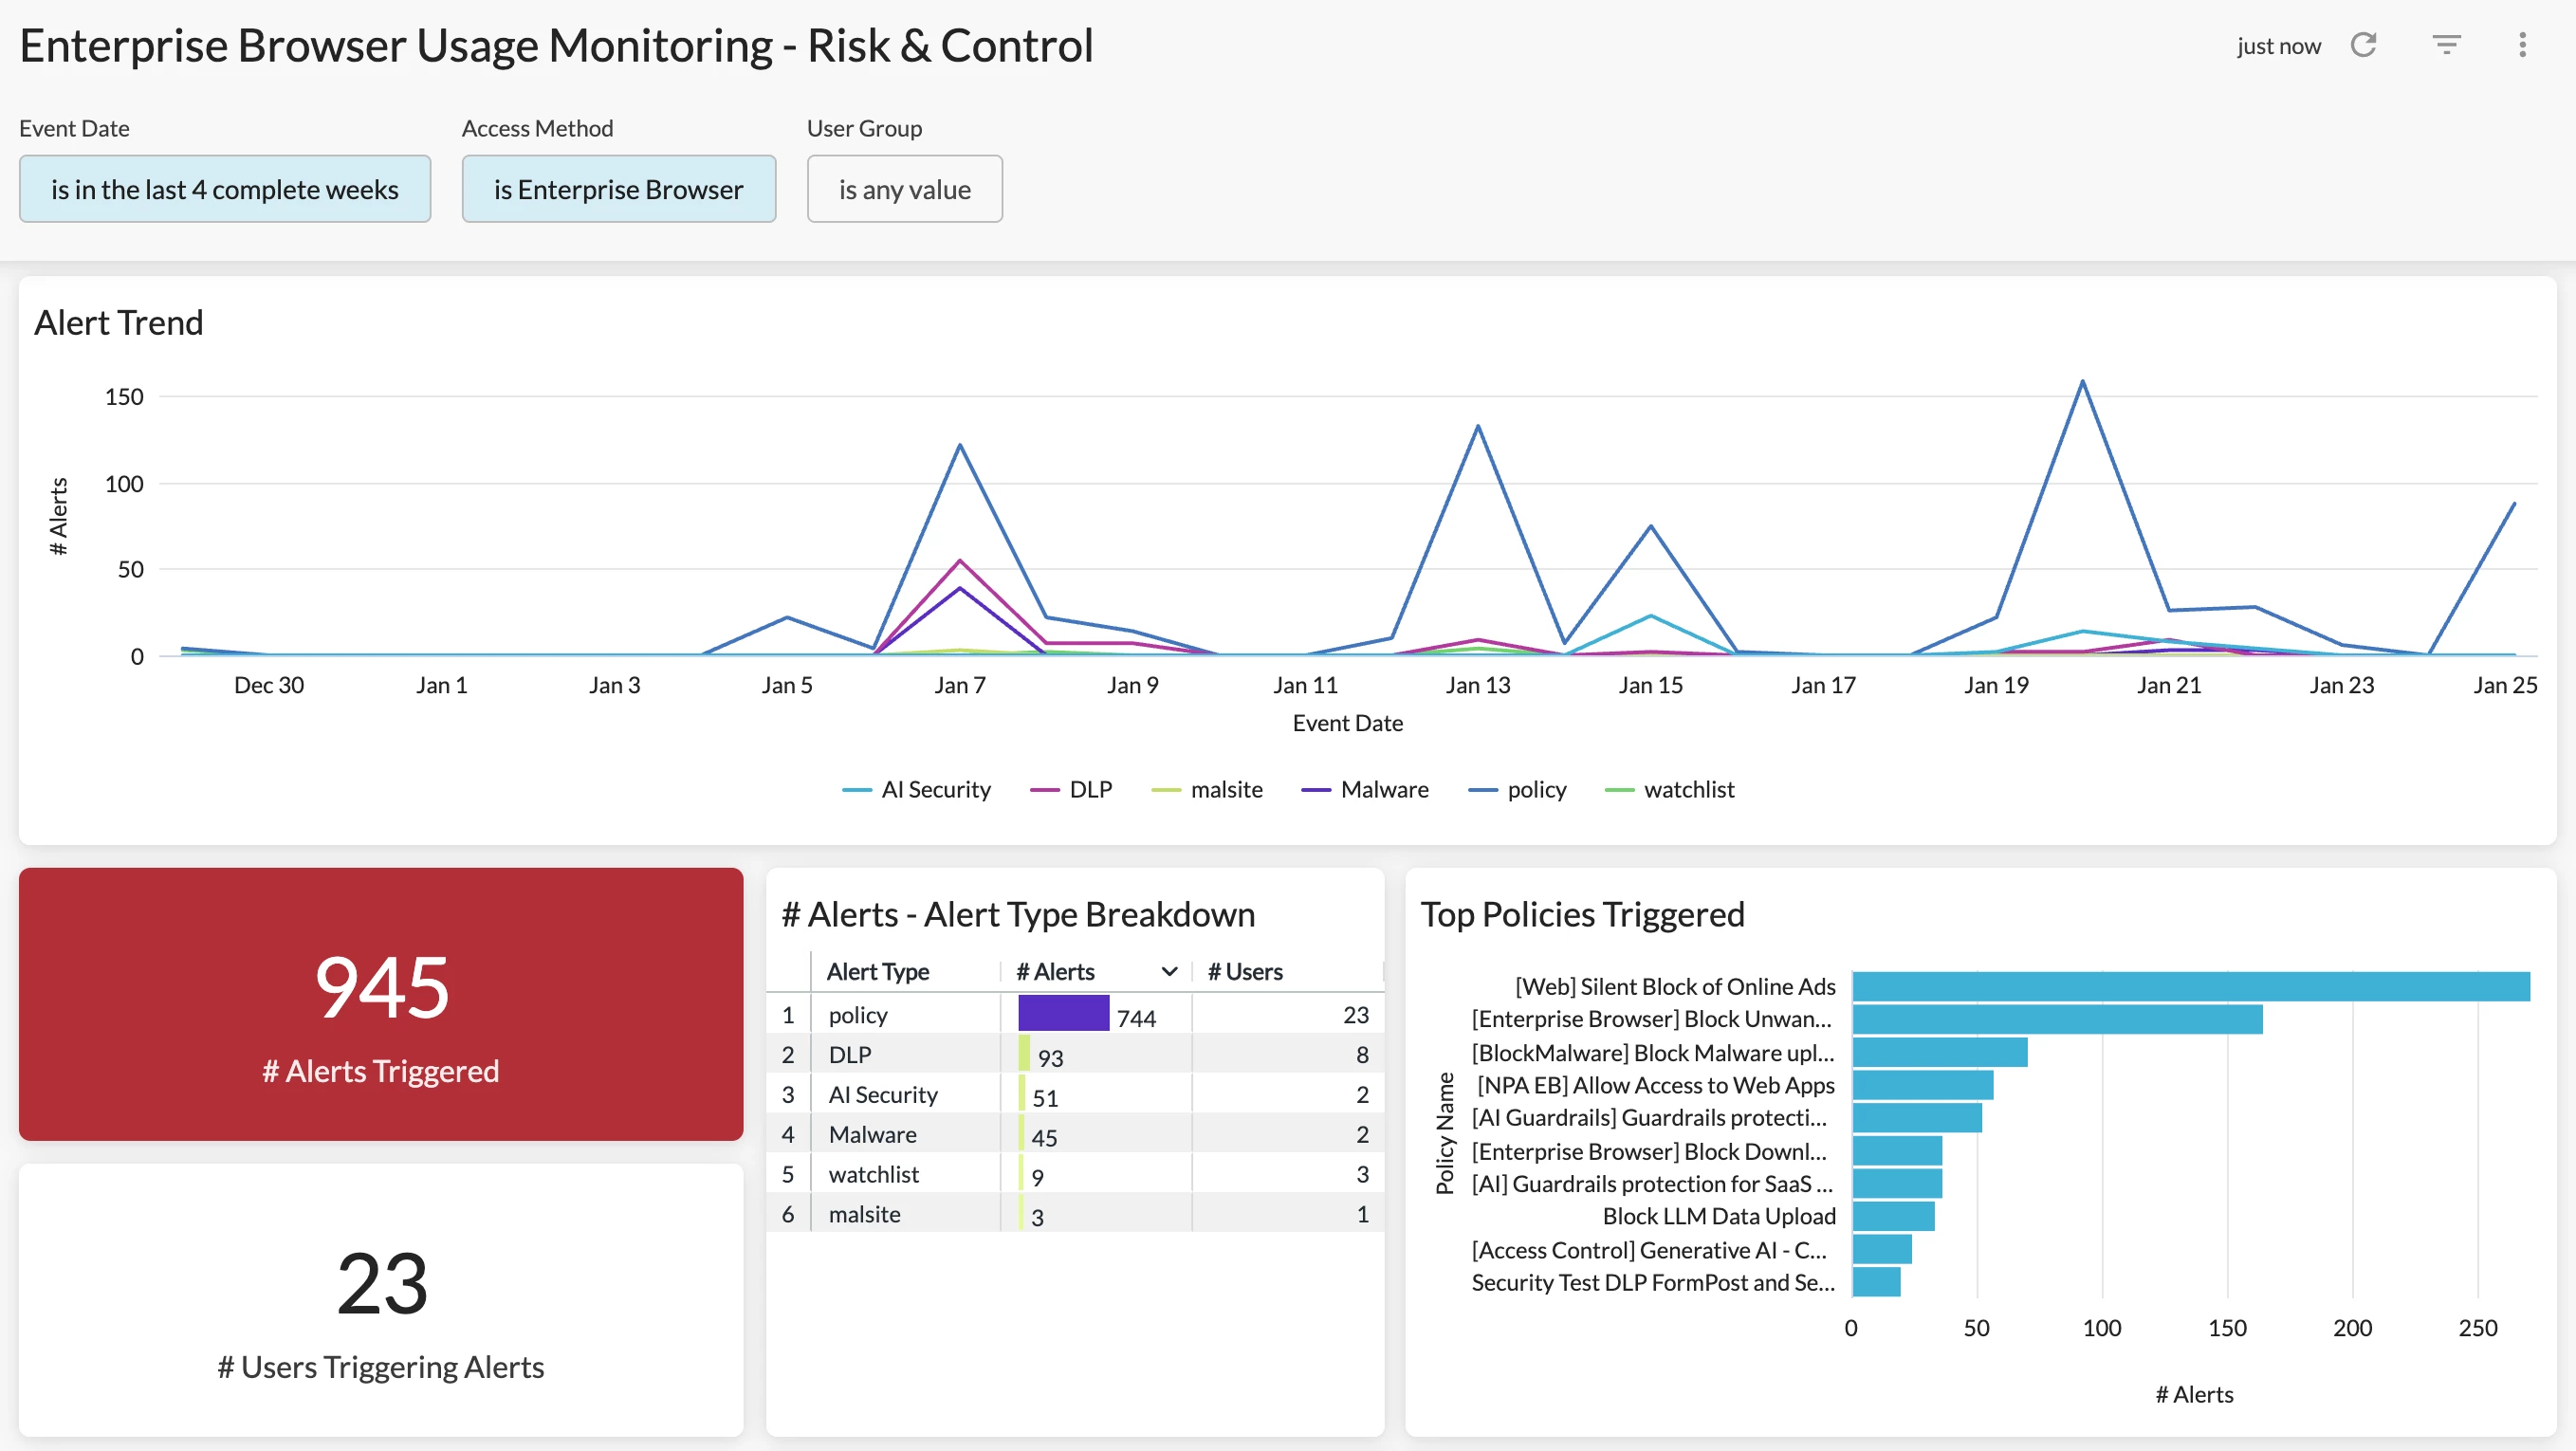
If you’re looking to drill into Enterprise Browser usage and better understand how security concerns such as sensitive data movement, cloud threats, and suspicious user behaviors are being controlled, this Enterprise Browser Usage Monitoring - Risk & Control Dashboard can help.
To learn more about the use cases for Enterprise Browser, watch our demo video here.
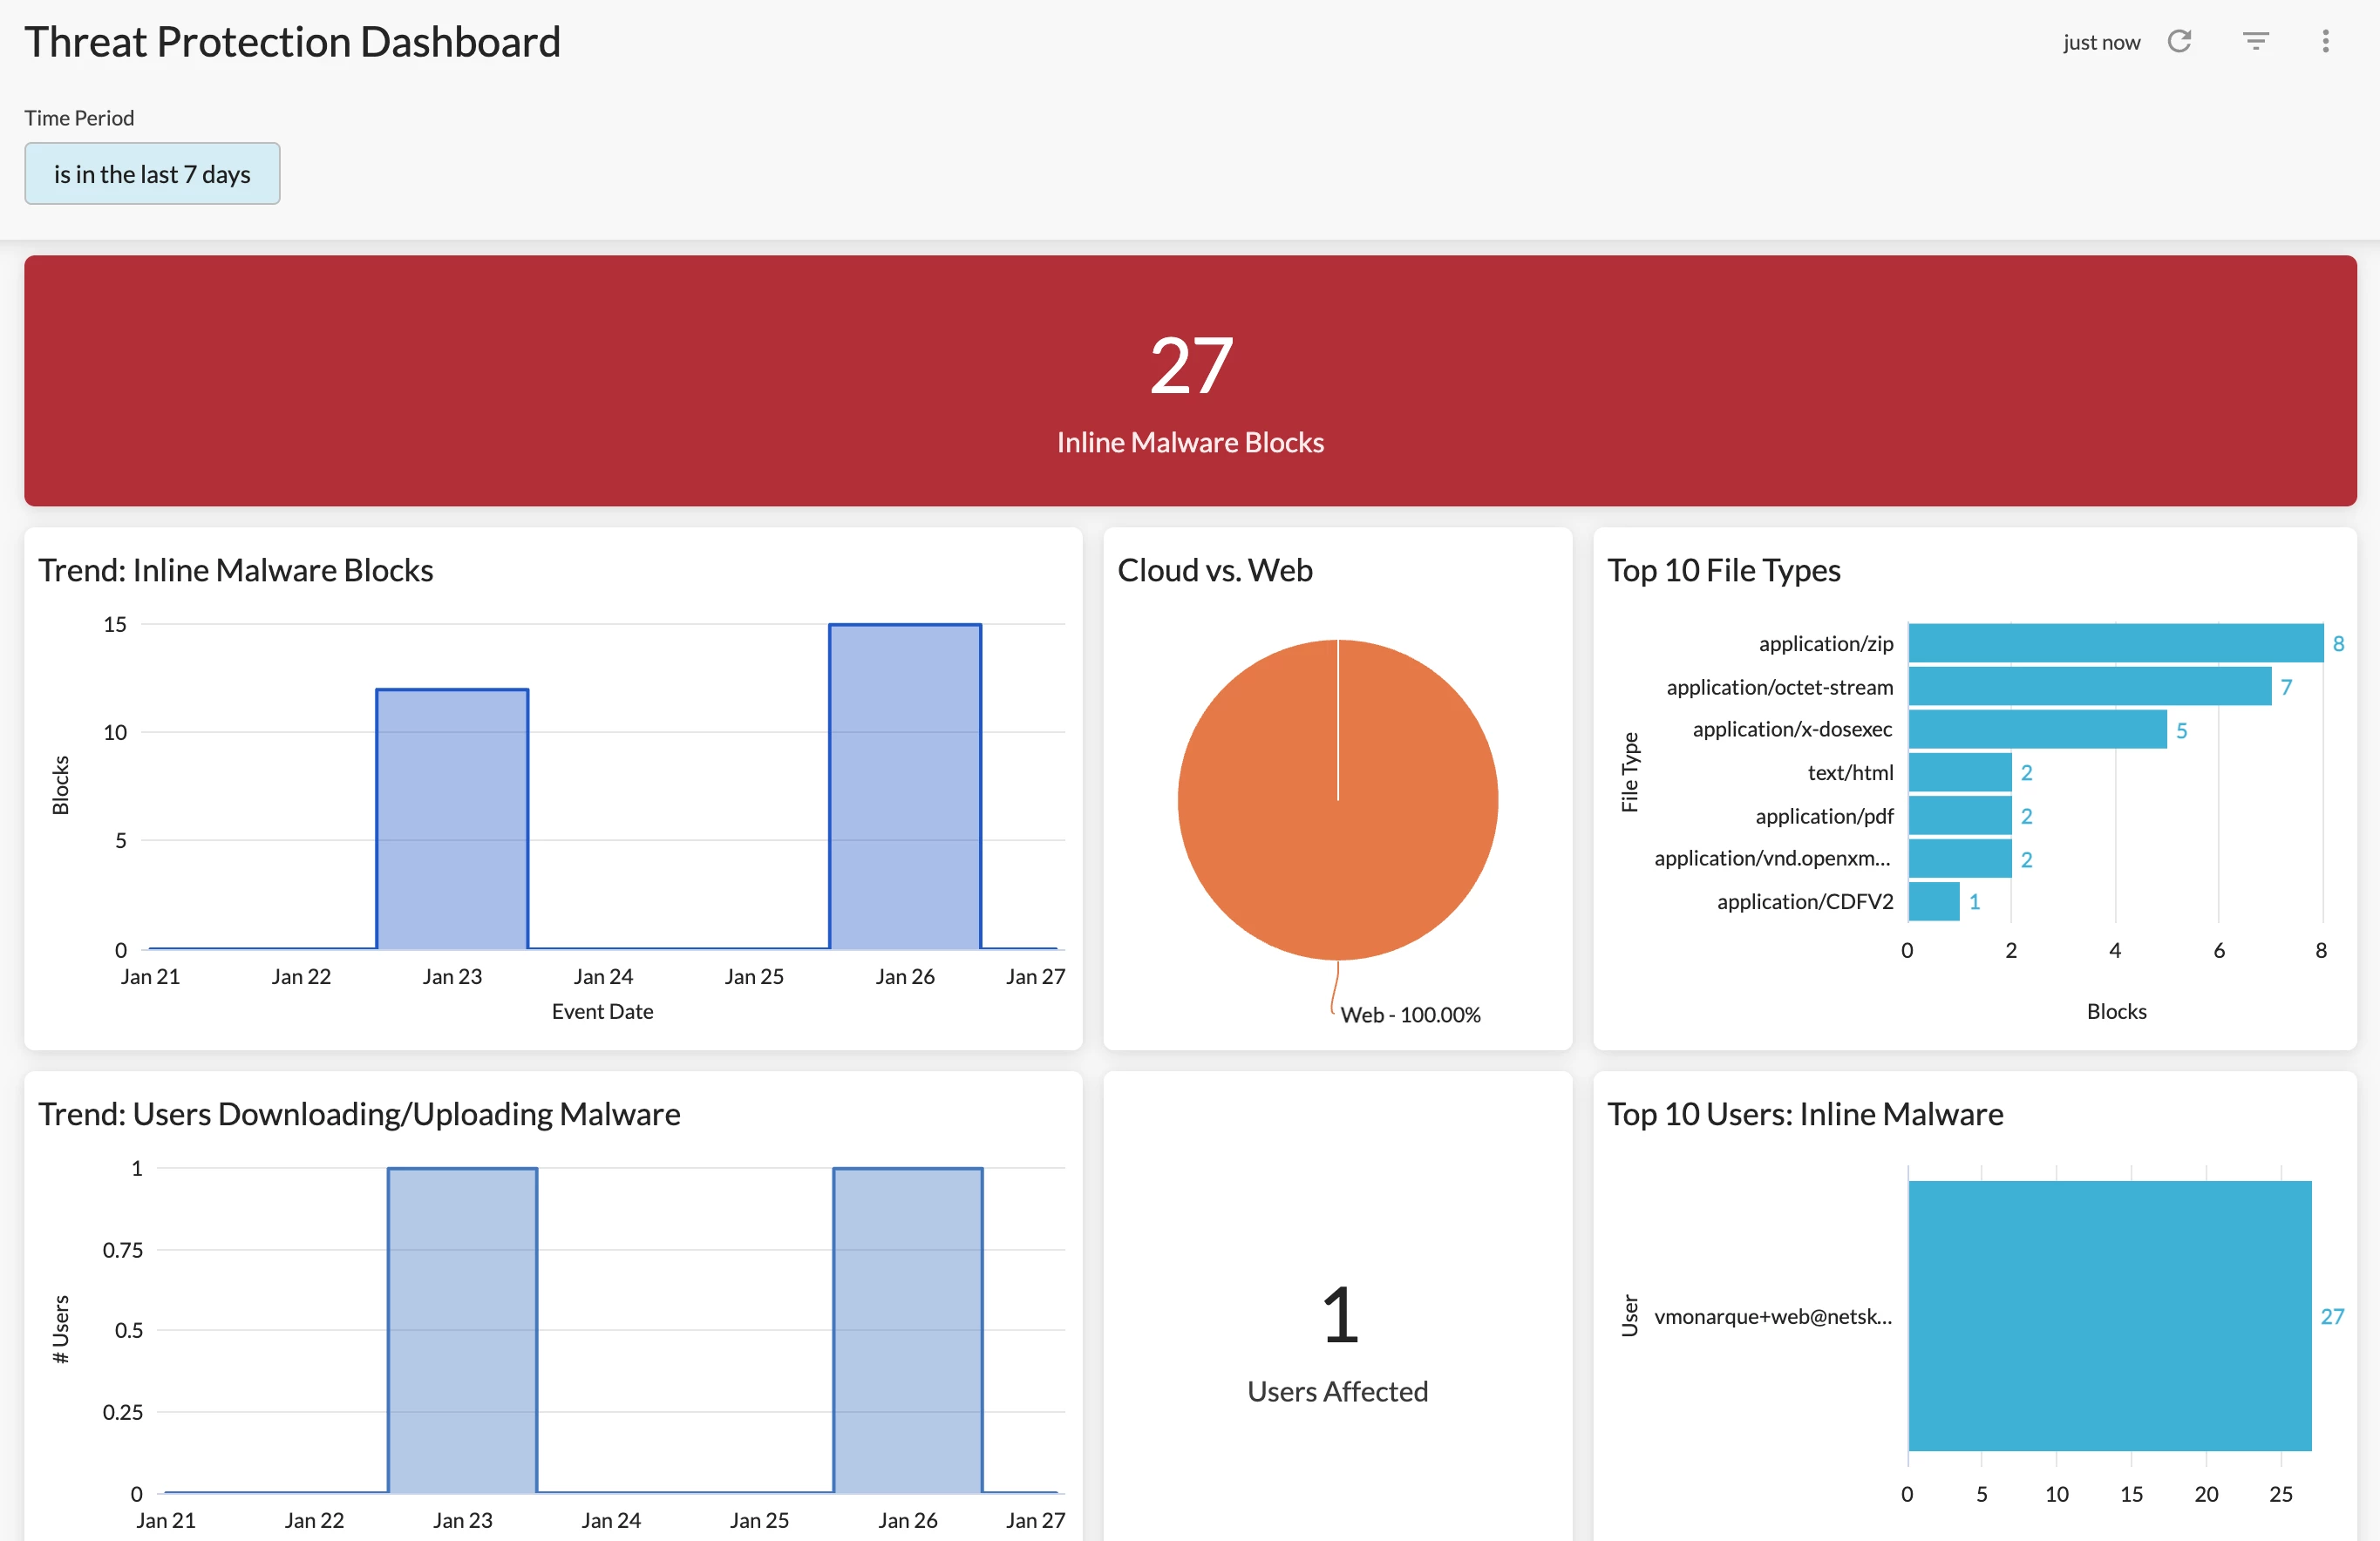
Q: Does Advanced Analytics provide visibility into threat protection?
A: Yes. The Threat Protection Dashboard in Netskope Library is a great starting point. The dashboard provides comprehensive visibility into cloud threats detected by your policies such as malware, malicious sites, & compromised credentials.
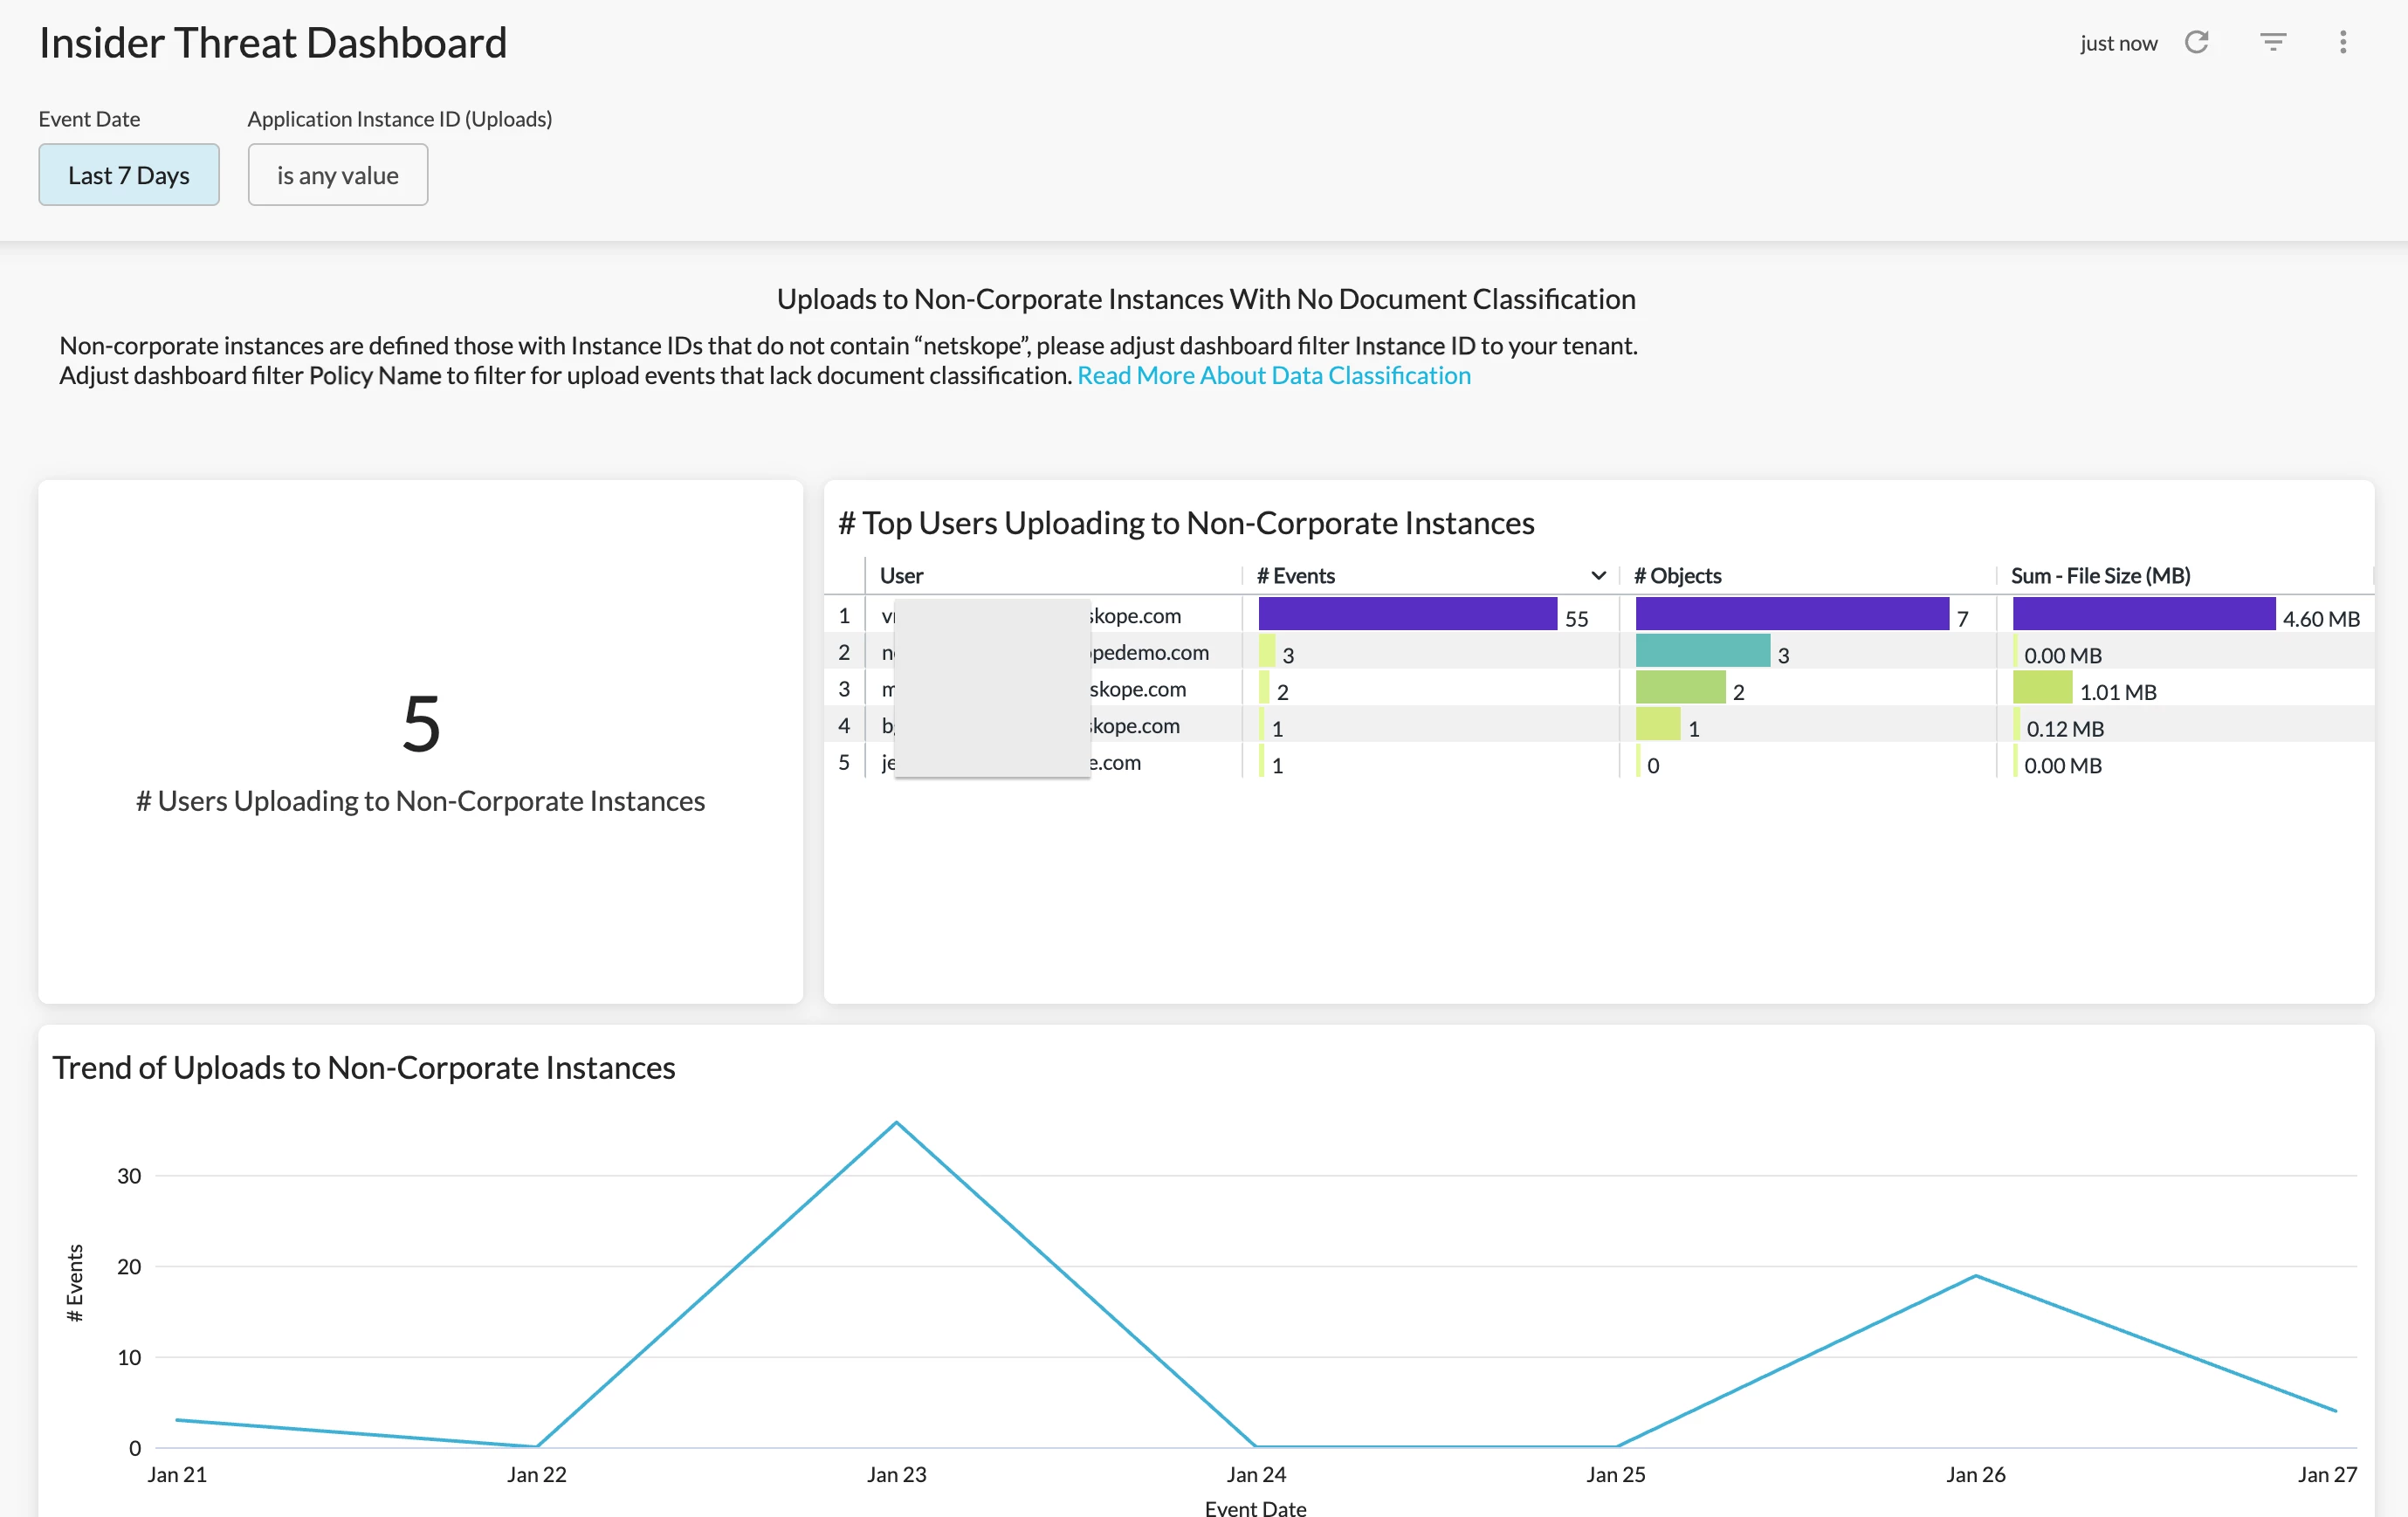
If you are interested in insider threat, e.g. intentional risky behaviors, the Insider Threat Dashboard is a great option.
Q: When I go to Advanced Analytics > Netskope Library > Threat Protection Dashboard, I get the warning message "You don't have permission to access data using (Endpoint Events). Some widgets may not display correctly." What does that mean?
A: This warning message shows up for two reasons:
- Your tenant does not have Endpoint DLP enabled (the most common reason): If your tenant does not have Netskope Endpoint DLP enabled, the Endpoint Events data collection in Advanced Analytics will not be accessible. Please reach out to your Netskope account team to check Endpoint DLP enablement for your tenant.
- Your user role is not configured with view/manage access to Endpoint Events: If your tenant has Netskope Endpoint DLP enabled but your user role does not include view/manage access to Endpoint Events, this data collection will not be accessible either. Your data access can be checked through RBAC settings.
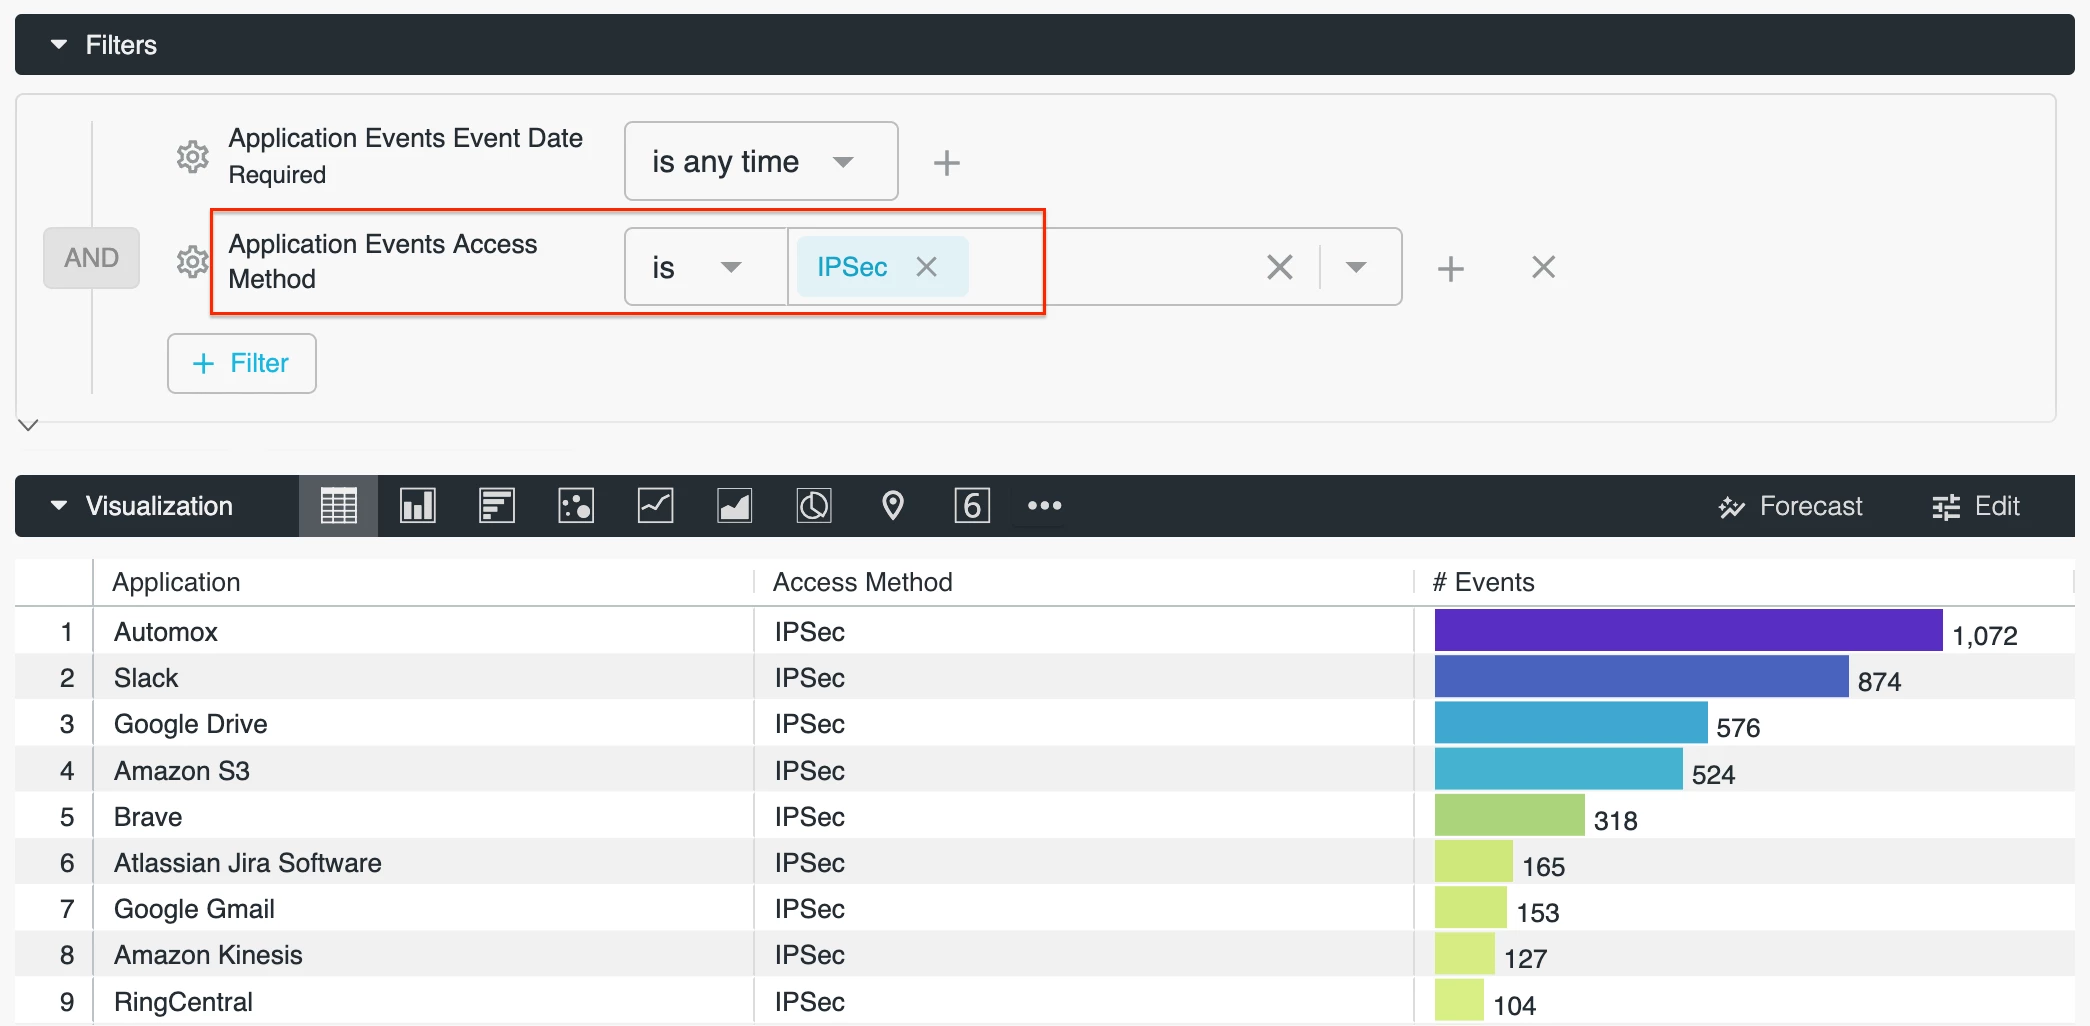
Q: How can I use Advanced Analytics to find applications that initiated traffic specifically for IPSec?
A: The “Access Method” field can help. By applying the filter “Access Method == IPSec,” applications with IPSec traffic generated will be returned.
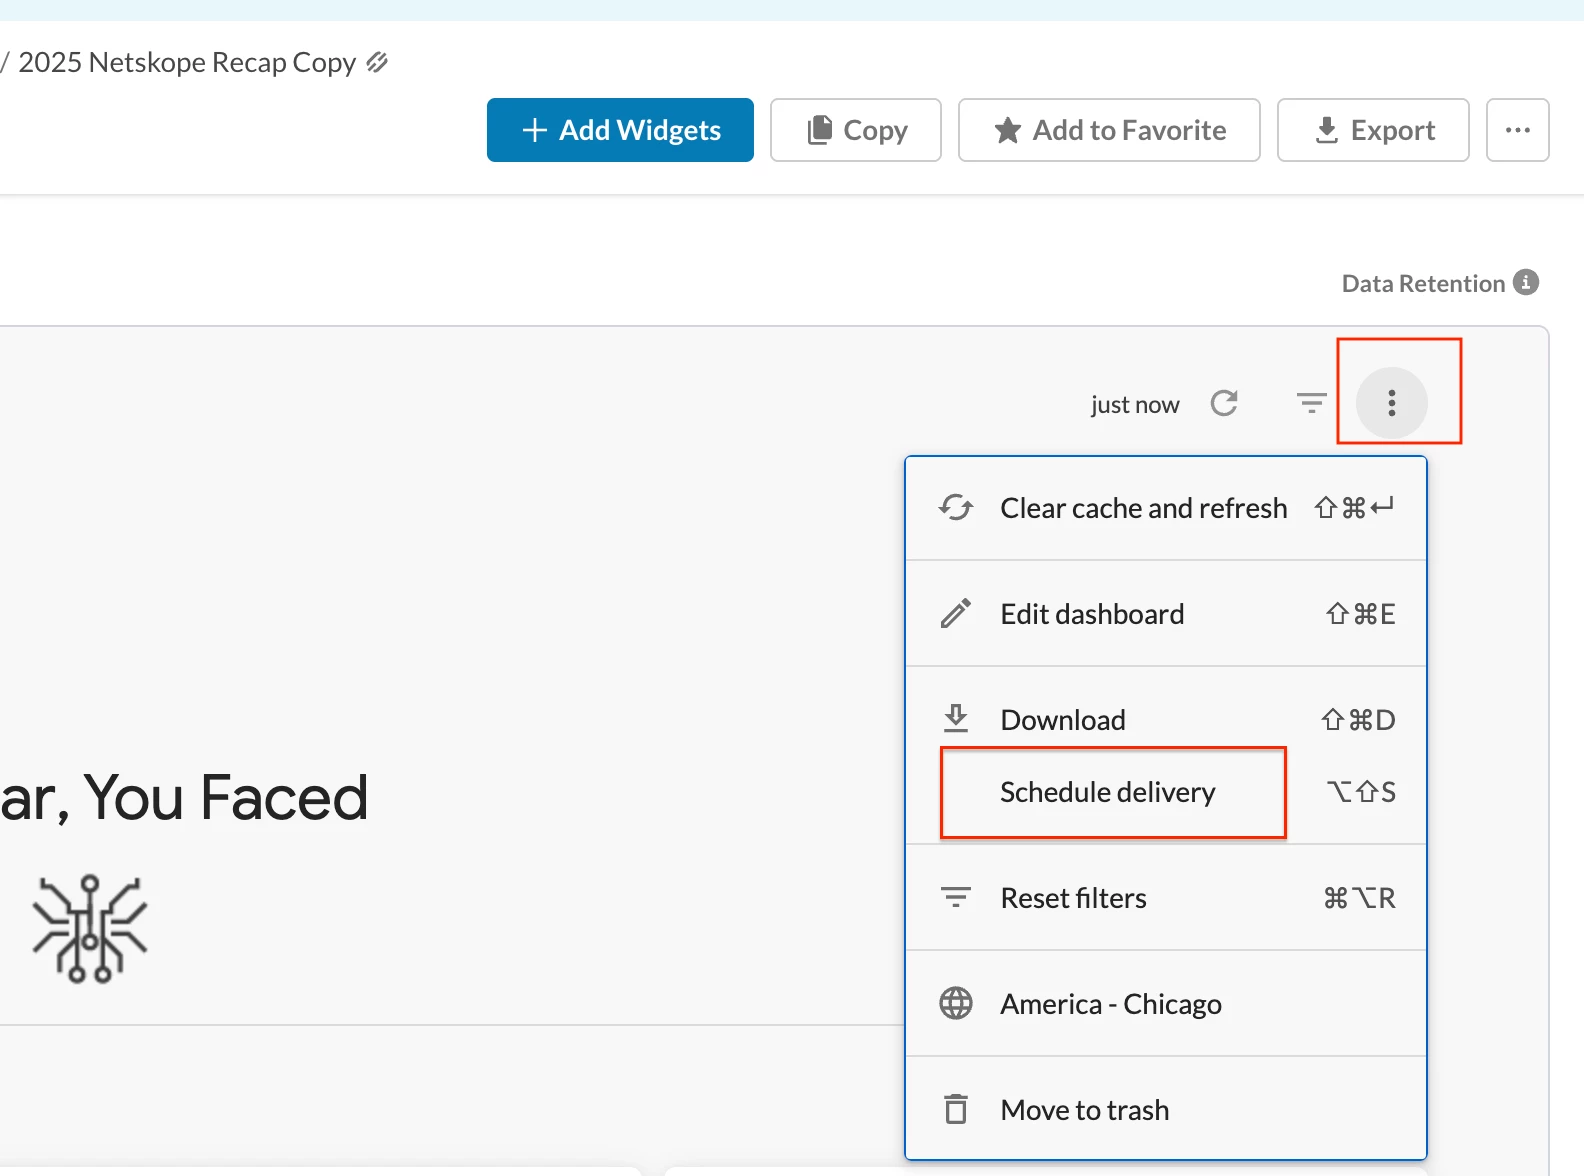
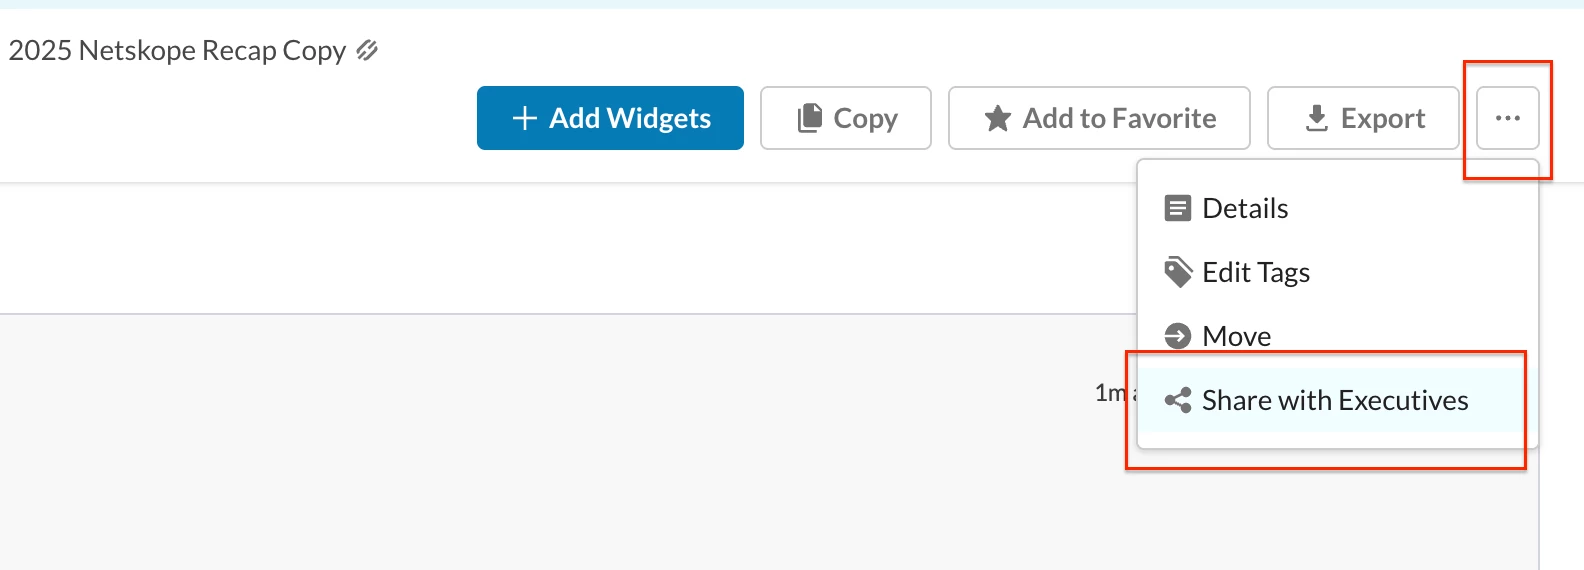
Q: Can Advanced Analytics dashboards be scheduled and emailed as PDFs or as links?
A: Yes. The “Schedule delivery” feature allows you to send a PDF copy of your dashboard to your recipient on a daily/weekly/monthly basis. More details can be found here.
If the recipient does not have access to Advanced Analytics, the “Share with Executives” feature can email the link of your dashboard and grant the recipient temporary access to it. More details can be found here.
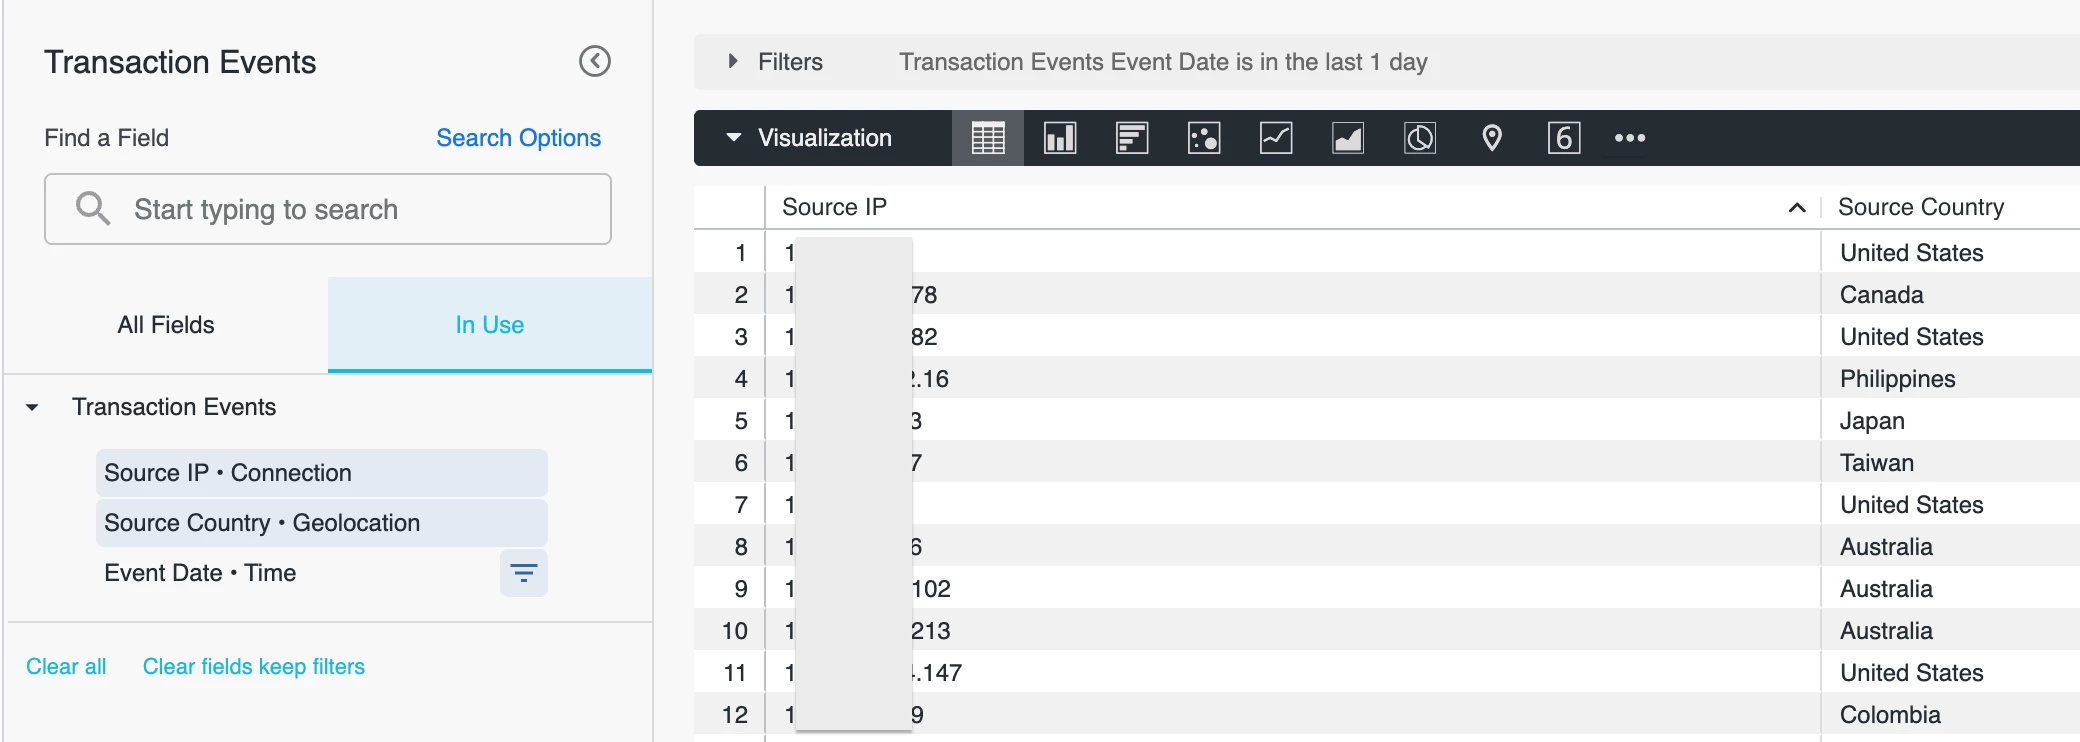
Q: Is it possible to show user location IP addresses in Advanced Analytics?
A: Sure. The “Source IP” field can help.
Q: Are we able to see email activities through Advanced Analytics?
A: Yes. Check out our latest Webmail SMTP DLP Dashboard. This dashboard provides visibility into webmail activities captured by Netskope SMTP Proxy and the corresponding DLP policy violations. Use this dashboard to better understand:
- What email aliases/alternate email addresses (From User) are being used by users in your organization
- What DLP policy violations have been triggered by the webmail traffic
- Who are the users generating this traffic and triggering the policy violations
- What actions have been taken by your DLP policies
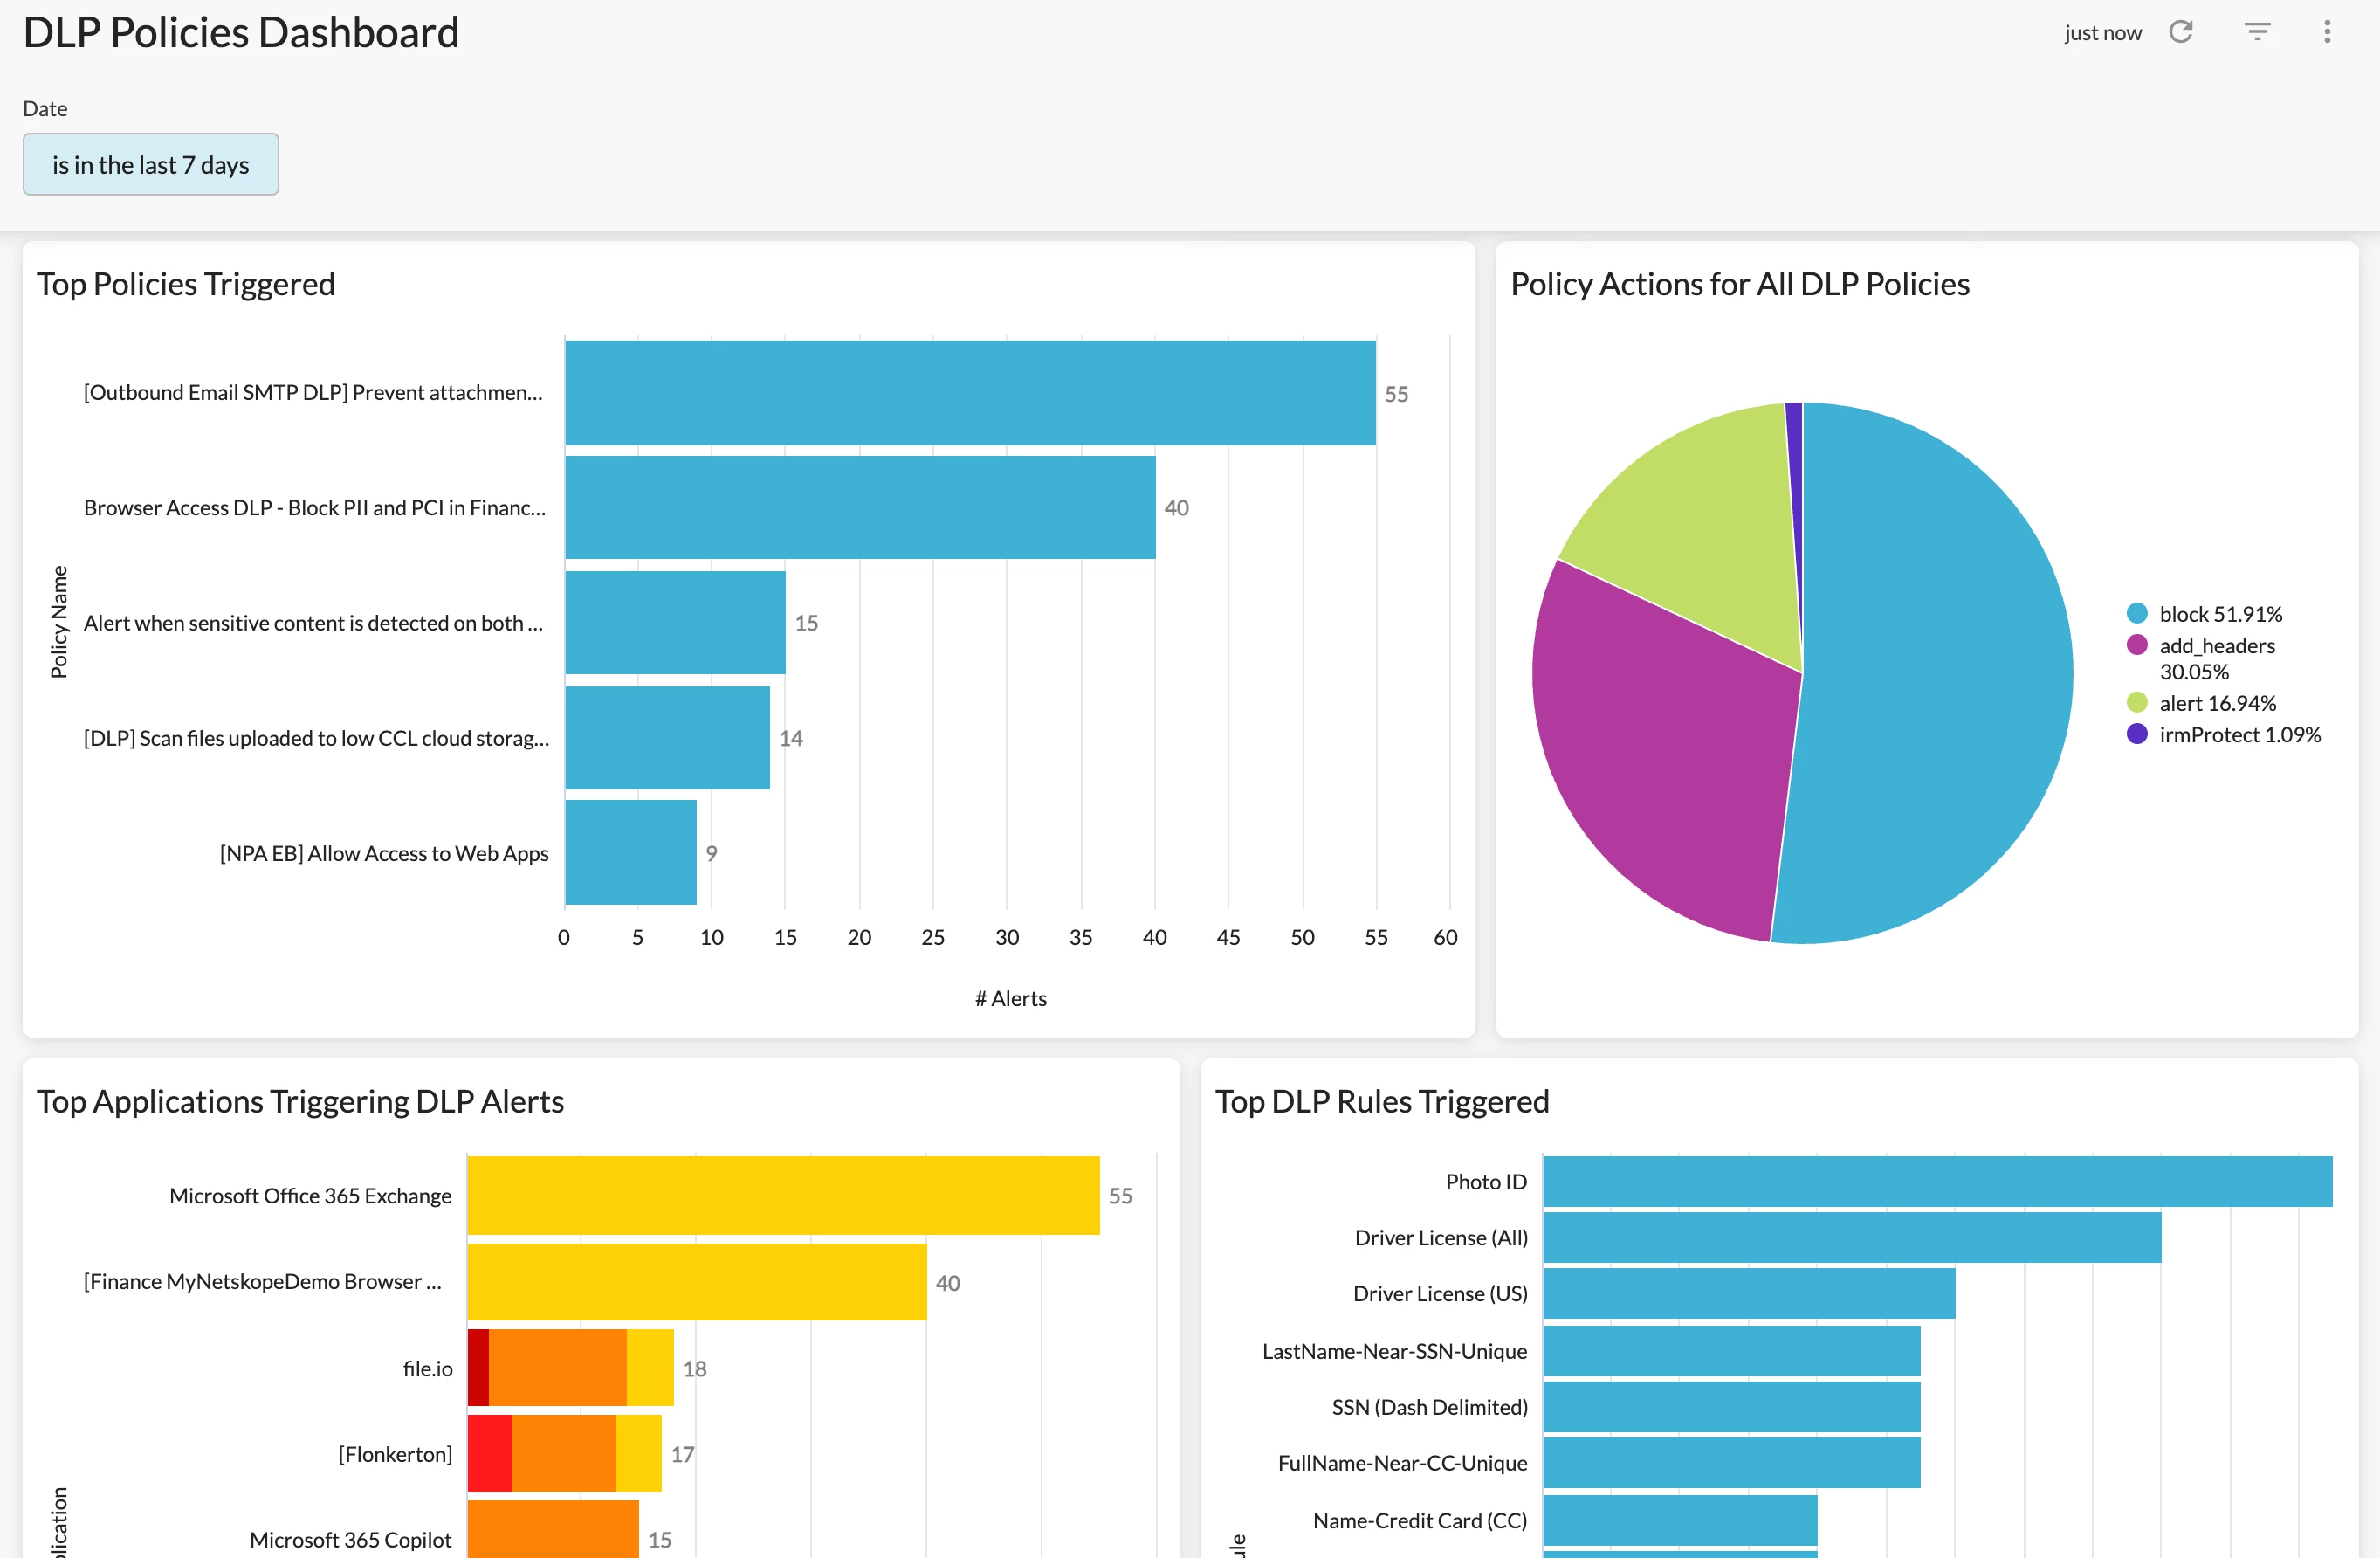
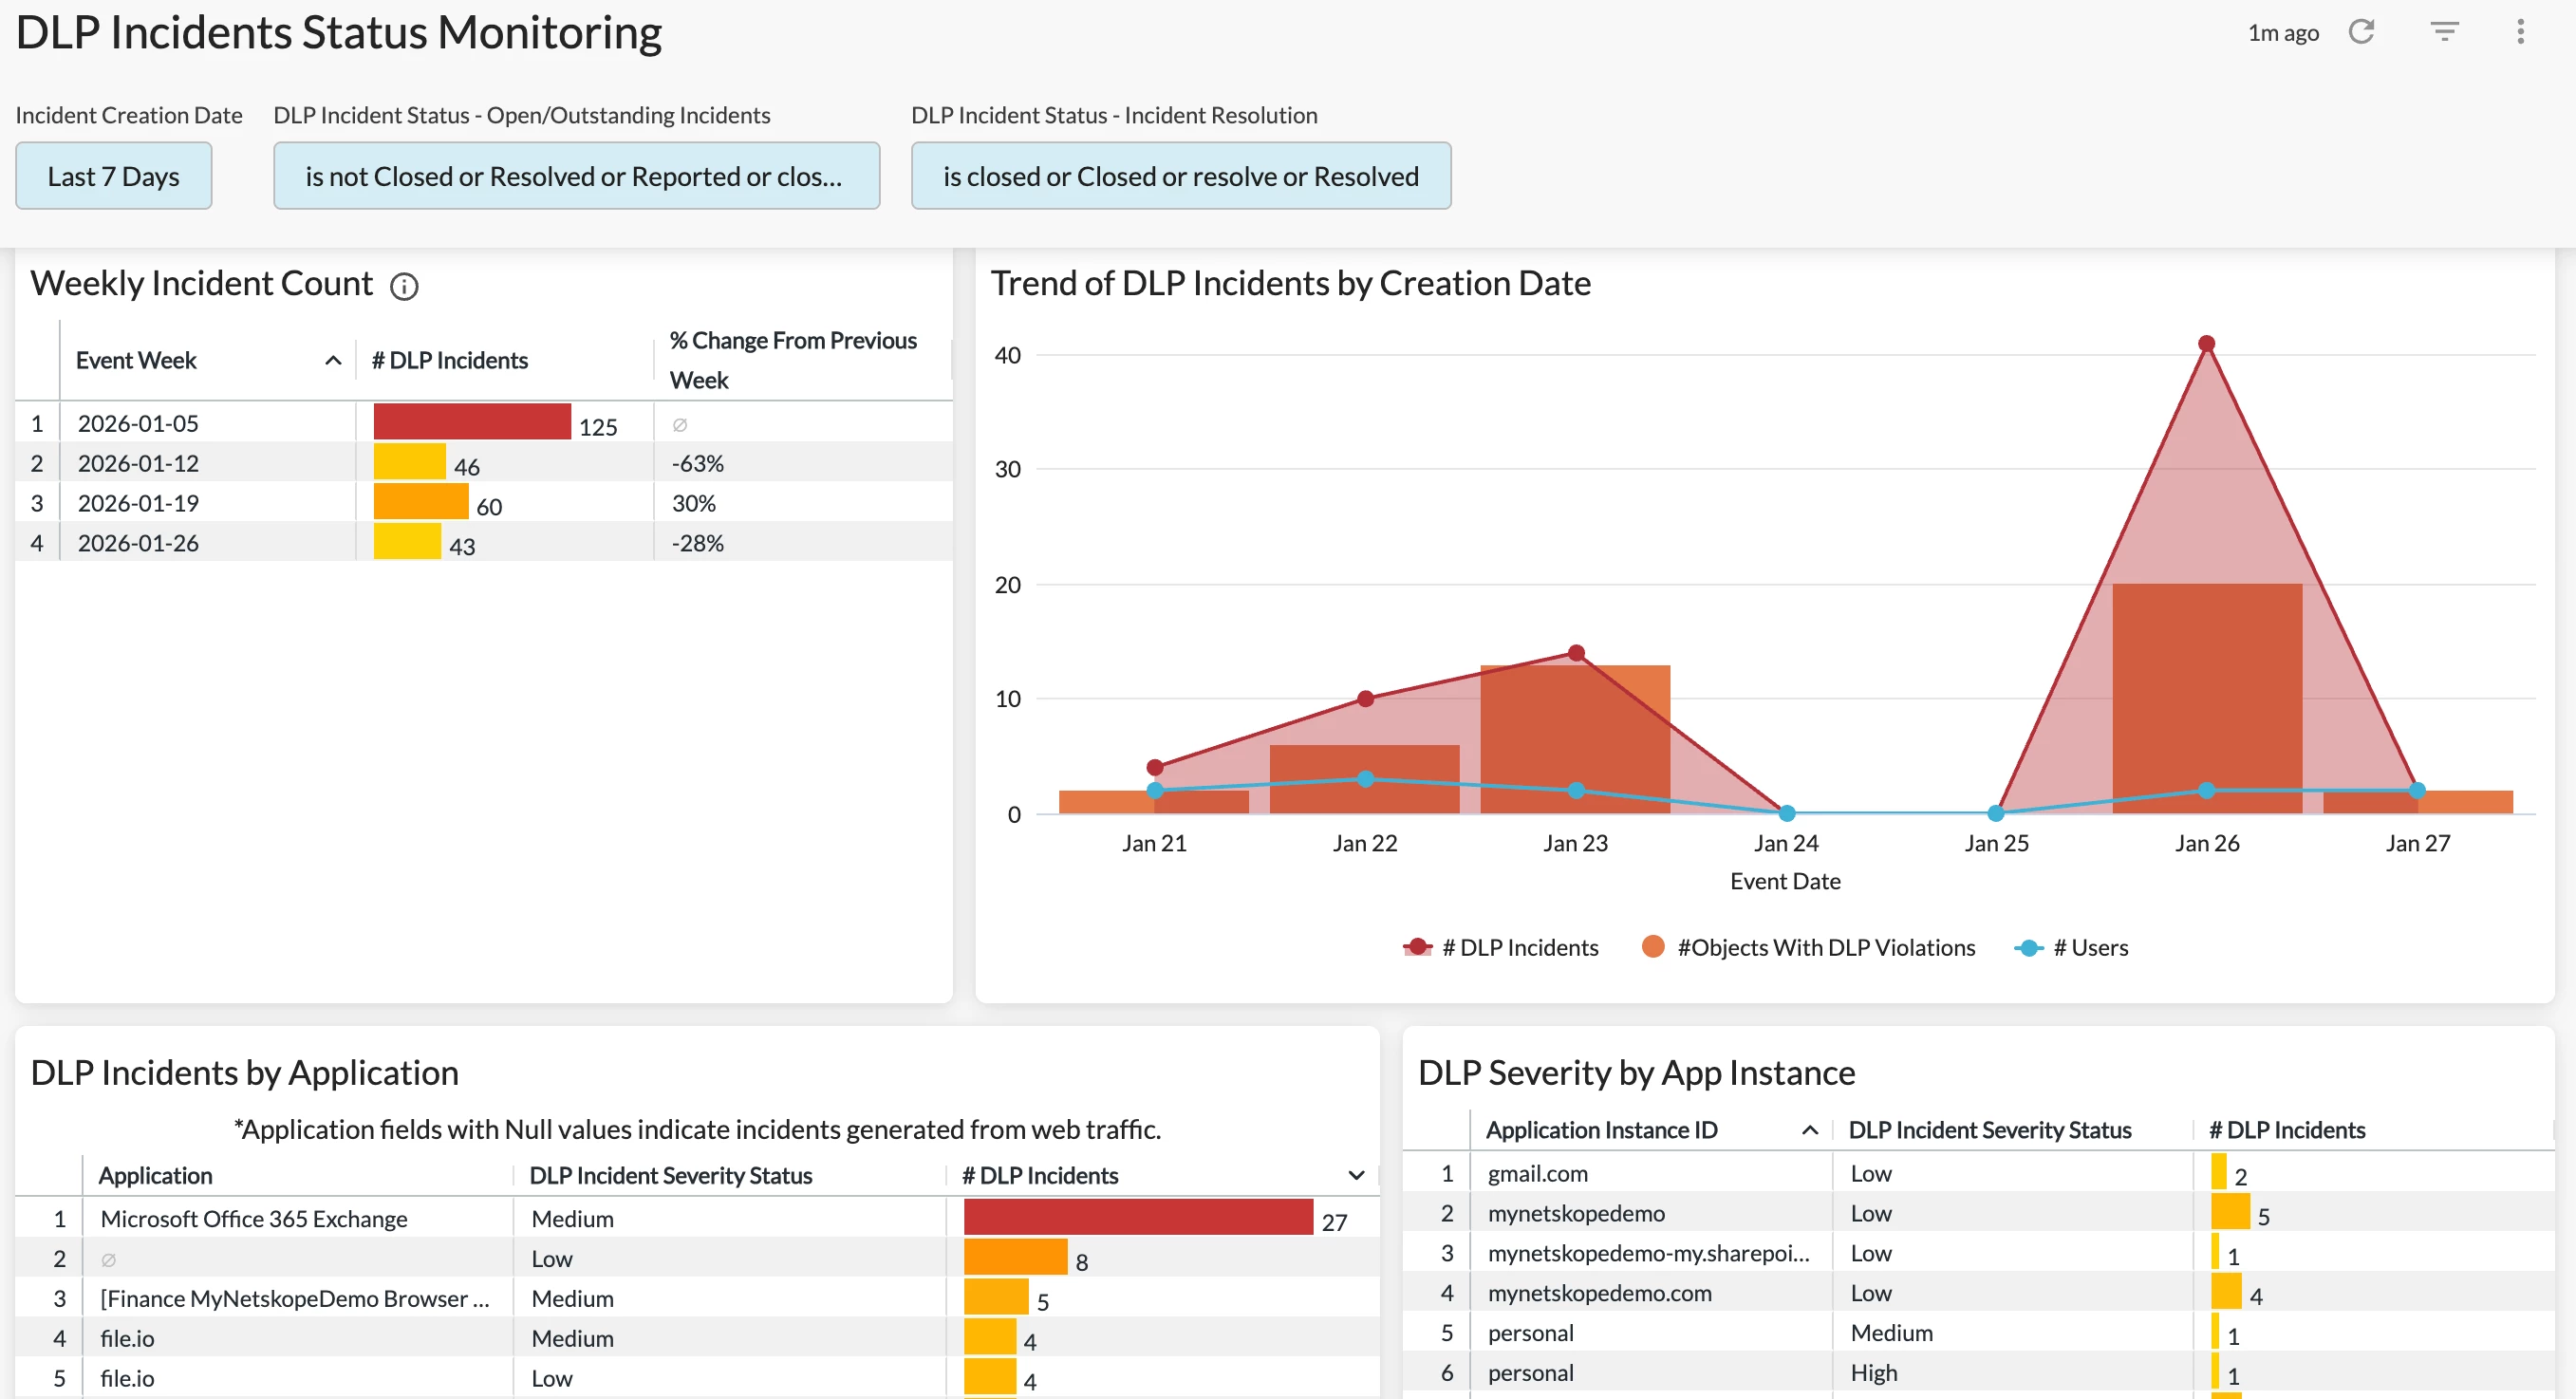
Q: What are the recommended dashboards for DLP?
A: To measure your DLP policy effectiveness and identify policies that need to be tuned, we recommend starting with the DLP Policies Dashboard in Netskope Library. The dashboard provides visibility into DLP policies triggered, alerts generated, users triggering the alerts, and actions taken by the policies.
To investigate DLP incidents, the DLP Incidents Status Monitoring Dashboard in Netskope Library is a great starting point. The dashboard provides granular visibility into the DLP incidents in your environment, including incident status, incident resolution time, and policy details. Use this dashboard to investigate DLP incidents and monitor the incident response progress in your organization.
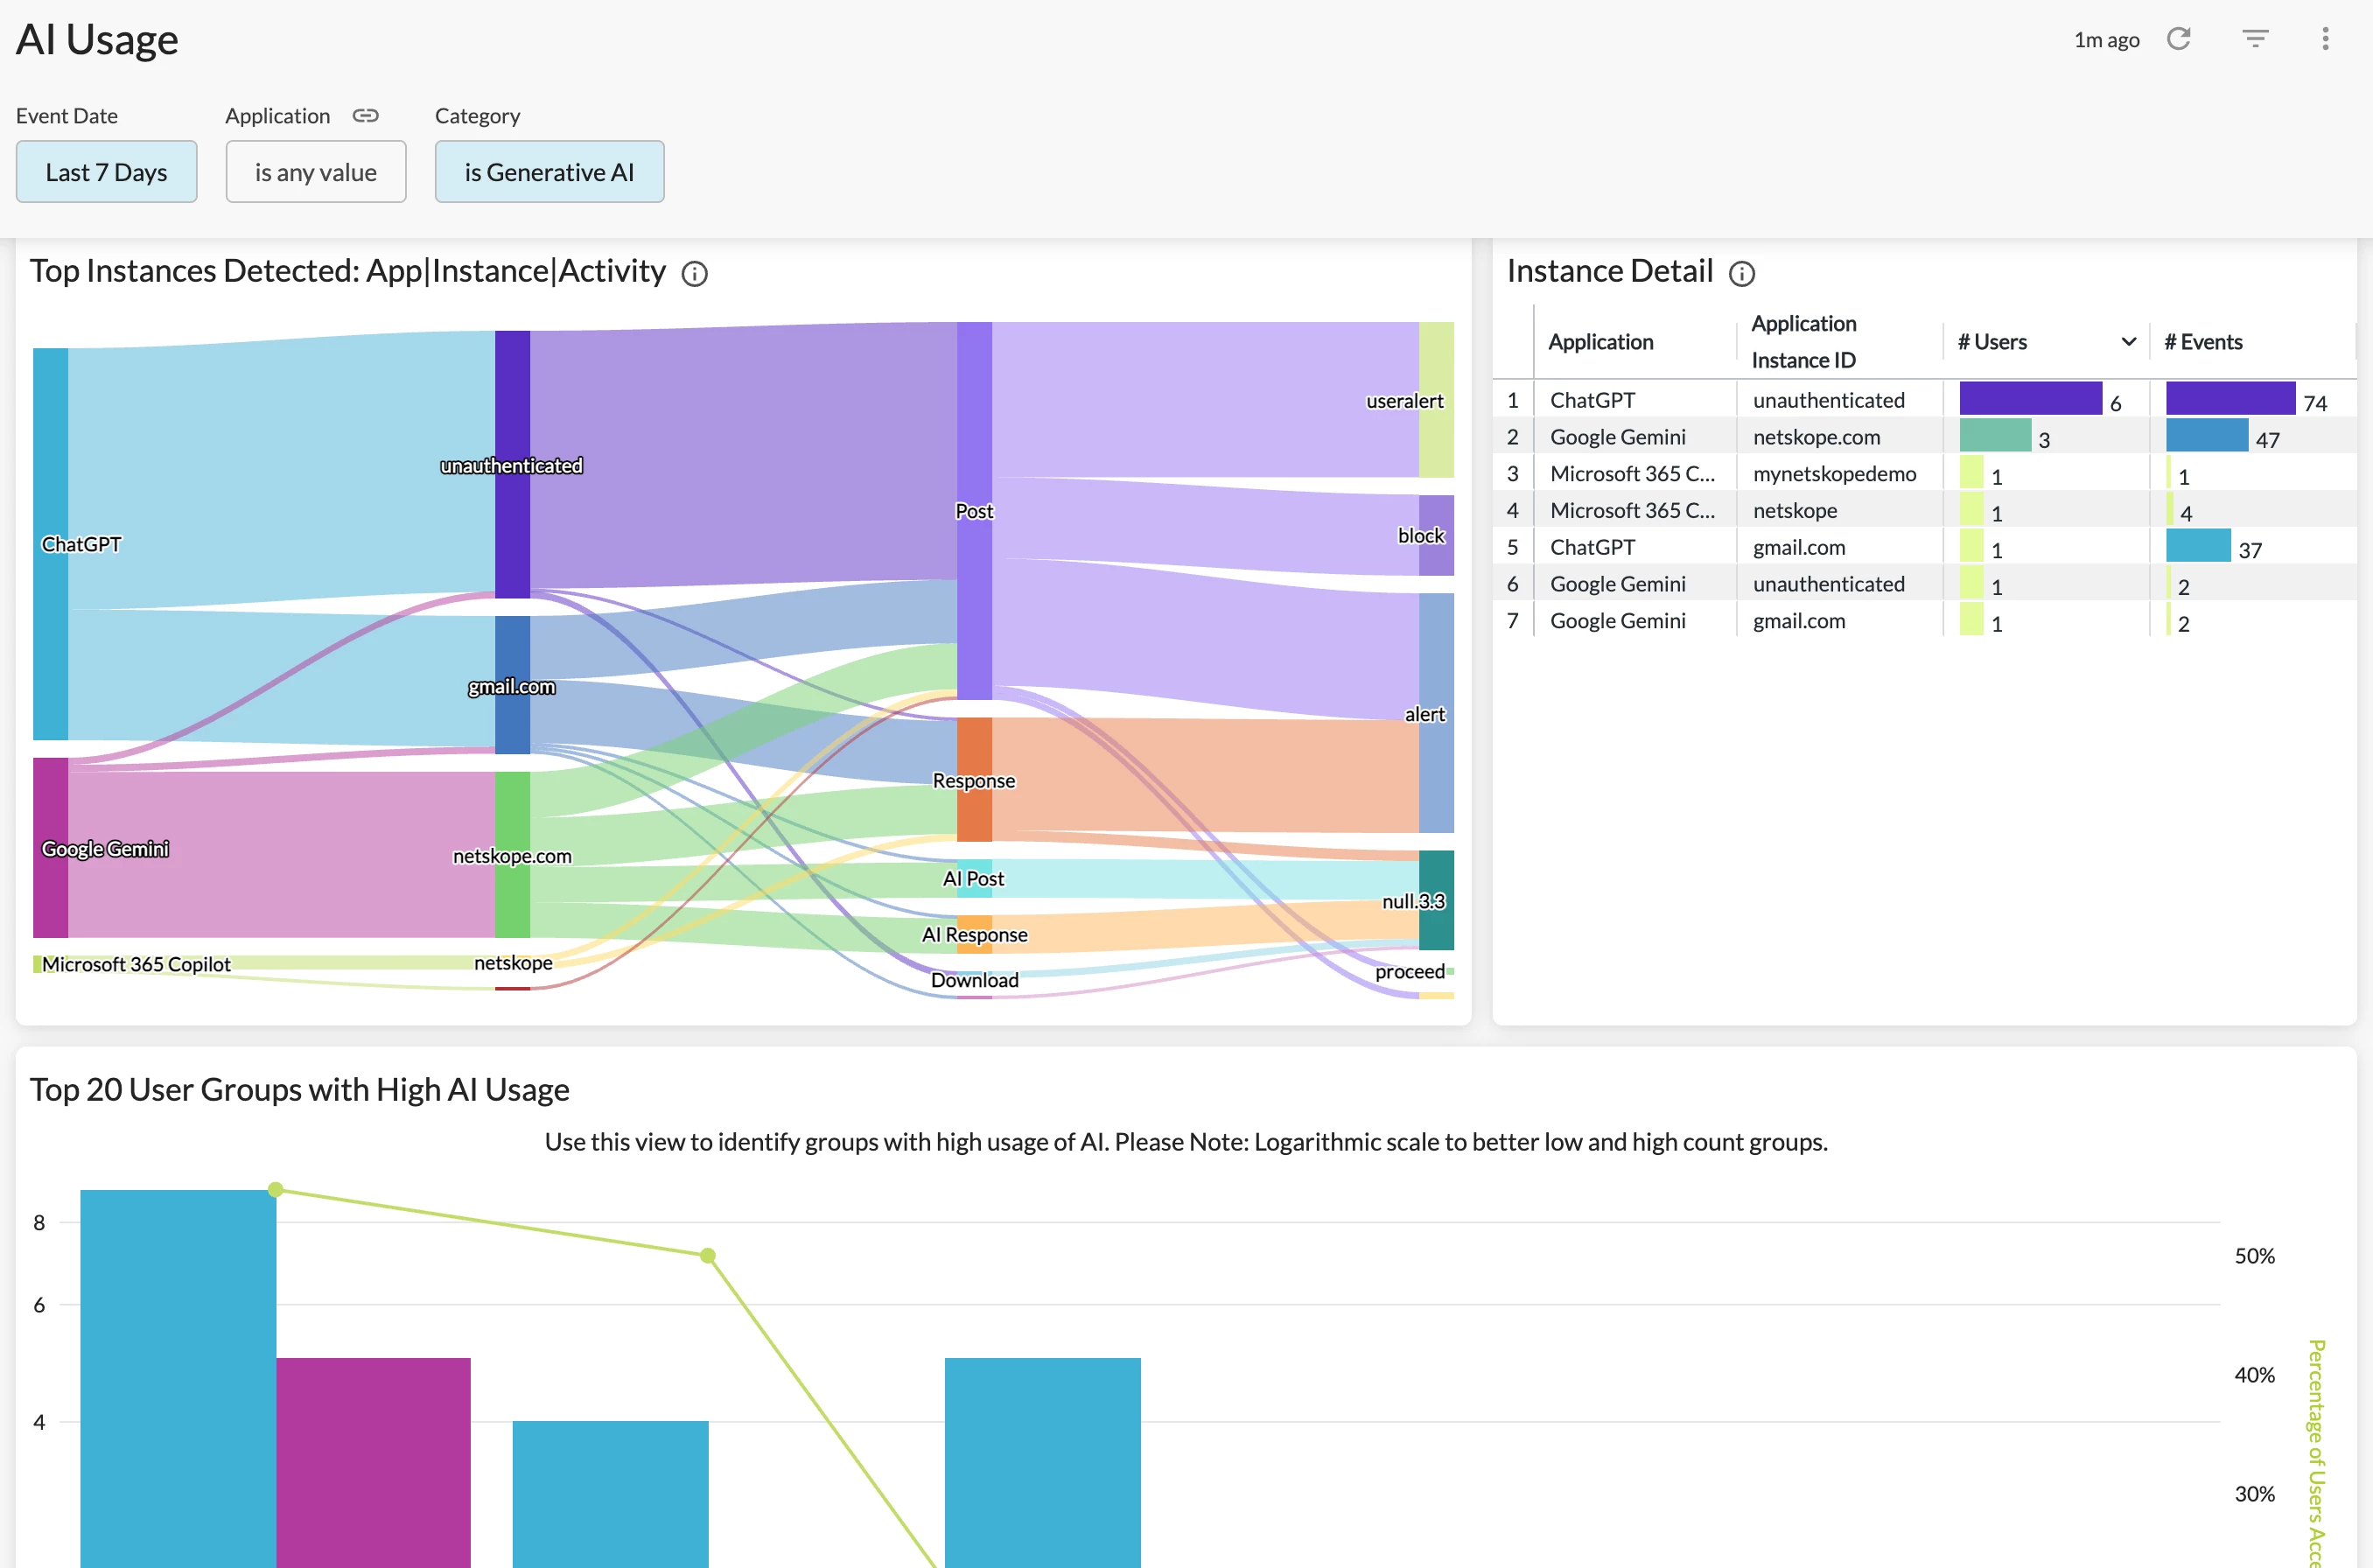
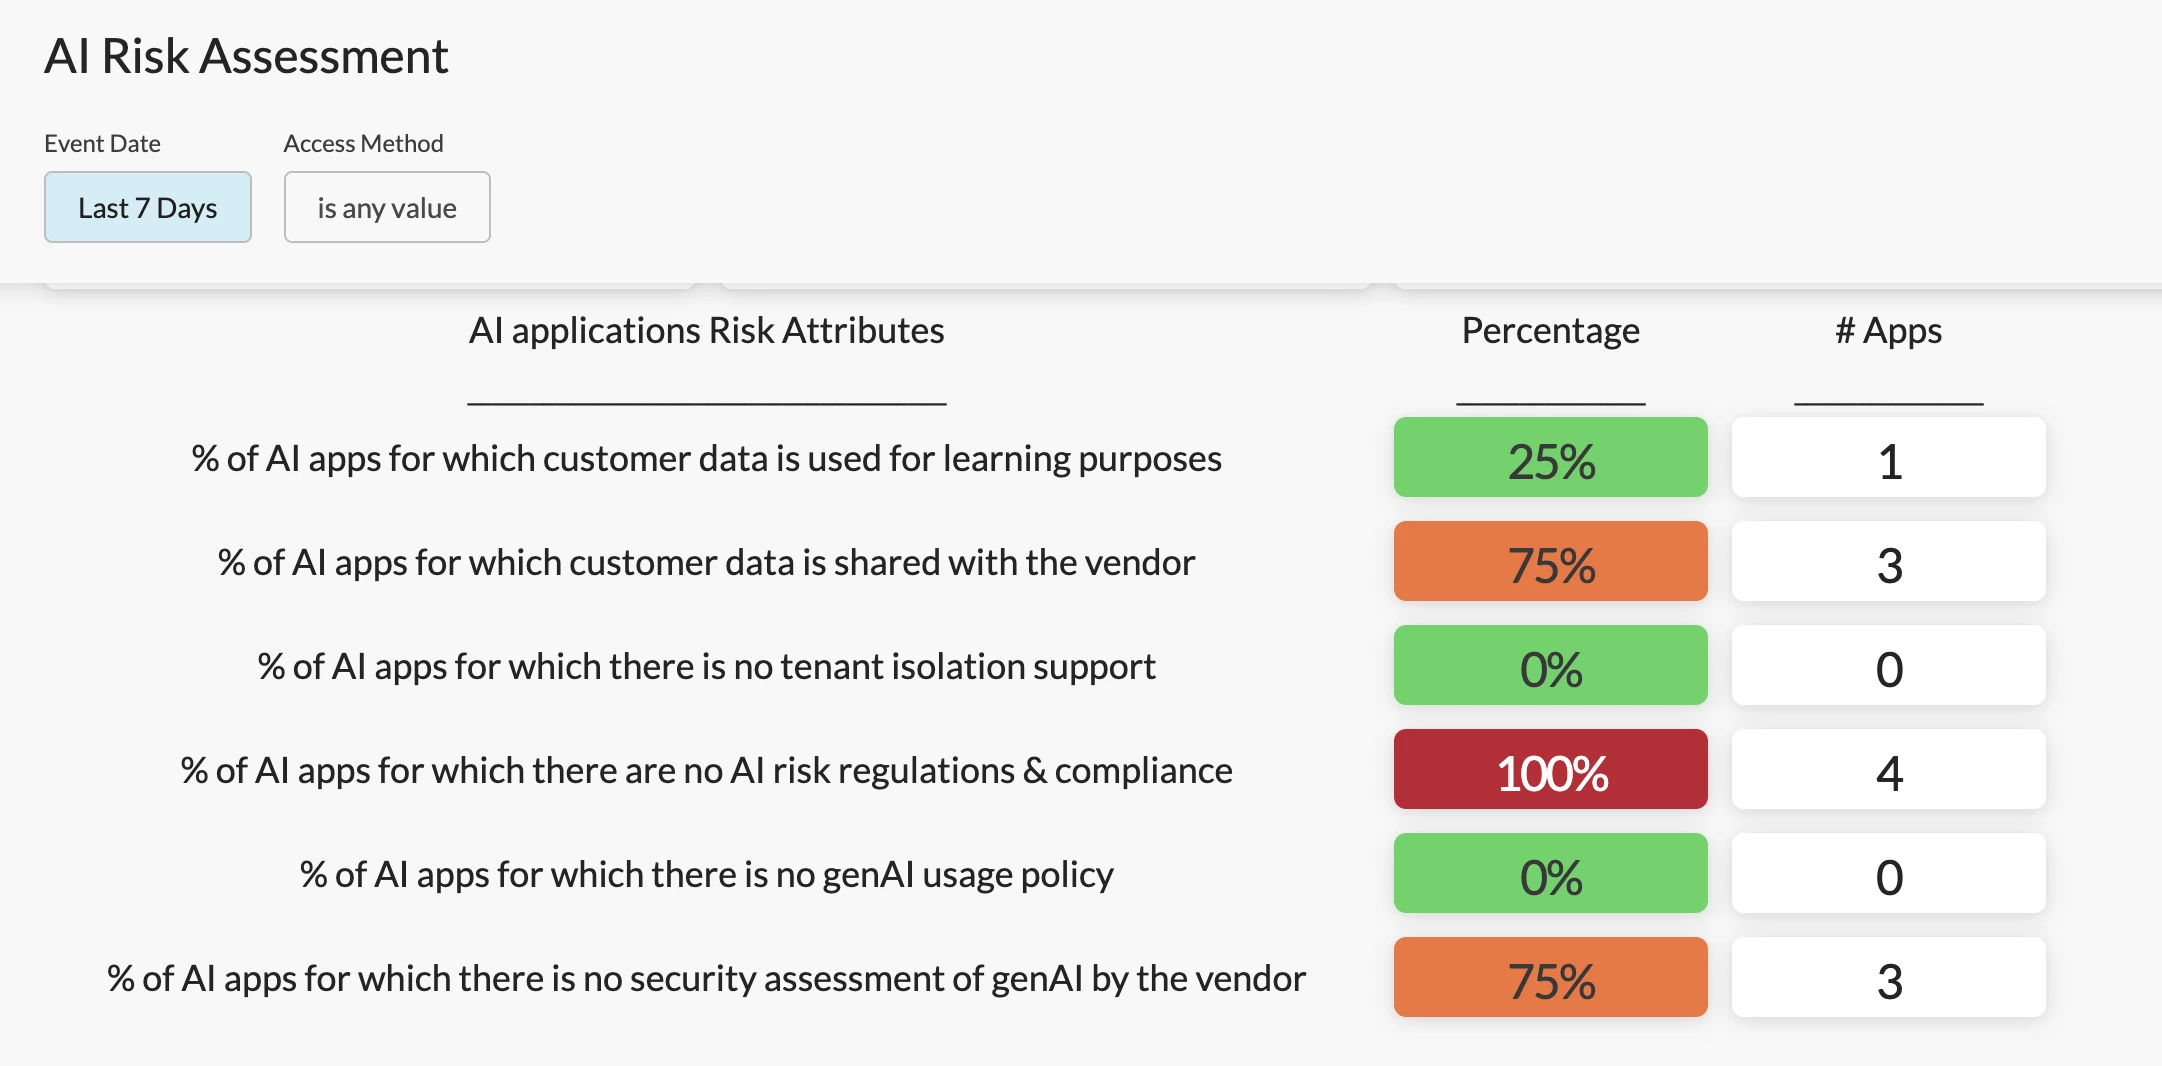
Q: How to monitor GenAI usage in my environment using Advanced Analytics?
A: The AI Usage Dashboard in Netskope Library provides comprehensive visibility into AI usage in your environment. Use this dashboard to identify trends/patterns of AI usage such as AI app usage trend, user group breakdown, activity summary, instance awareness, and policy action.
If you are looking for high-level data to gauge overall AI risk in your environment, the AI Risk Assessment Dashboard in Netskope Library is a great option.
Q: What are the main dashboards that can be used to detect emerging risks in the environment on a weekly basis?
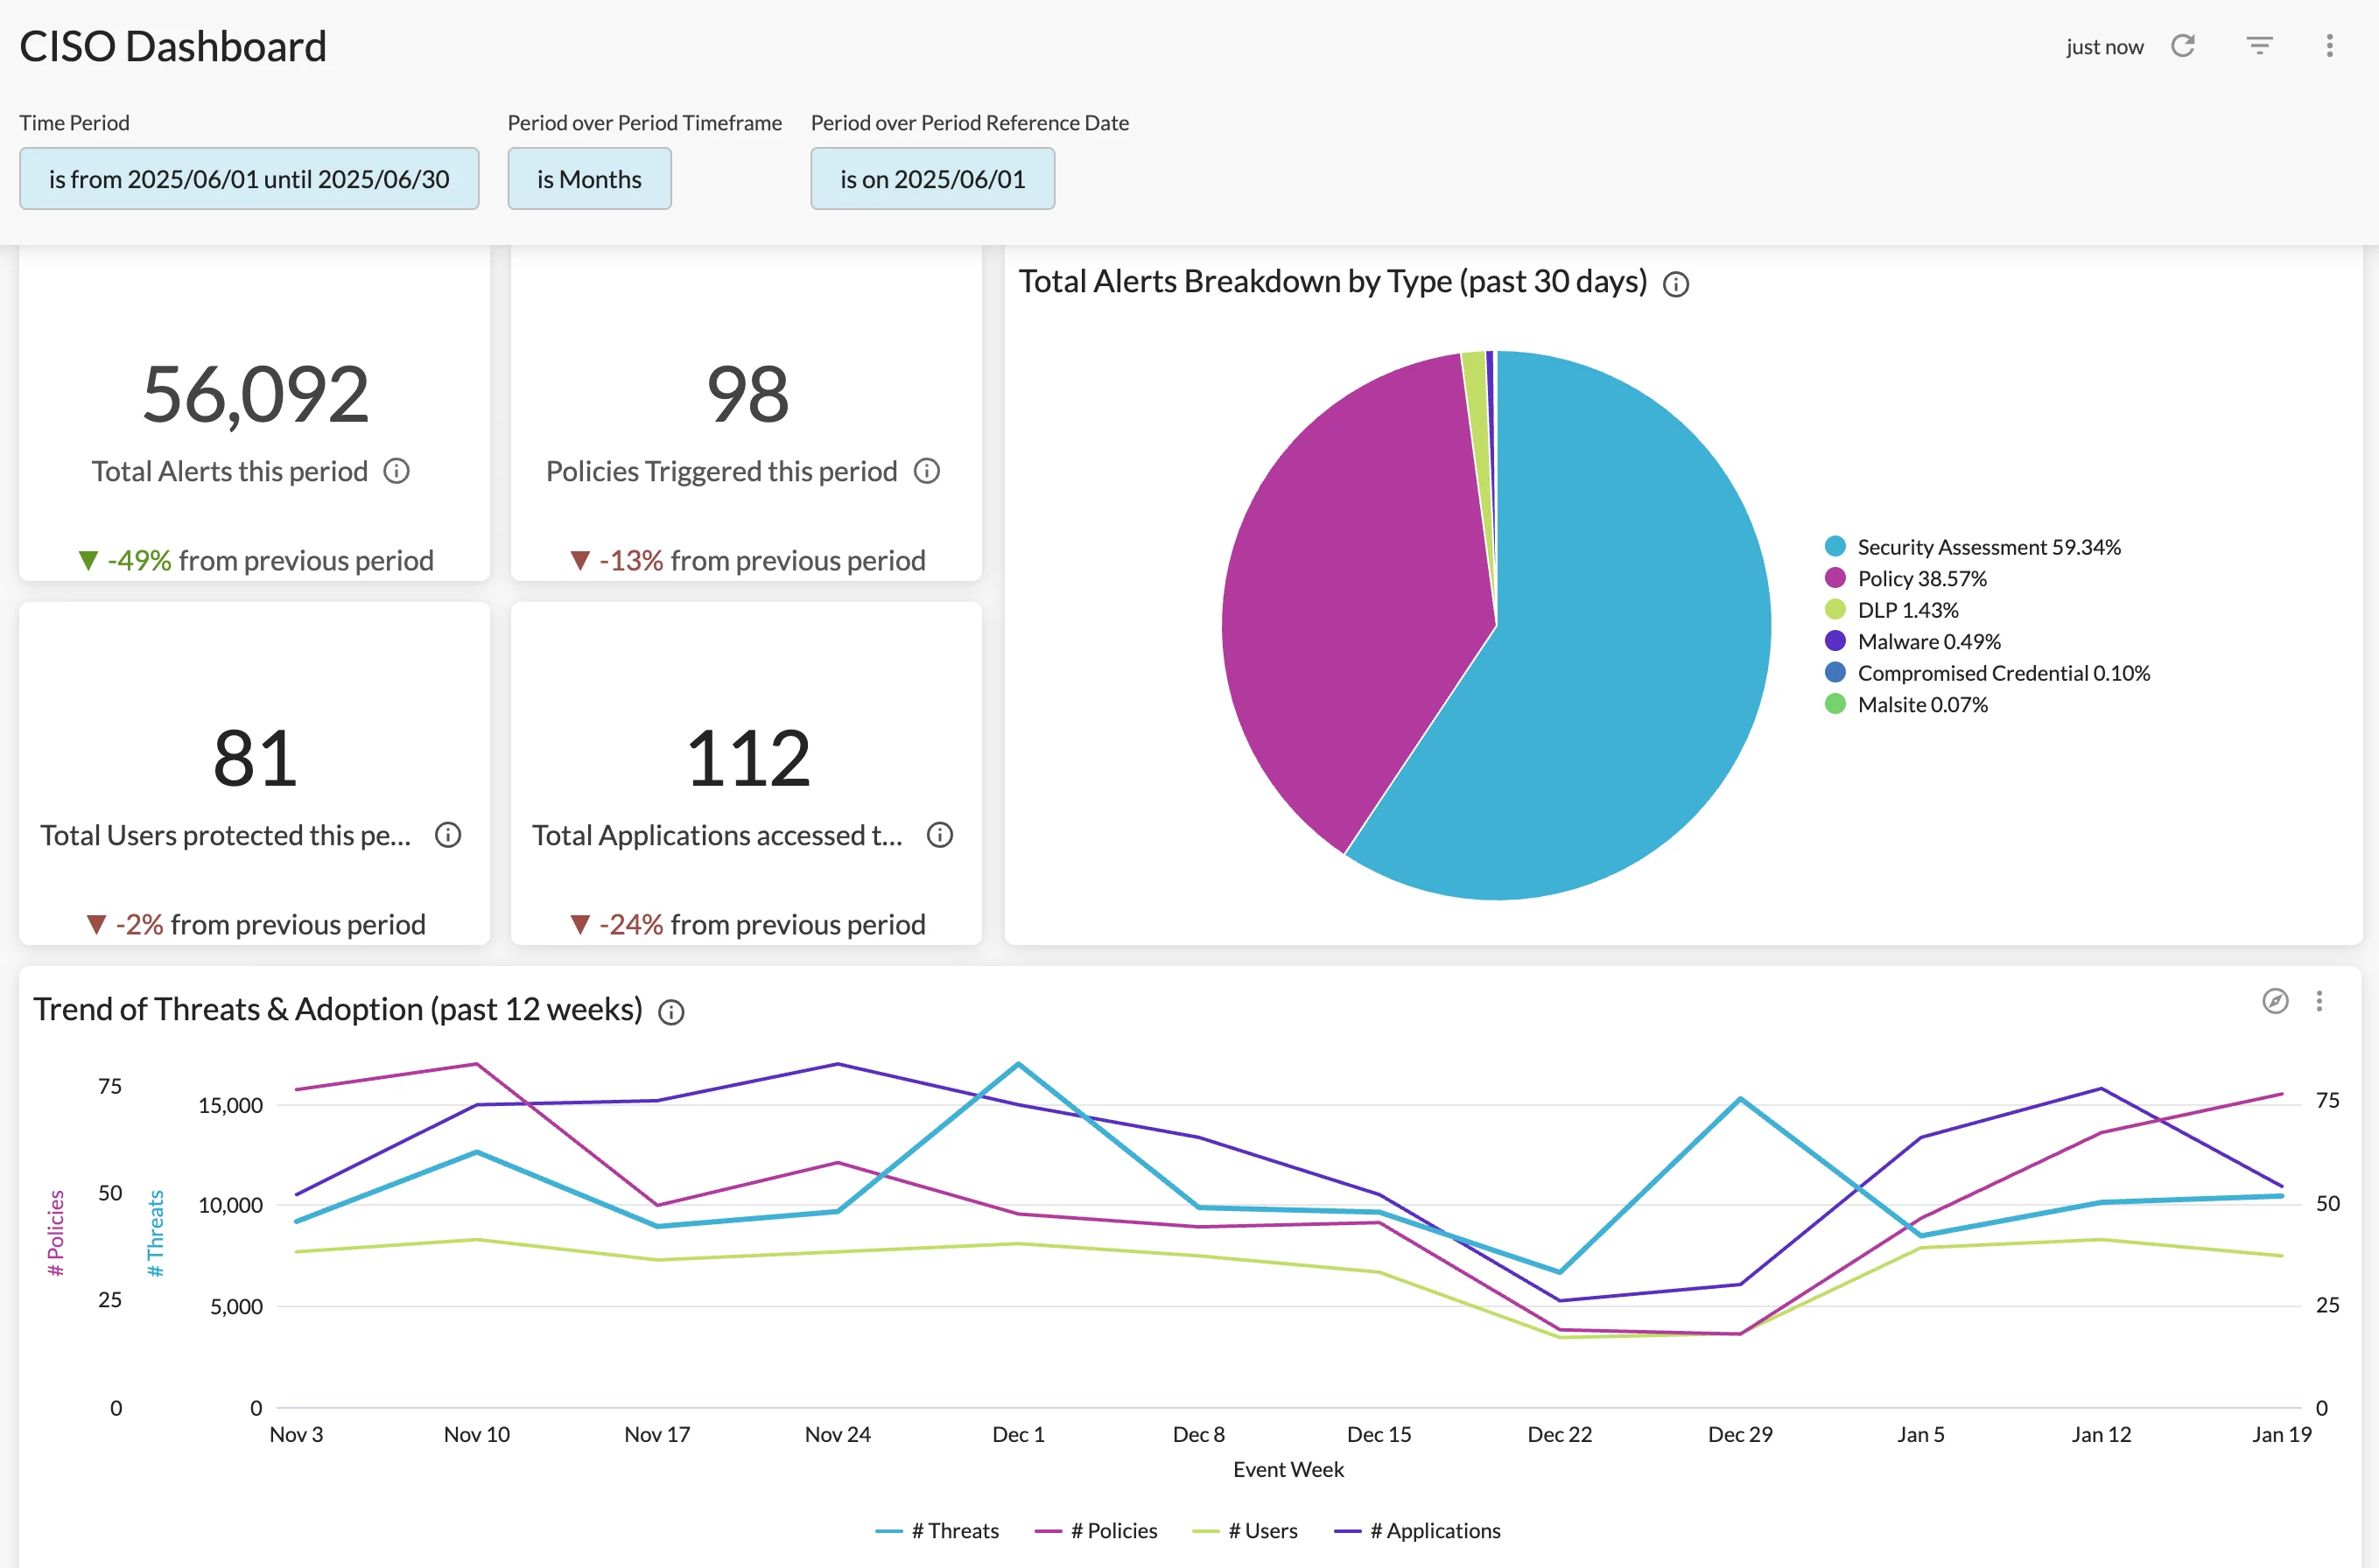
A: We recommend starting with the CISO Dashboard in Netskope Library. This dashboard provides high-level visibility into security concerns in your environment, including overall policy violations, threat alerts, DLP alerts, blocked traffic, & risky app usage. The period-over-period comparison allows you to easily monitor how the alert data is changing week over week.
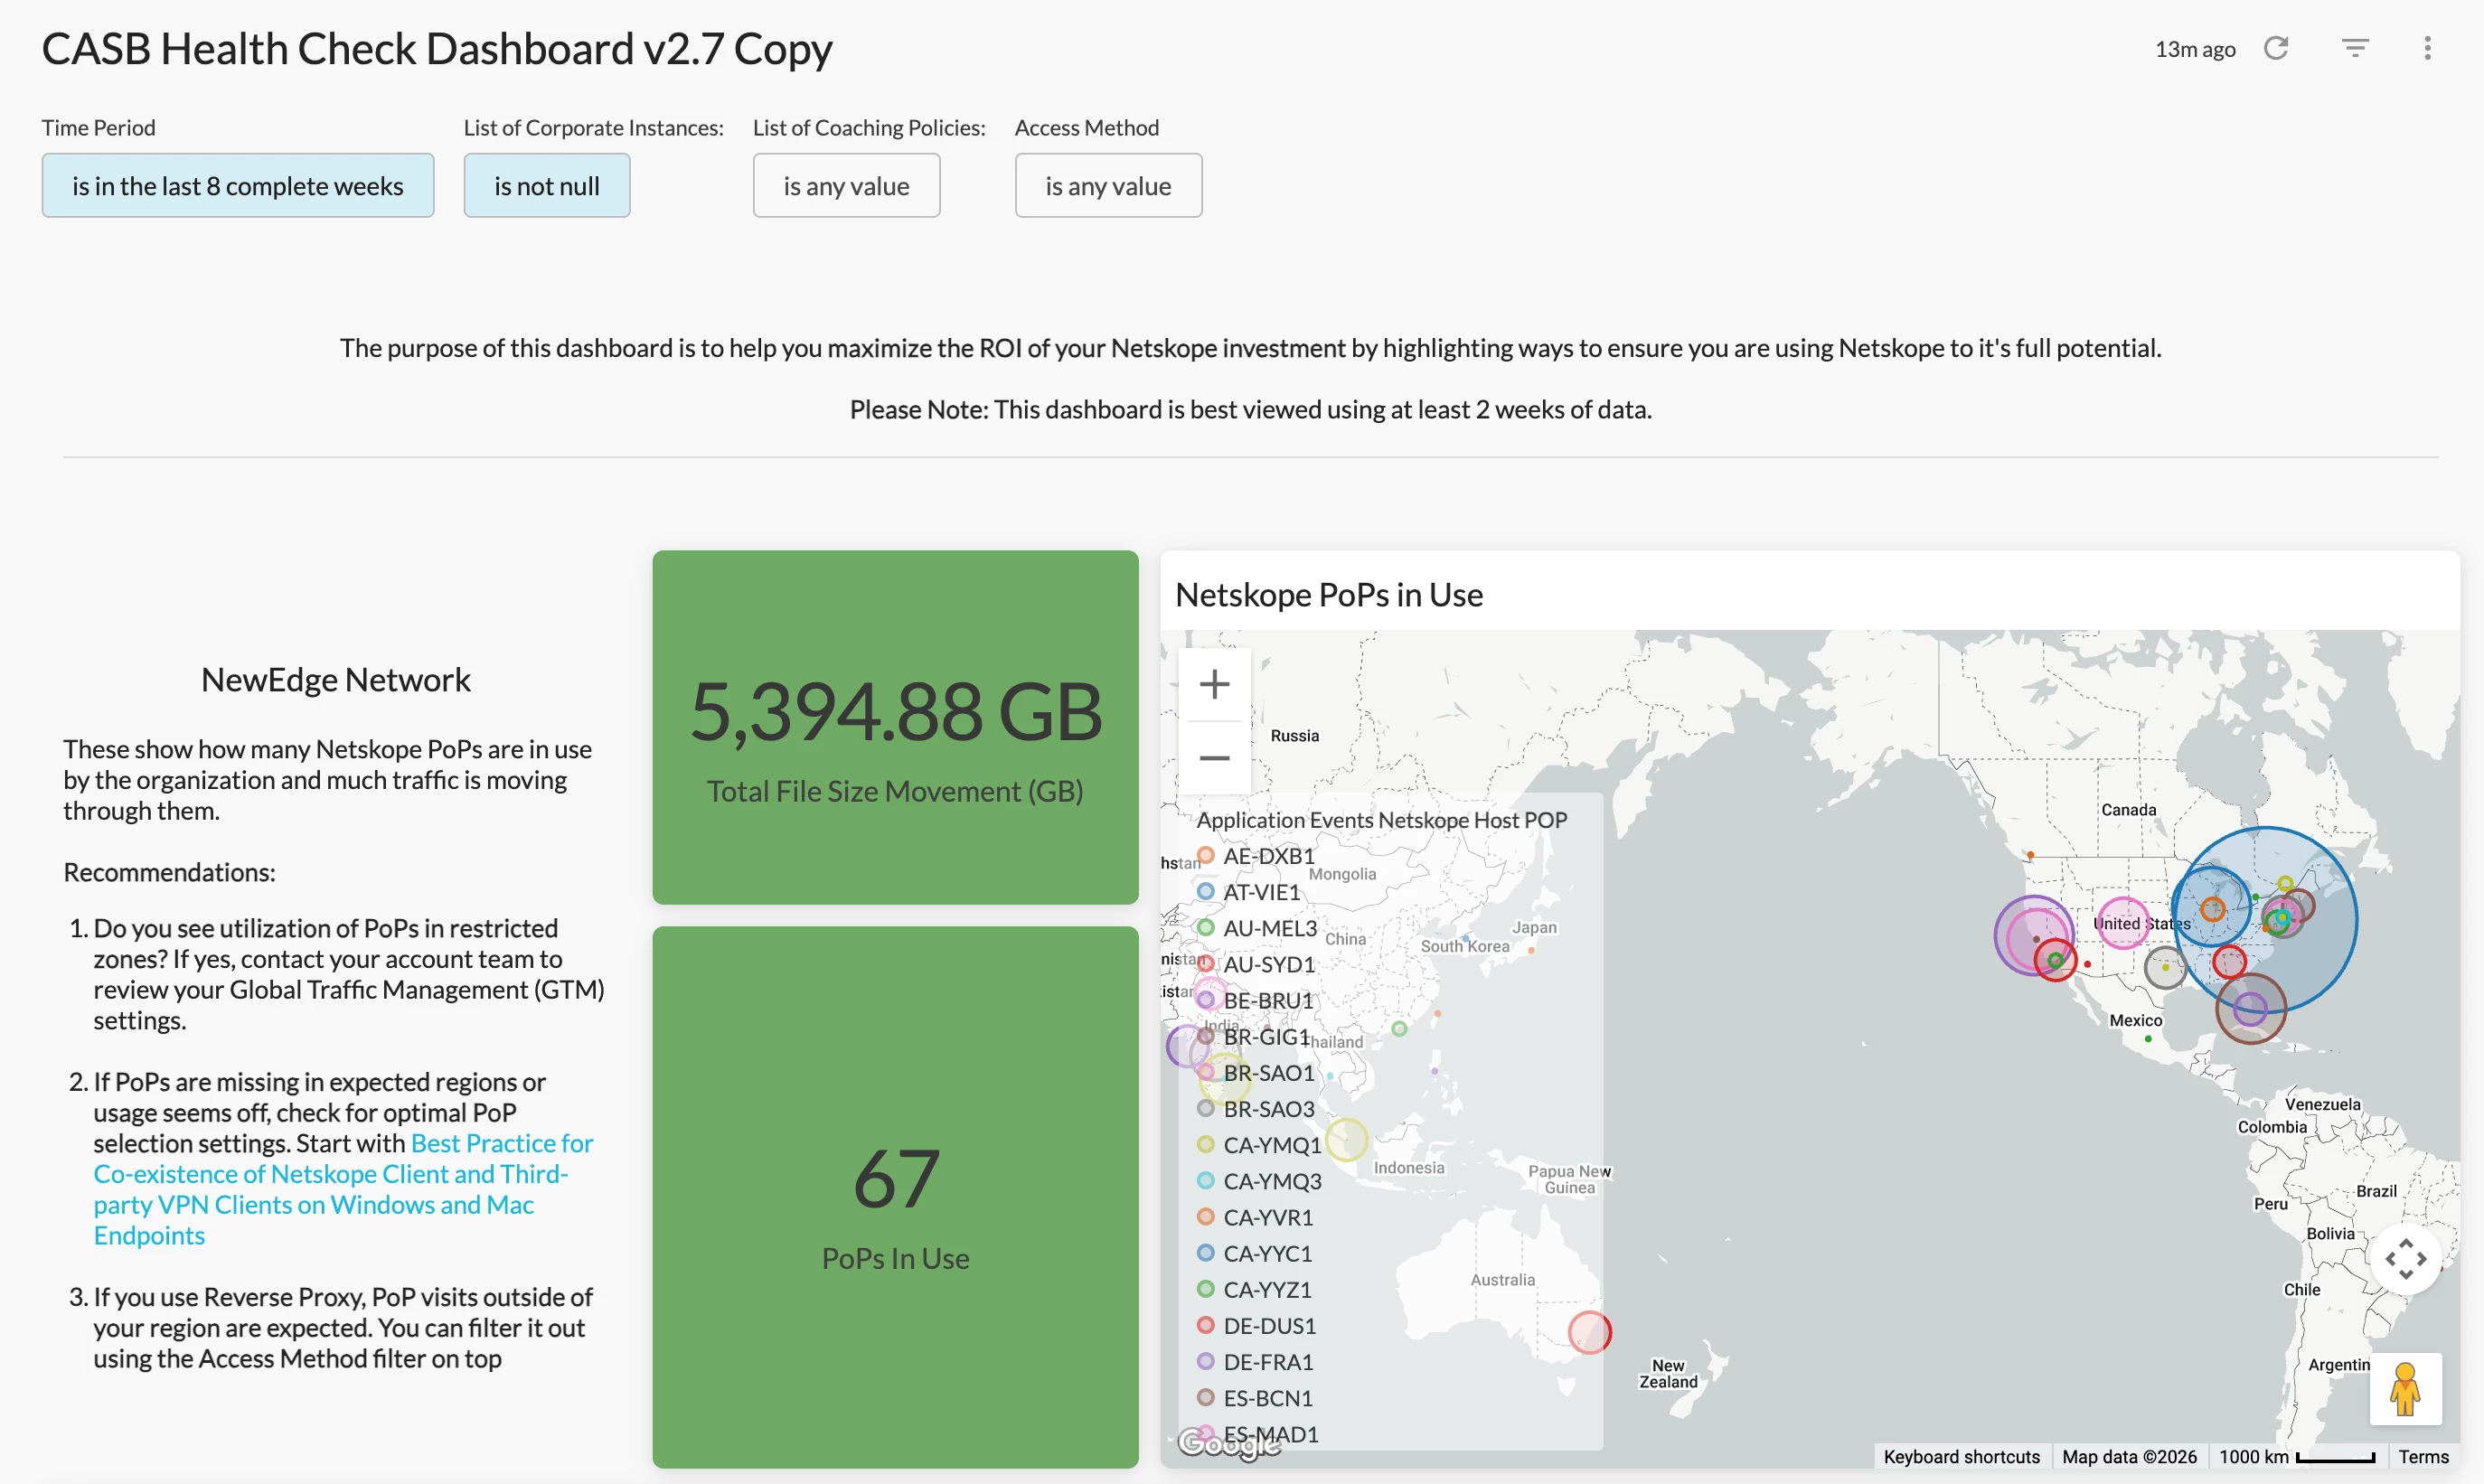
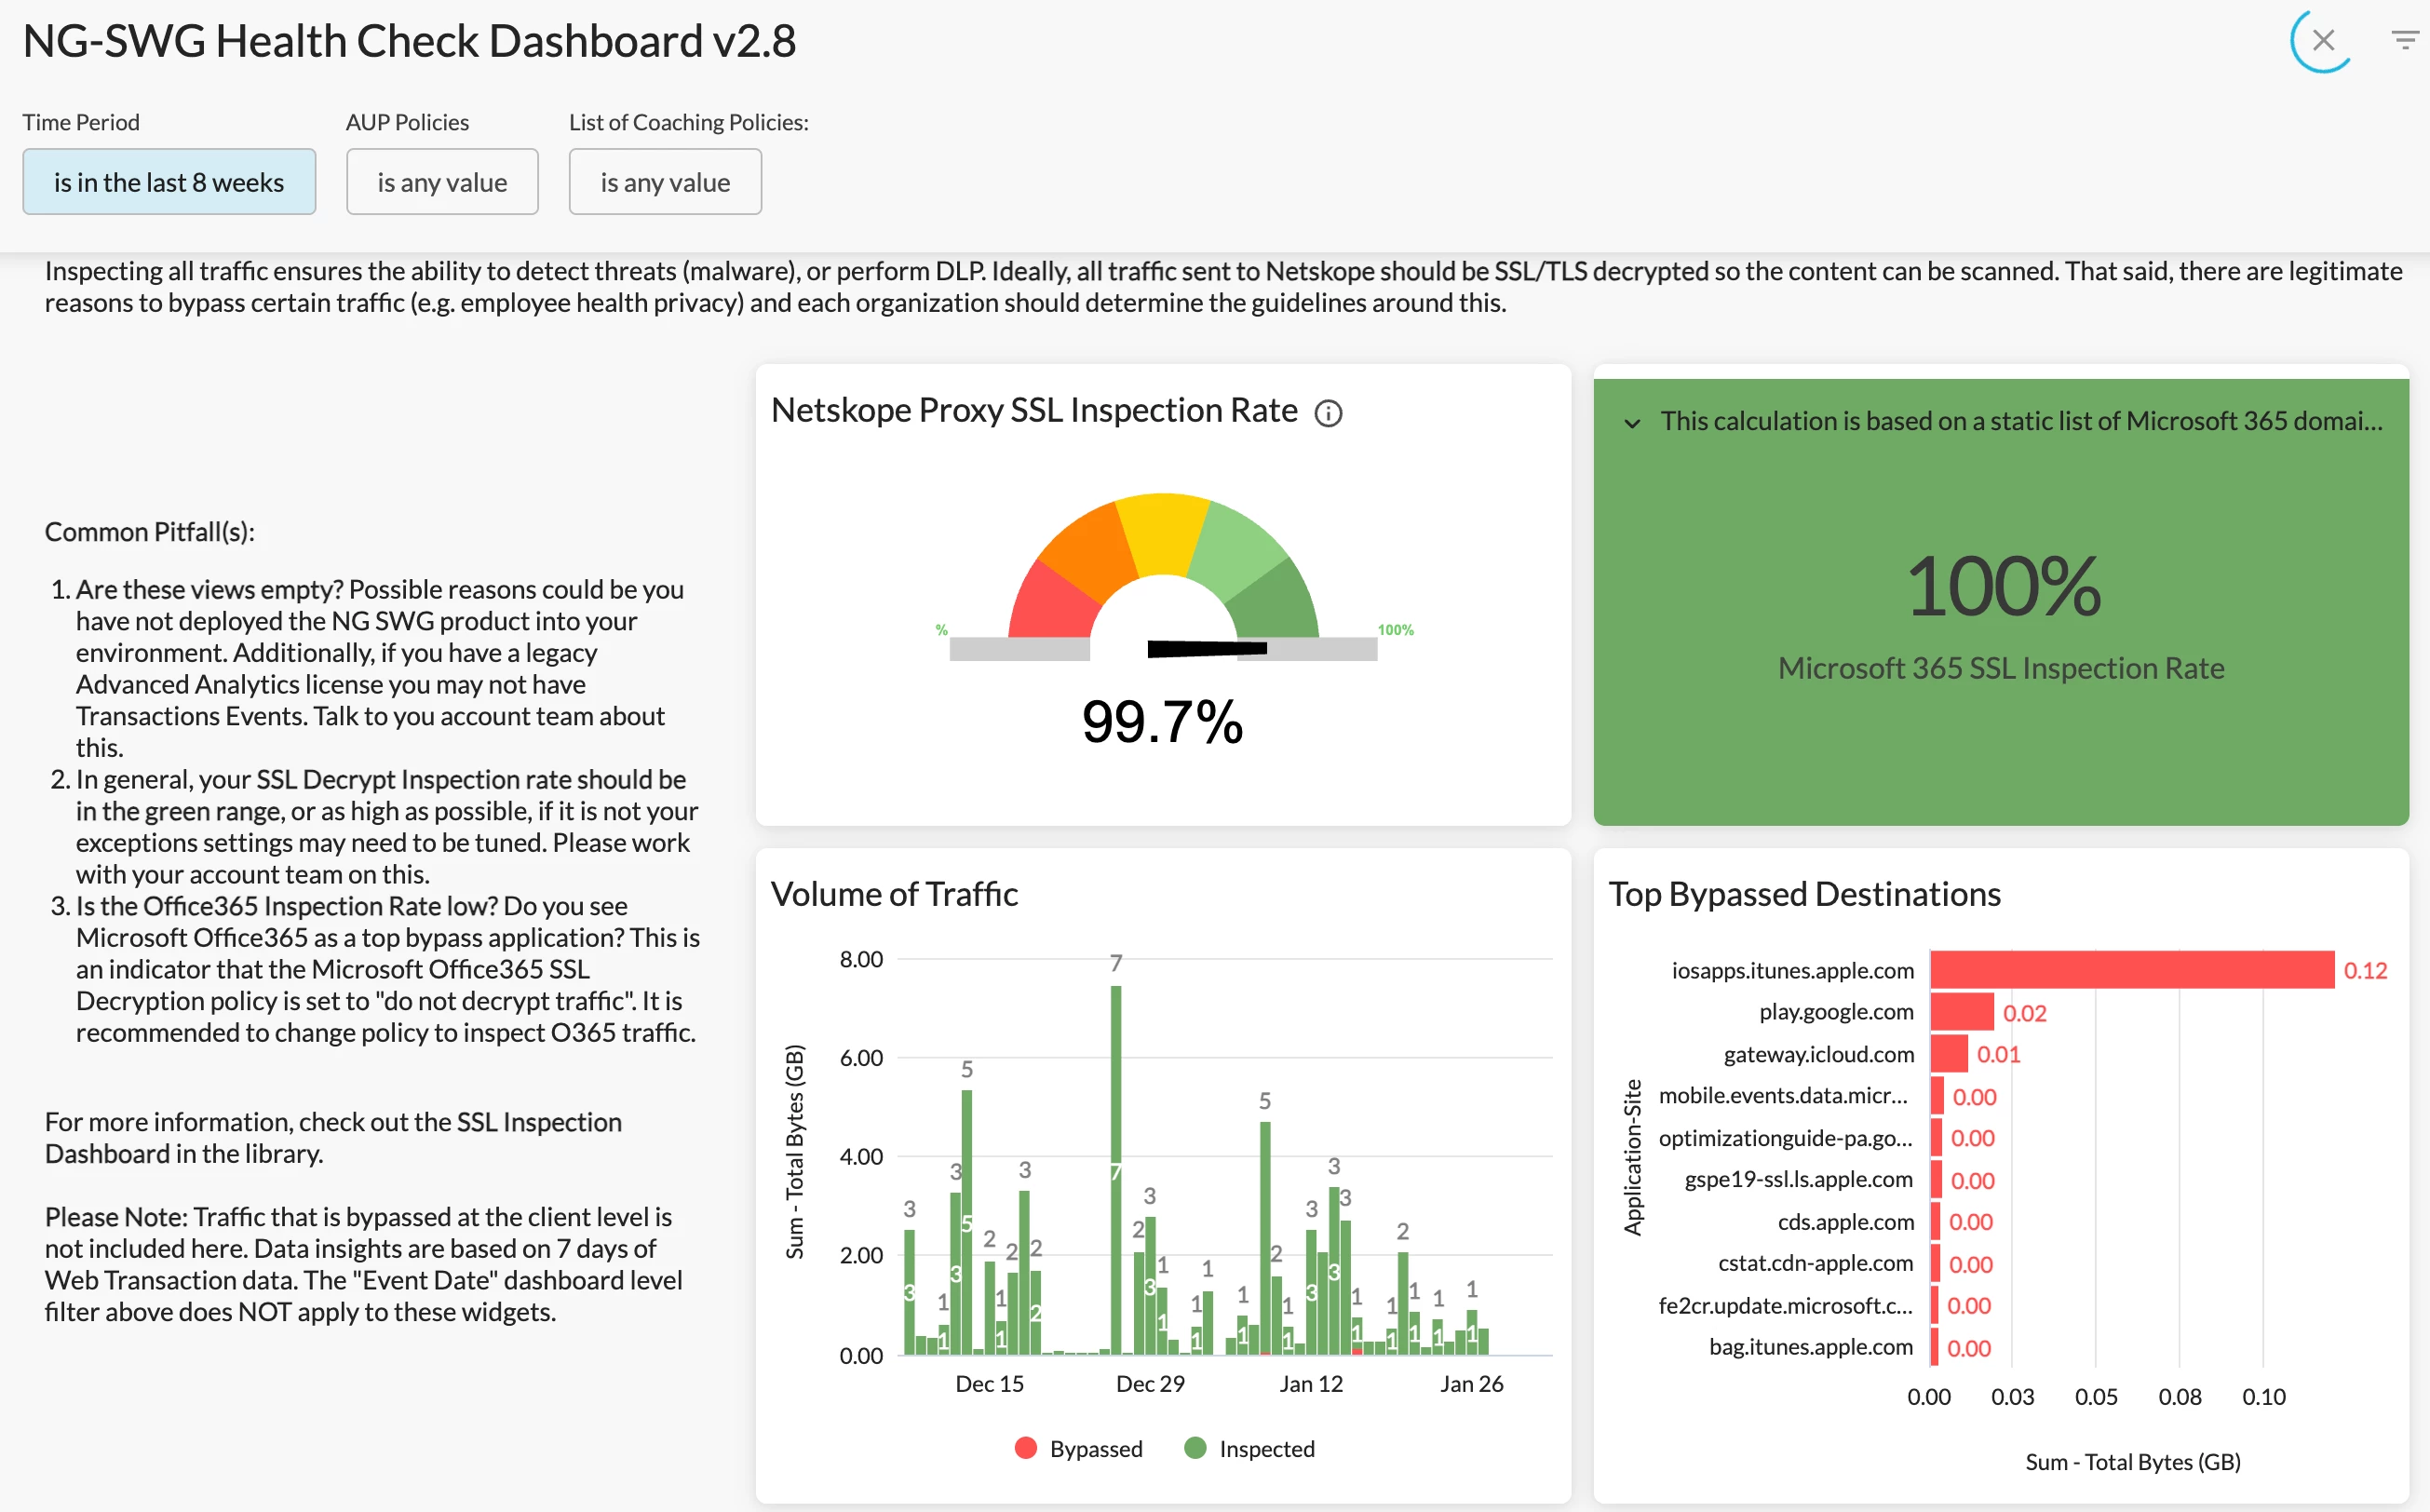
If you need comprehensive visibility into various security metrics in your environment, our famous “health check” dashboards will be great options. There are 3 different versions of “health check” dashboards in our community.
With a focus on Netskope CASB, this dashboard covers multiple topics such as NewEdge Network, Traffic Steering, SSL Inspection, Application Risk Management, Malware Protection, and DLP, which allows you to easily identify and monitor emerging risks in your environment. Recommendations / call to actions / best practices are provided in each section, which helps you better understand how to address the risks identified & enhance your security posture correspondingly.
This dashboard shares the same purpose and use cases with the CASB Health Check Dashboard above, but focuses on Netskope NG-SWG.
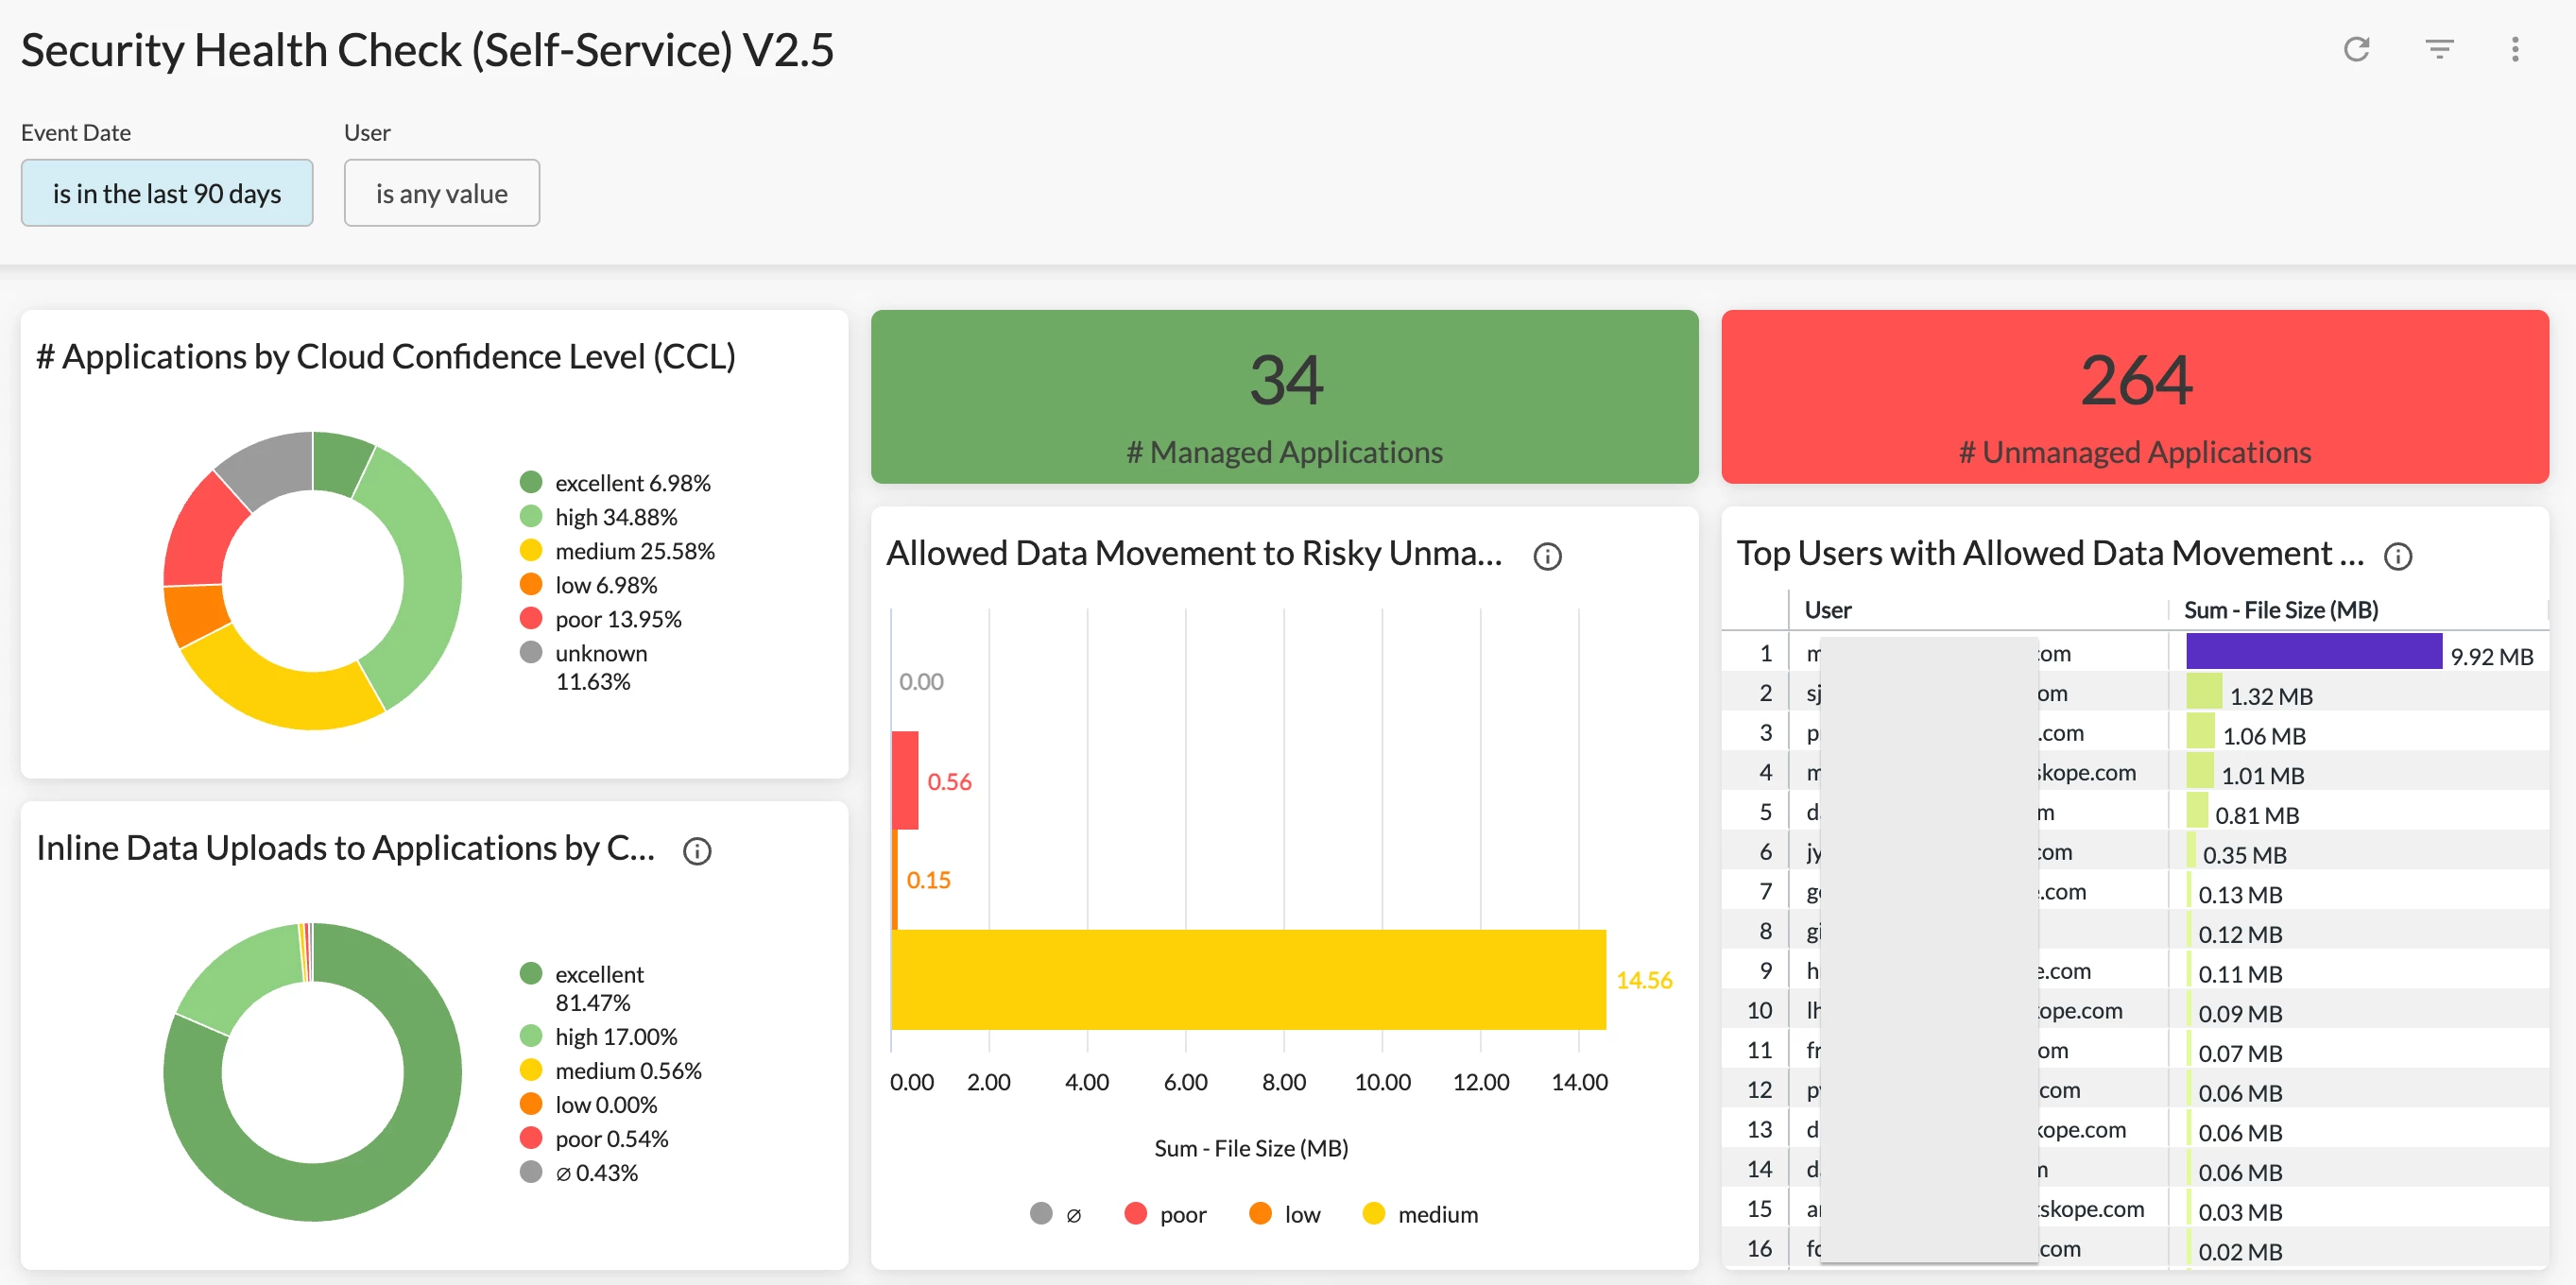
Security Health Check (Self-Service) Dashboard
This is an all-in-one dashboard that allows you to perform self-service health checks and to identify security concerns/issues in your environment. The dashboard answers 2 questions: 1) How Netskope is protecting your environment; 2) What Netskope is protecting your environment from. Compared to the previous CASB and NG-SWG Health Check Dashboards that focus on monitoring risks, this dashboard focuses on quickly locating and sourcing the security concerns/issues in your environment with detailed user investigation insights.
Resources Shared in the Session
Netskope Community - Advanced Analytics
CASB Health Check Dashboard V2.7
NG-SWG Health Check Dashboard V2.8
Security Health Check (Self-Service) Dashboard V2
Endpoint DLP Monitoring Dashboard
User/Organization Unit Investigation Dashboard
Application Risk Management Dashboard
Application Instance Overview Dashboard - Instance Tags
Enterprise Browser Usage Monitoring Dashboard
Enterprise Browser Usage Monitoring - Risk & Control


