Security Health Check (Self-Service) Dashboard V2.5 Update
Added user-centric widgets for user investigation use cases.
Looking to quickly pinpoint the security concerns in your environment? Take a look into our Security Health Check (Self-Service) Dashboard!
This is a one-stop dashboard which allows you to perform self-service health checks and to locate security concerns/gaps in your environment. The dashboard is expanded from 2 dimensions: 1) How Netskope is protecting your environment; 2) What Netskope is protecting your environment from.
The dashboard covers 9 major topics, which helps you identify & investigate:
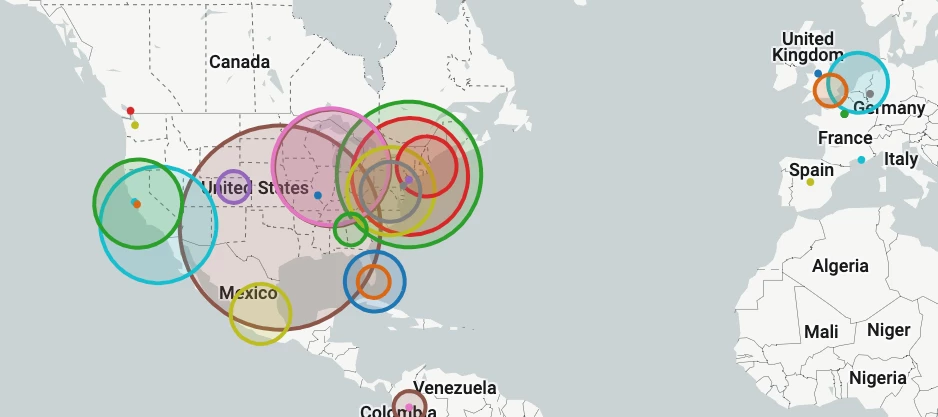
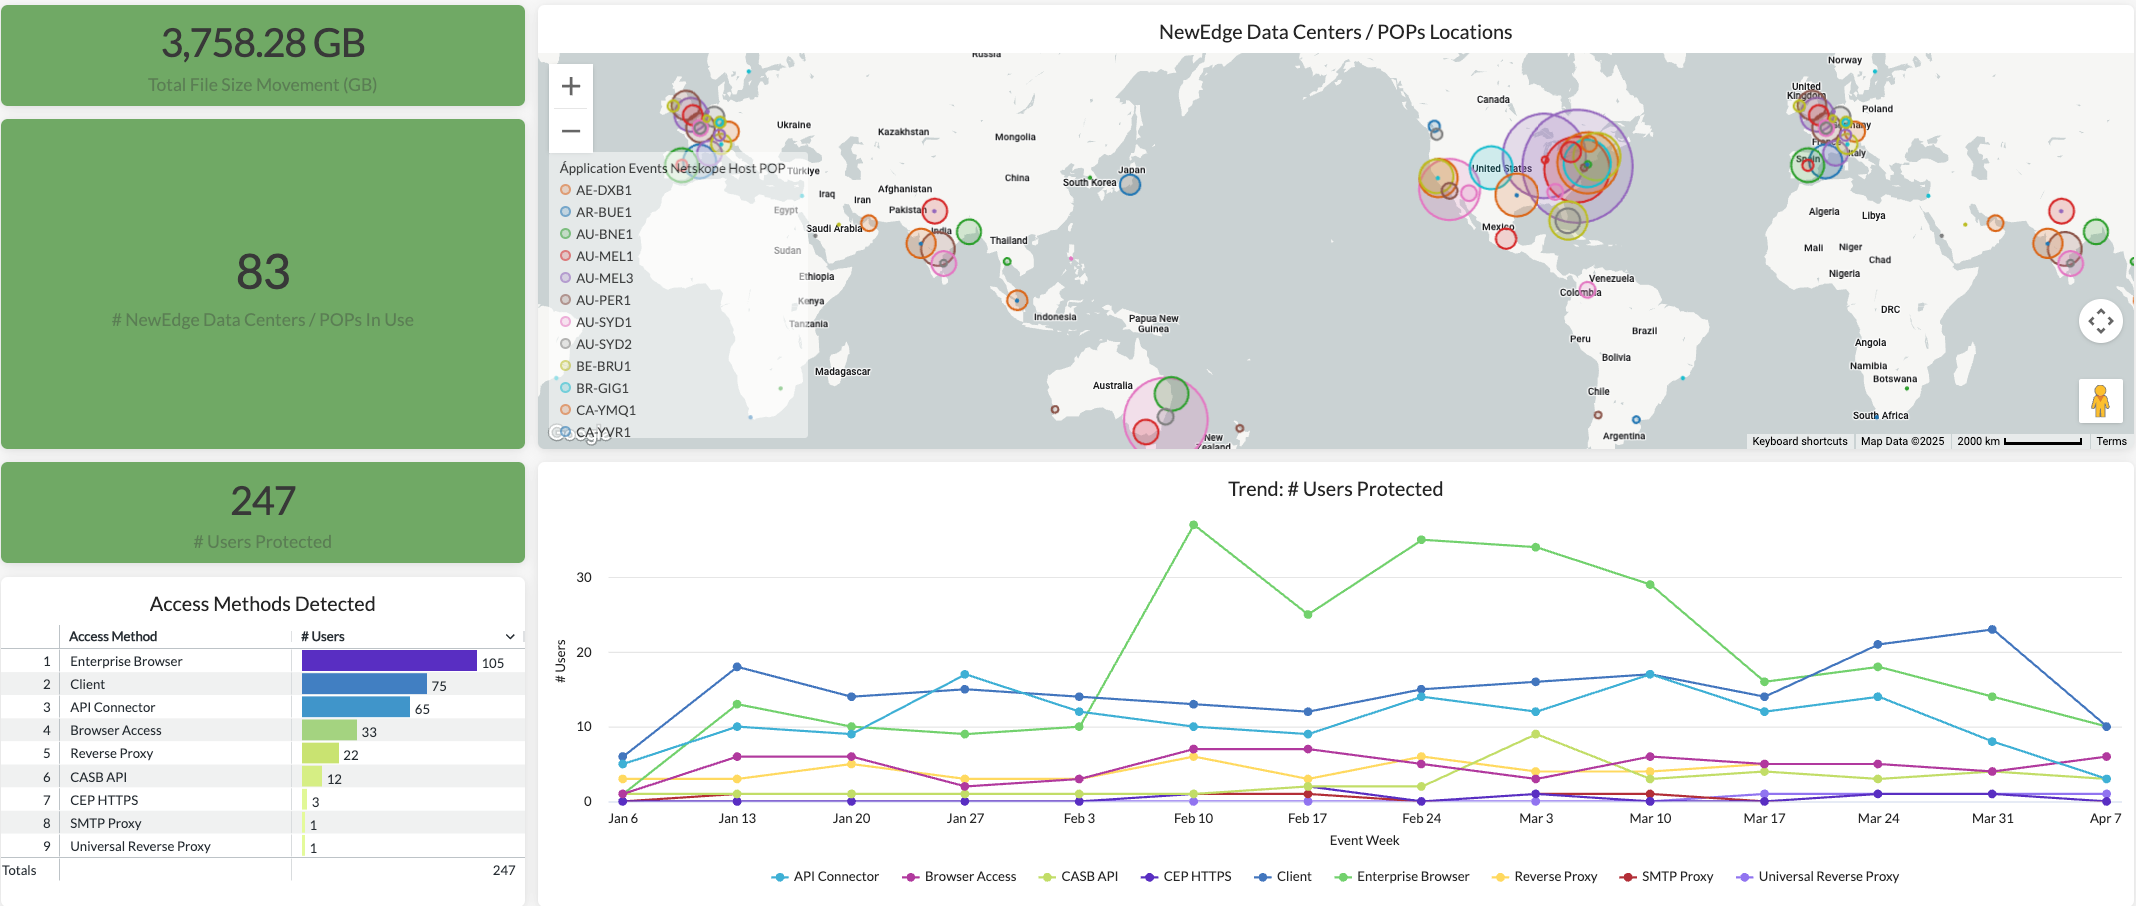
NewEdge Network & Traffic Steering
POP utilization in restricted regions
Unexpected access methods
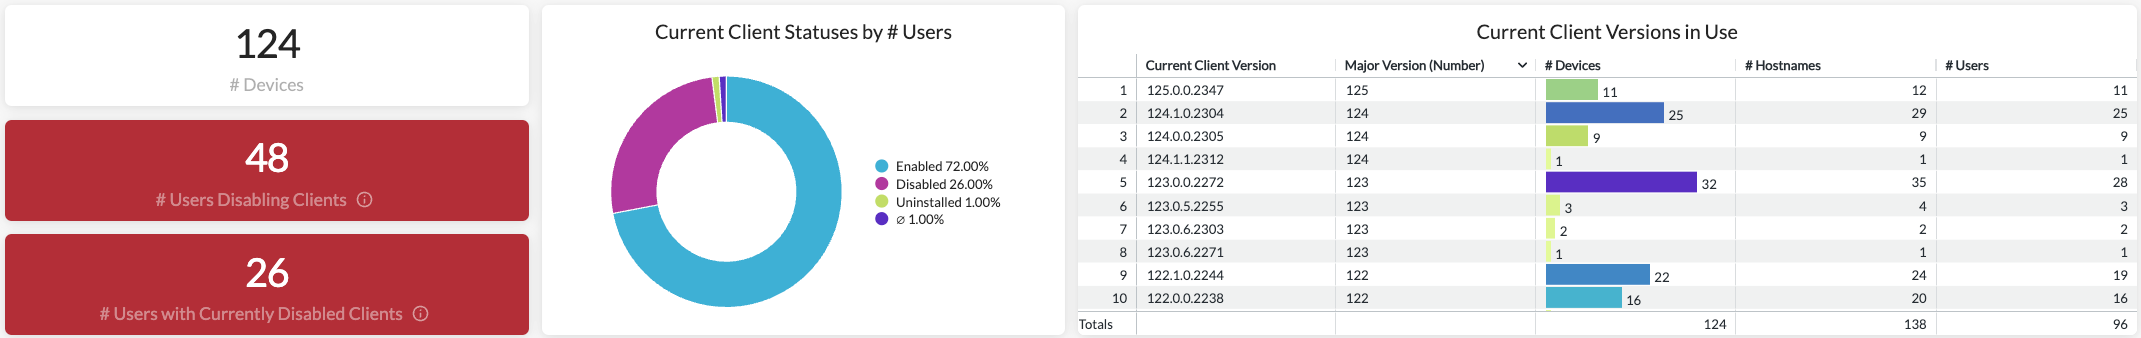
Device & Client Management
Users disabling Netskope Client
Old/unsupported Client versions being used
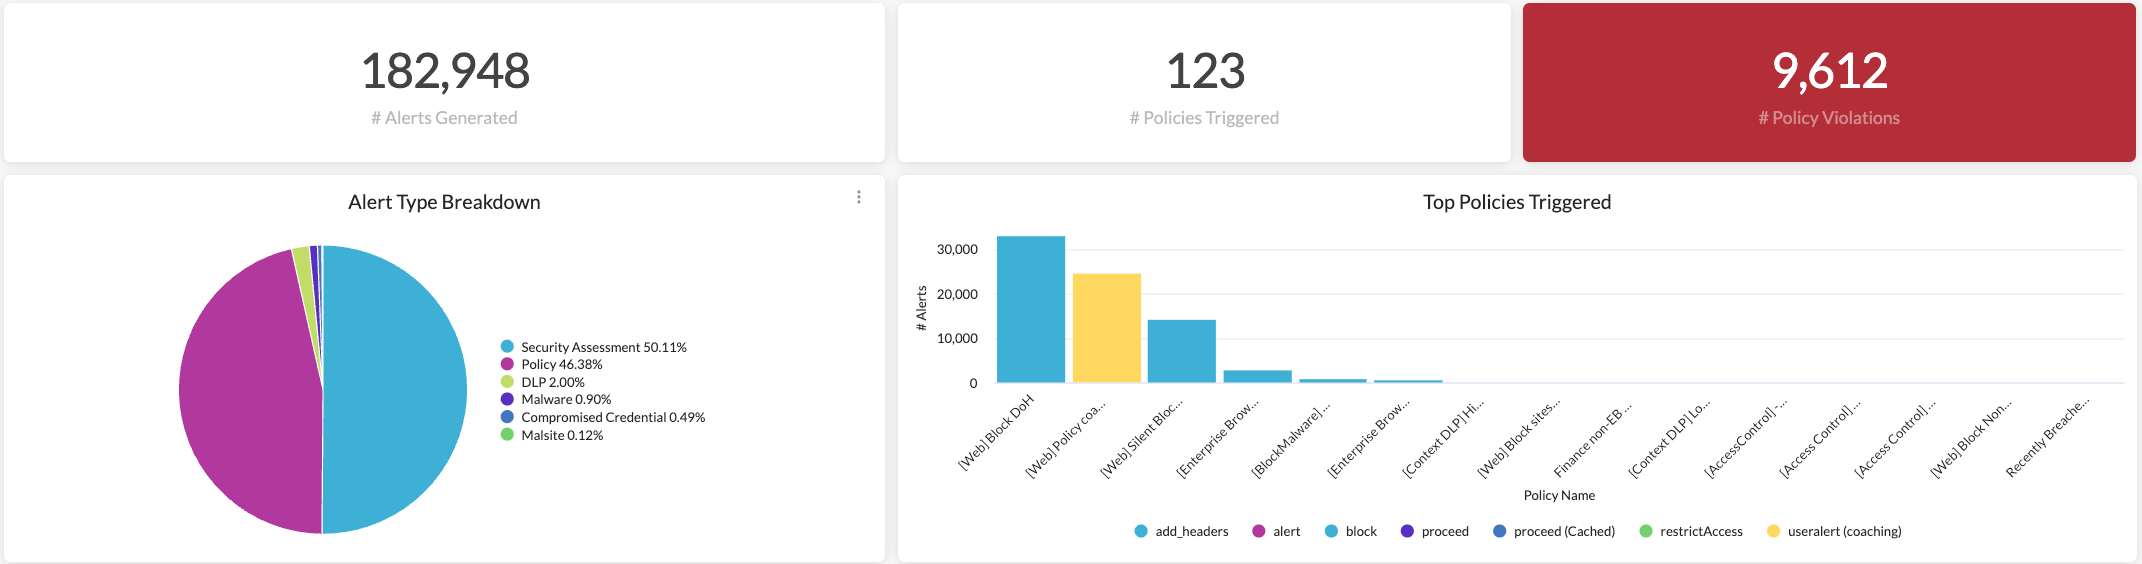
Alerts & Policies
Alerts, alert types, policies triggered
Top users triggering alerts (and the corresponding activities)
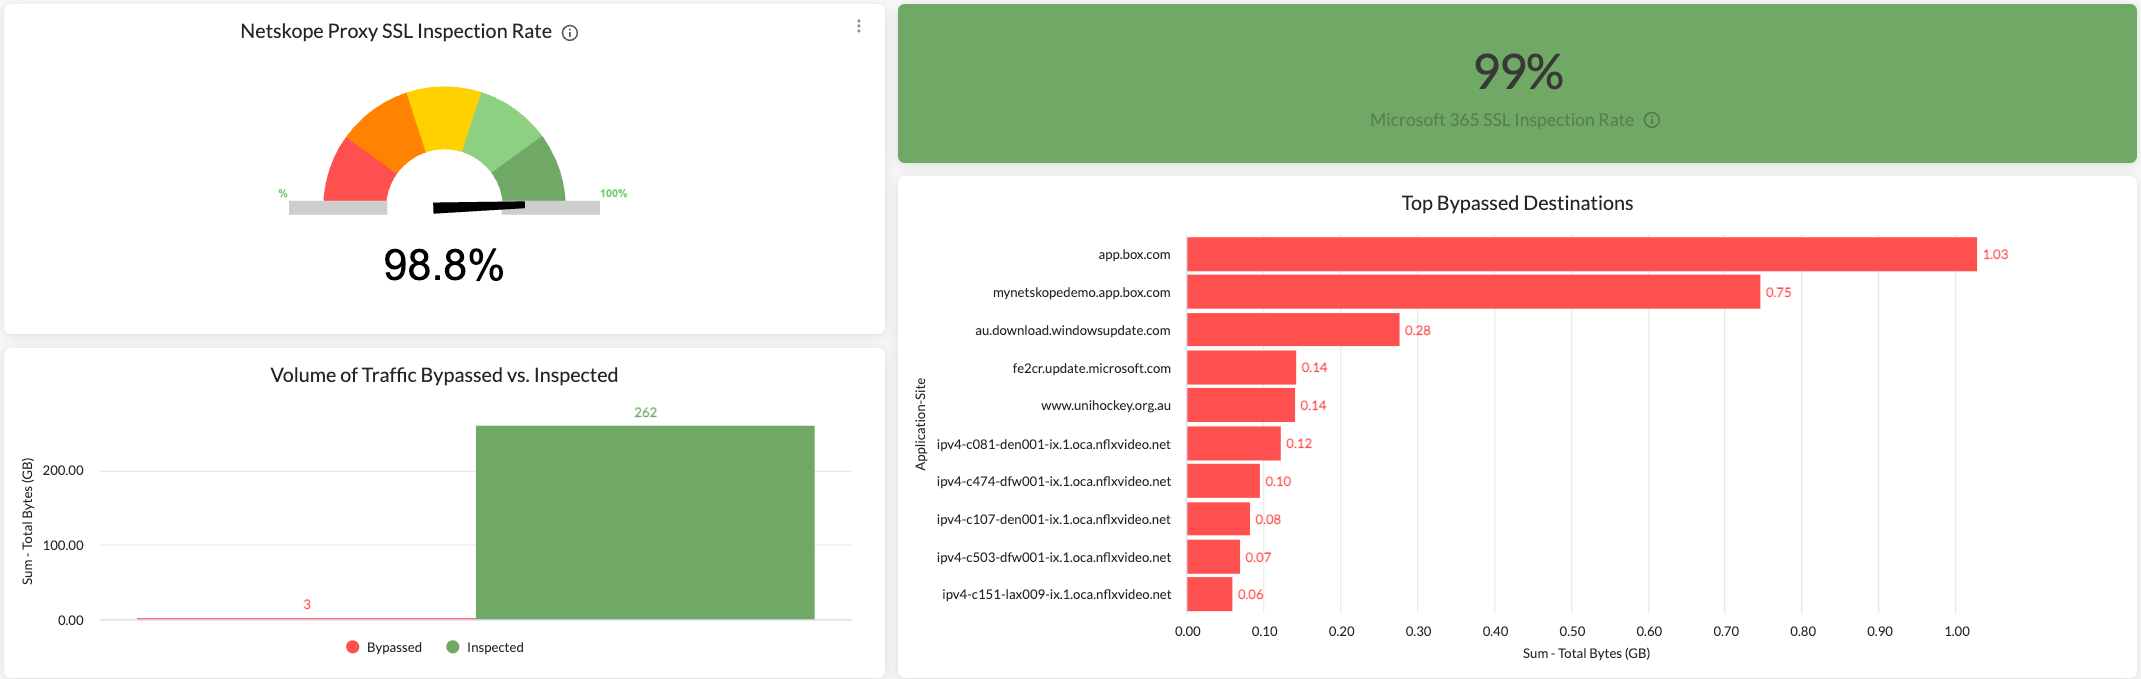
SSL/TLS Inspection
Low SSL inspection rate
Unexpected bypassed traffic
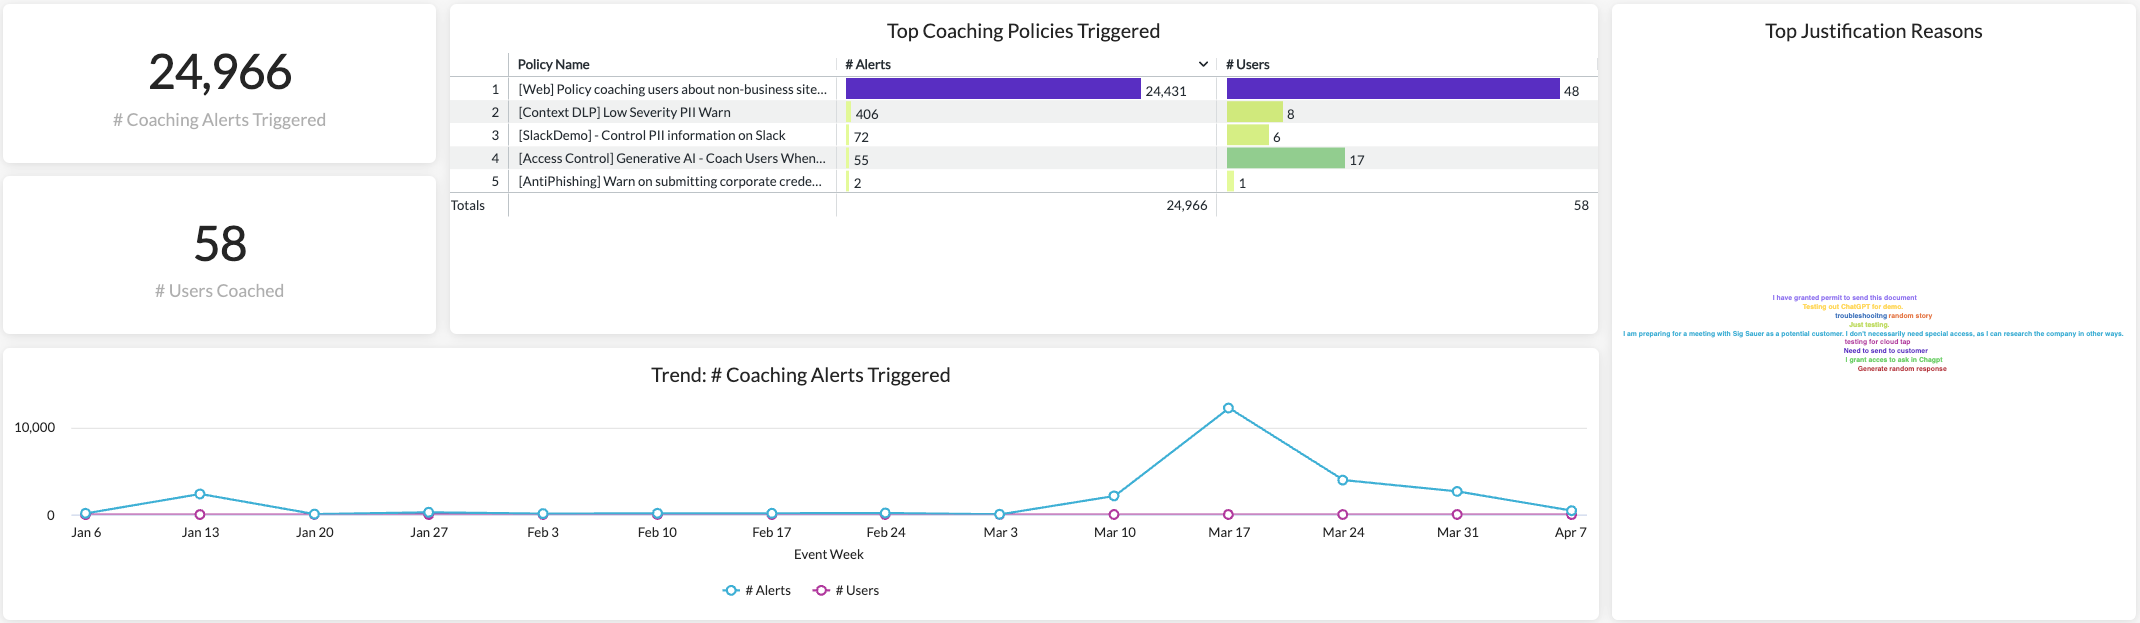
Coaching Policies
Incorrect/unexpected coaching policies detected
Justification reasons for unknown business needs
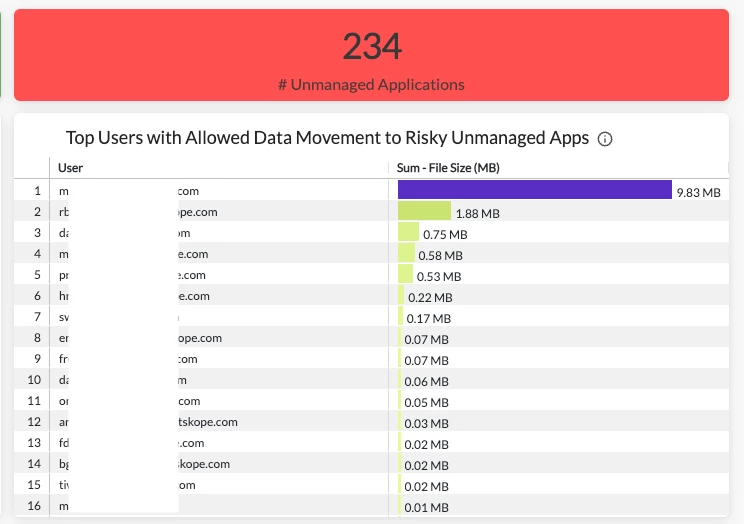
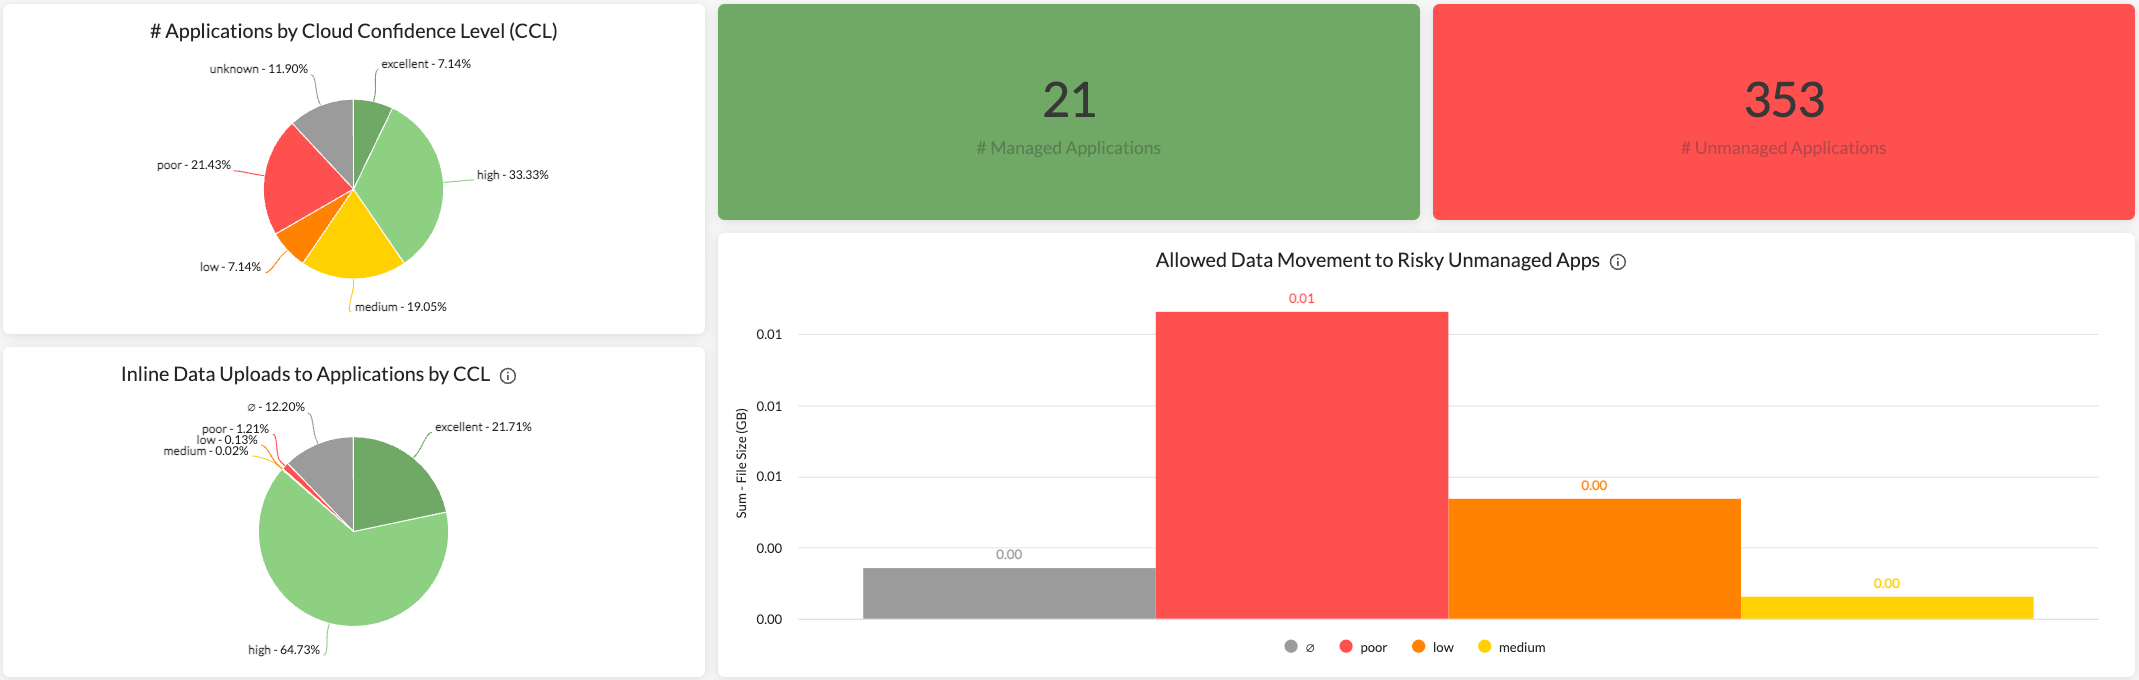
Application Risk Management
Risky & unmanaged apps being used
Allowed data movement to risky & unmanaged apps
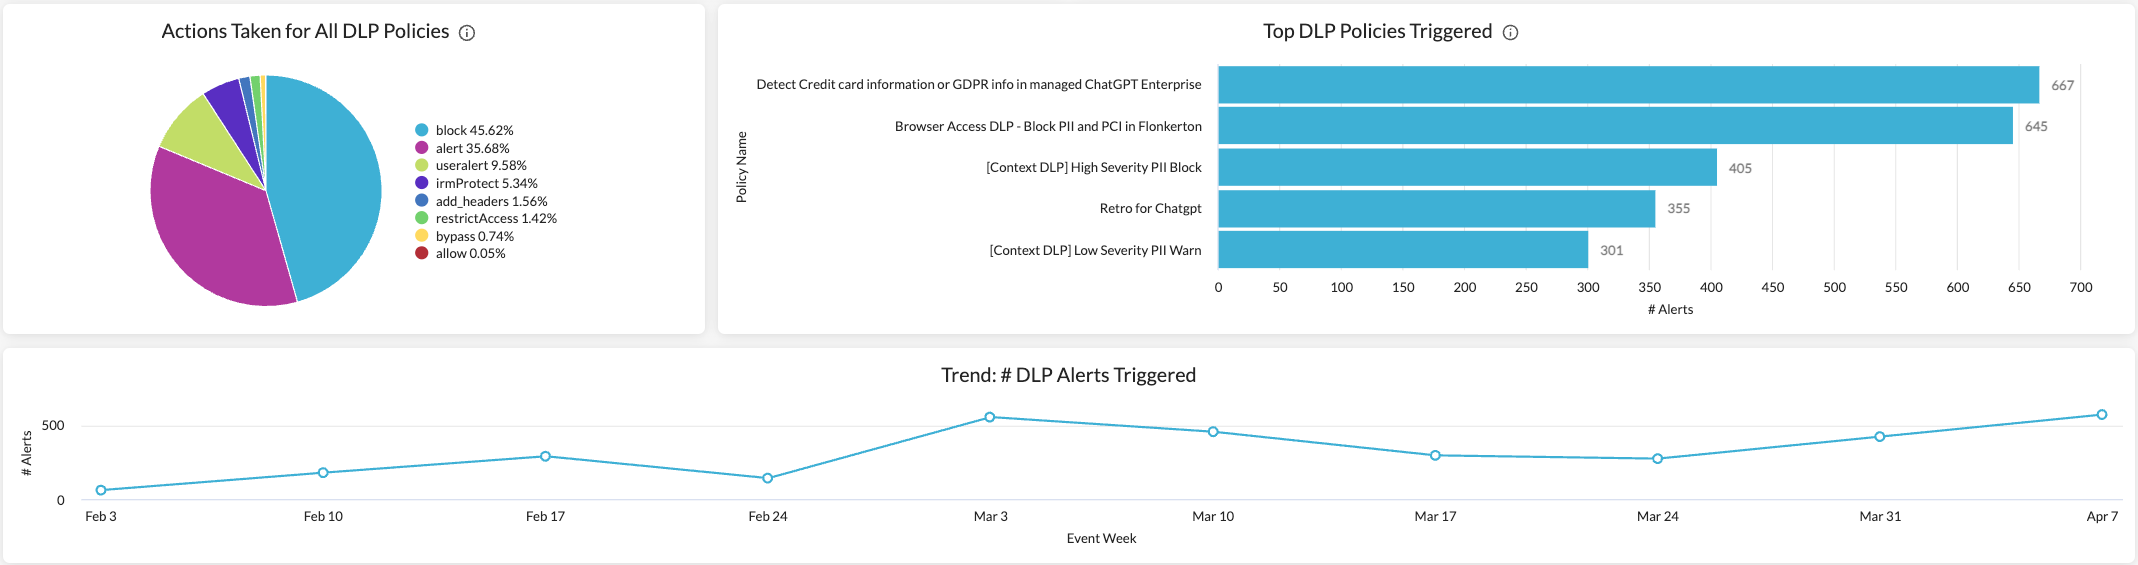
Data Loss Prevention (DLP)
DLP alerts & policies triggered
Inappropriate actions taken by DLP policies
Publicly exposed files with DLP violations
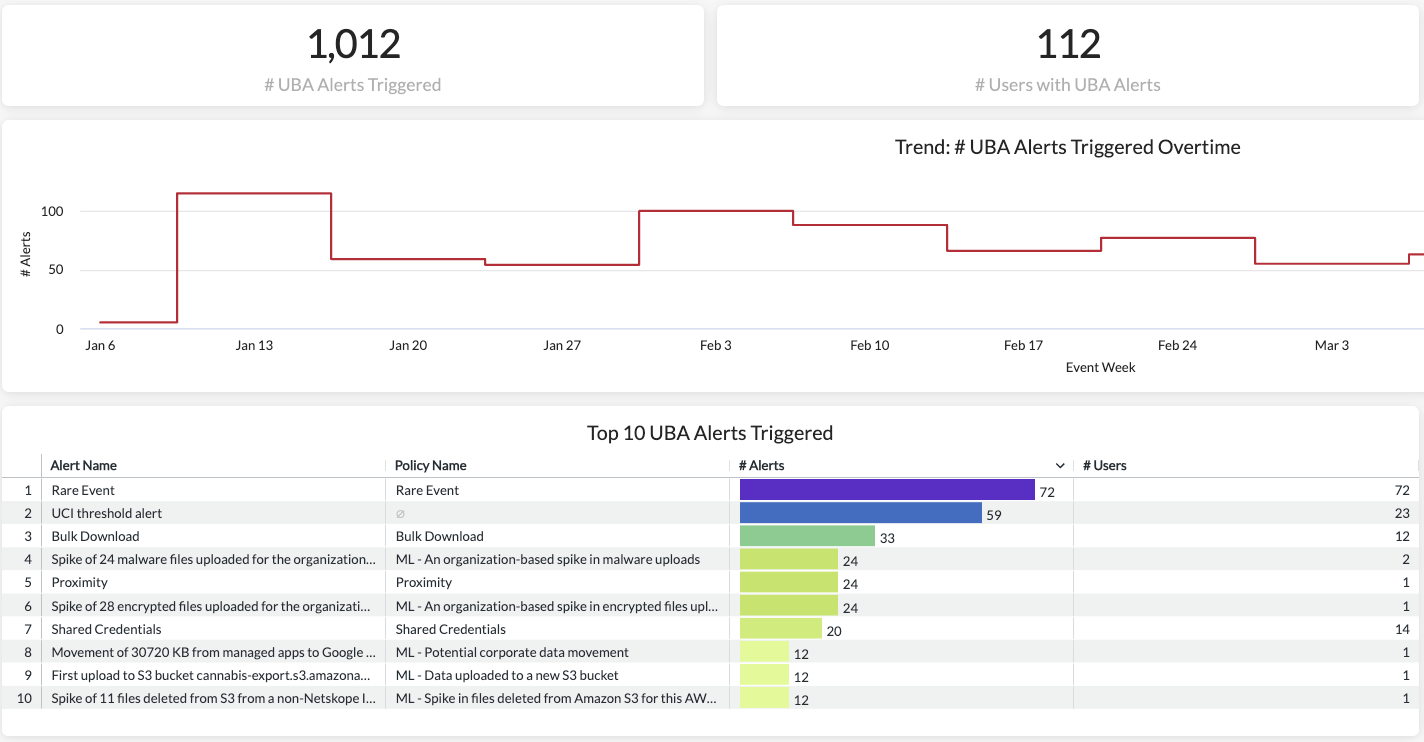
User Behavior Analytics (UBA)
UBA alerts & policies triggered
Top users triggering UBA alerts
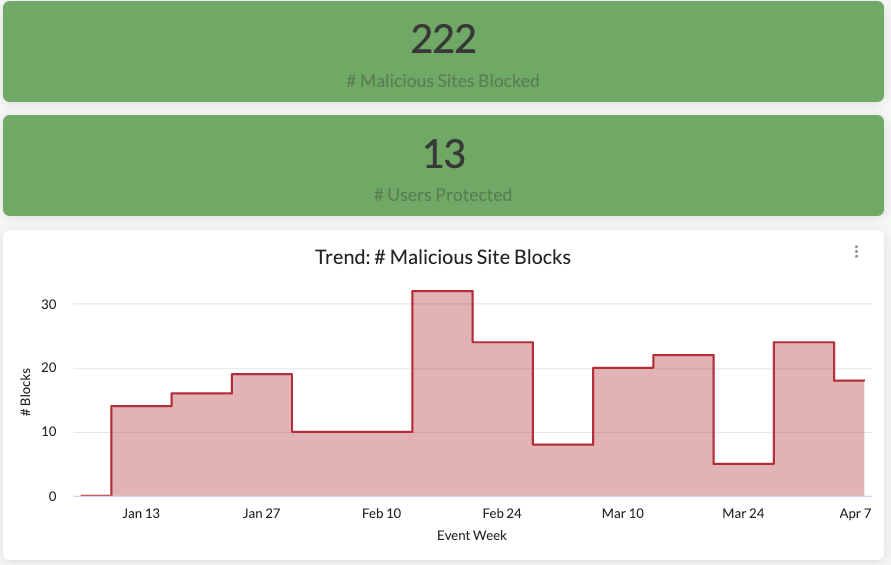
Threat Protection
Malware blocks
Allowed inline malware & impacted users
Policies allowing malware
Top web malware domains & cloud malware sources
Malicious site blocks
Allowed malicious sites & impacted users
Policies allowing malicious sites
Top malicious site domains & URL filtering categories
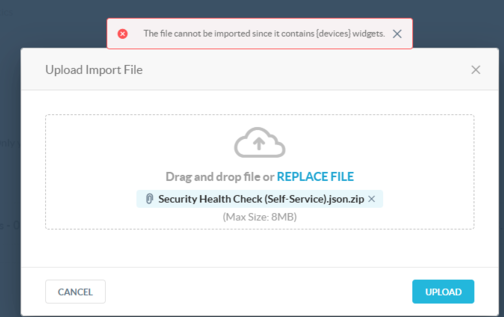
The dashboard is attached below. Feel free to import and view it in your own environment.
Found security concerns? Check out our CASB &NG-SWG Health Check Dashboards for recommendations and to-do.
This is awesome and will be very useful to dig into things … I like having everything all in one place (even if takes a while to load it all lol). Thanks!
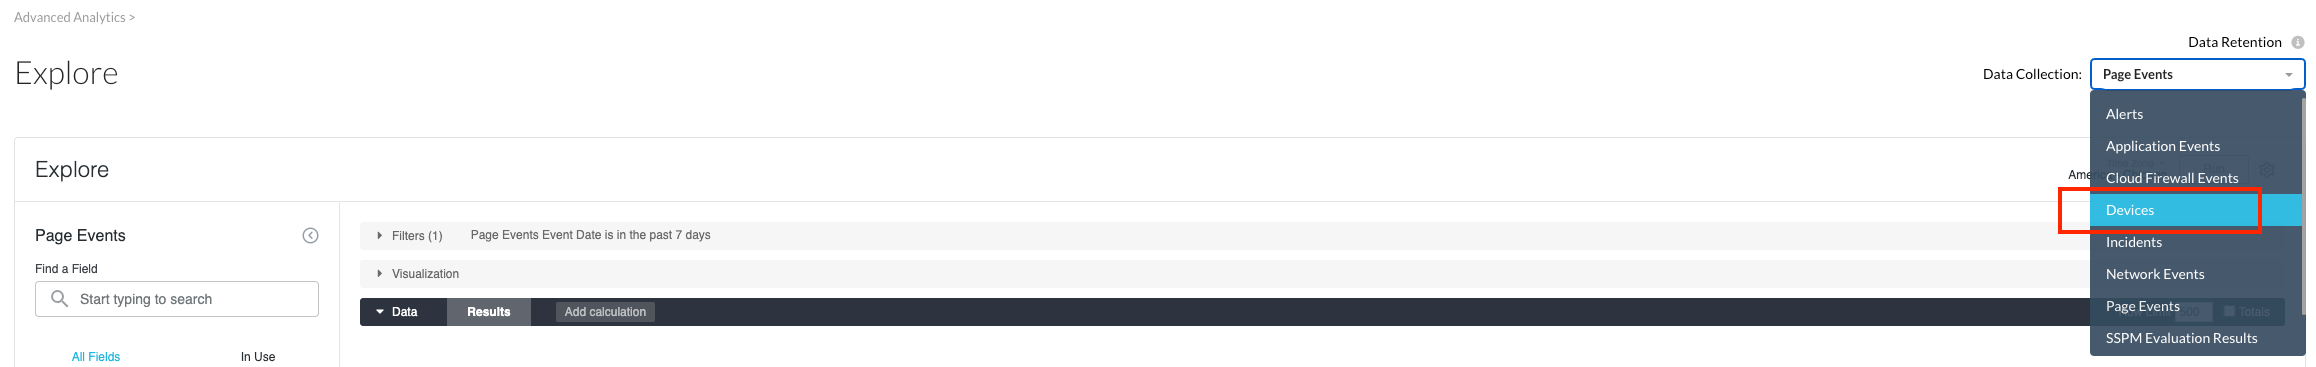
Hi @hjw ! This usually happens when the device data collection is not enabled for your tenant. To confirm this, you can expand the data collection list in the “Explore” page and see if “Device” shows up. Let me know if it’s not there and I can help you enable that.
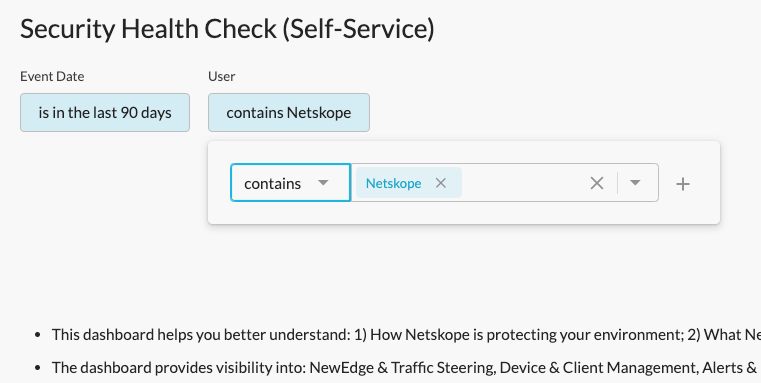
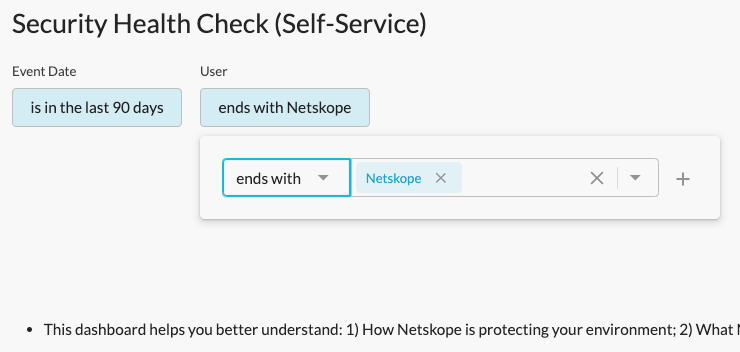
This dashboard shows an inaccurate count of Total users. We only have around 400 employees but showing over 3,000 Total users on this dashboard. Looking at the data its showing random users, like “ojqaymqsr_kuphl8mg9zta” and many non-employees (external to our domain).
The random user names are audit log data provided by the corresponding SaaS apps. To avoid this inaccurate/noisy data, you can set the “user” filter to “contains/ends with [your company domain].” This will filter out random and external user names in the dashboard.
The dashboard attached above has been updated with the “user” filter. Feel free to try it out and let us know if you have any other questions.
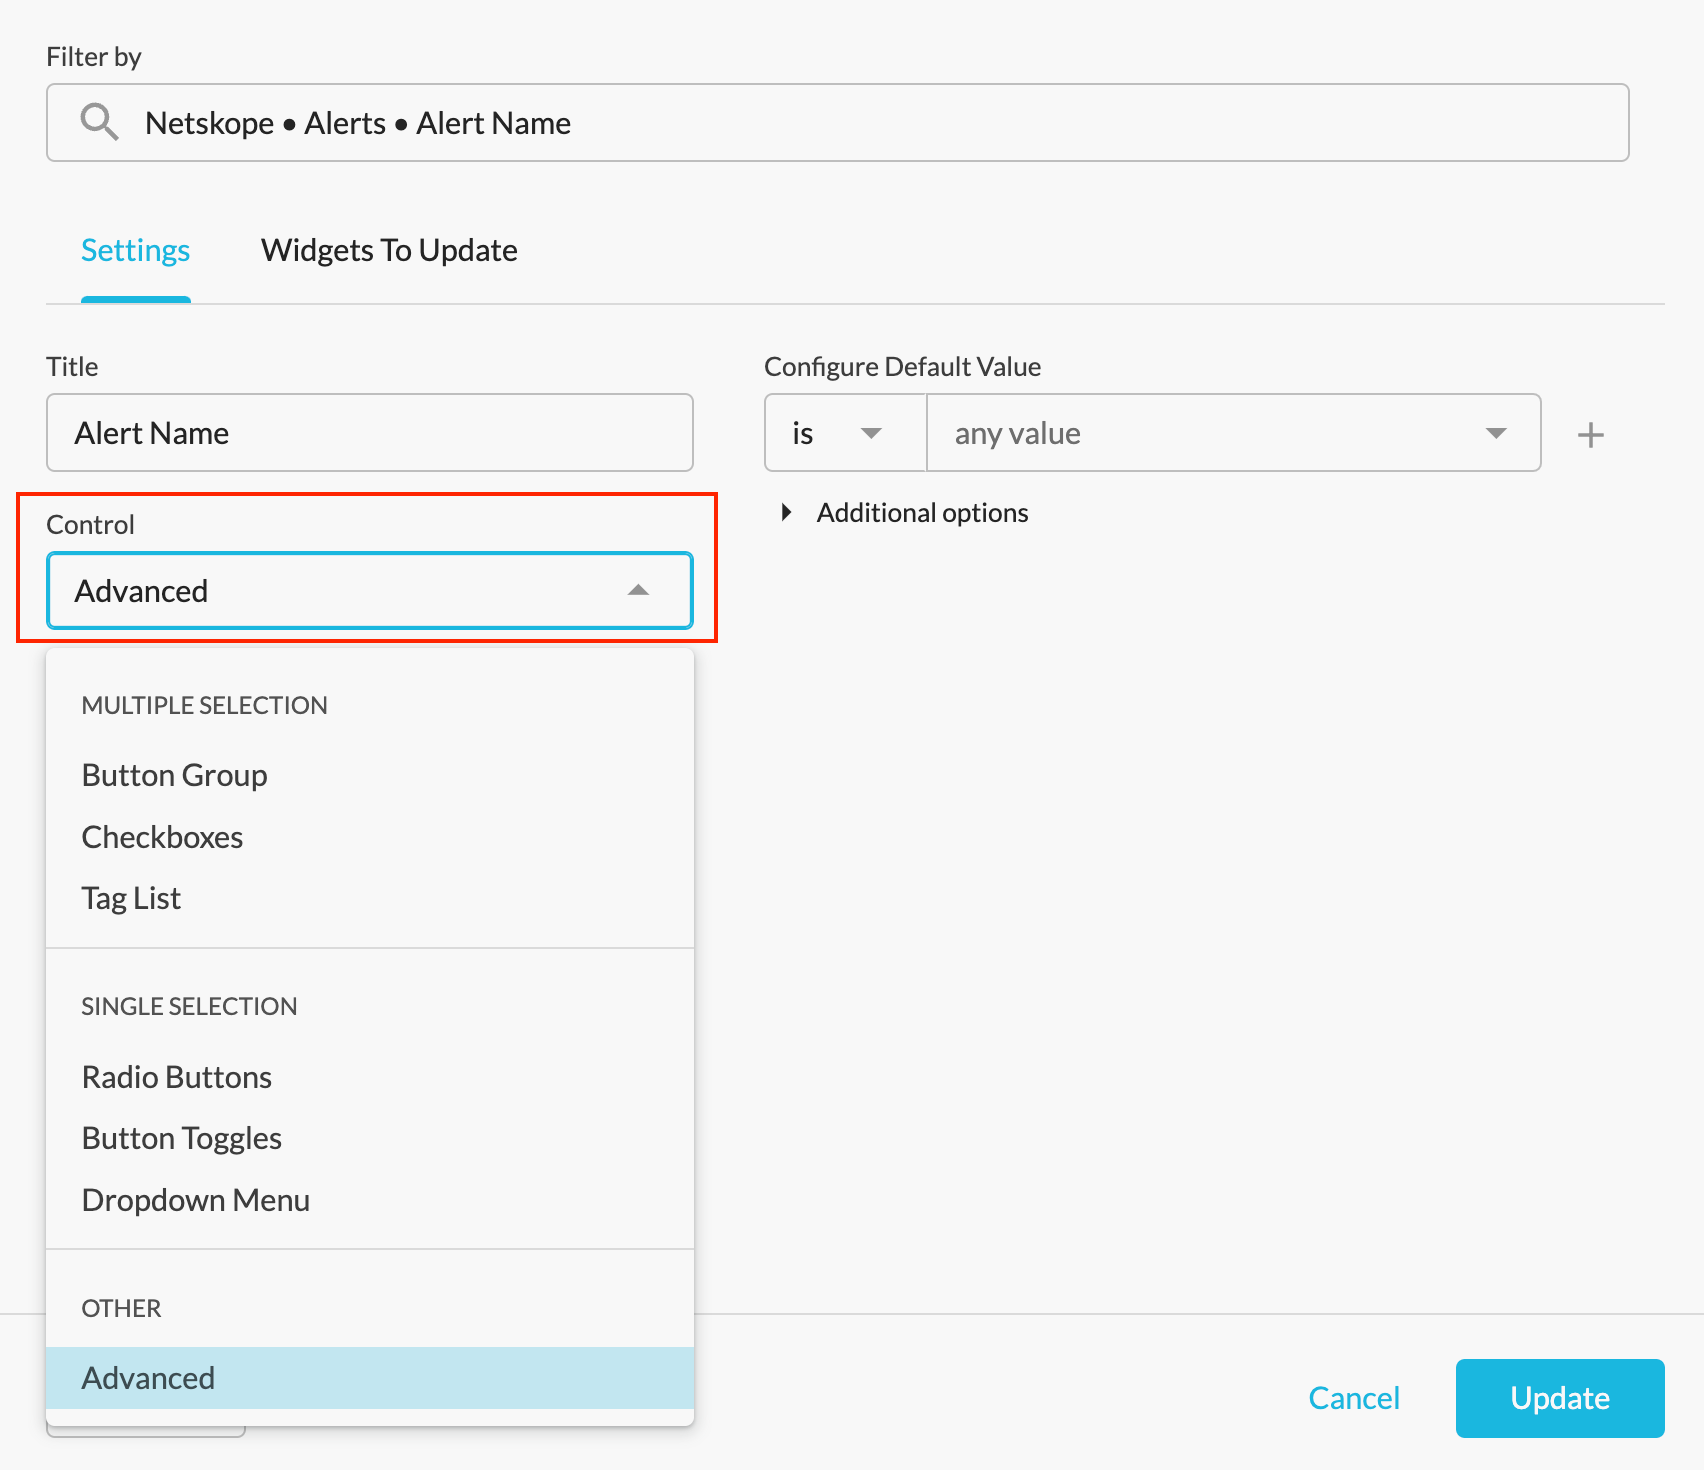
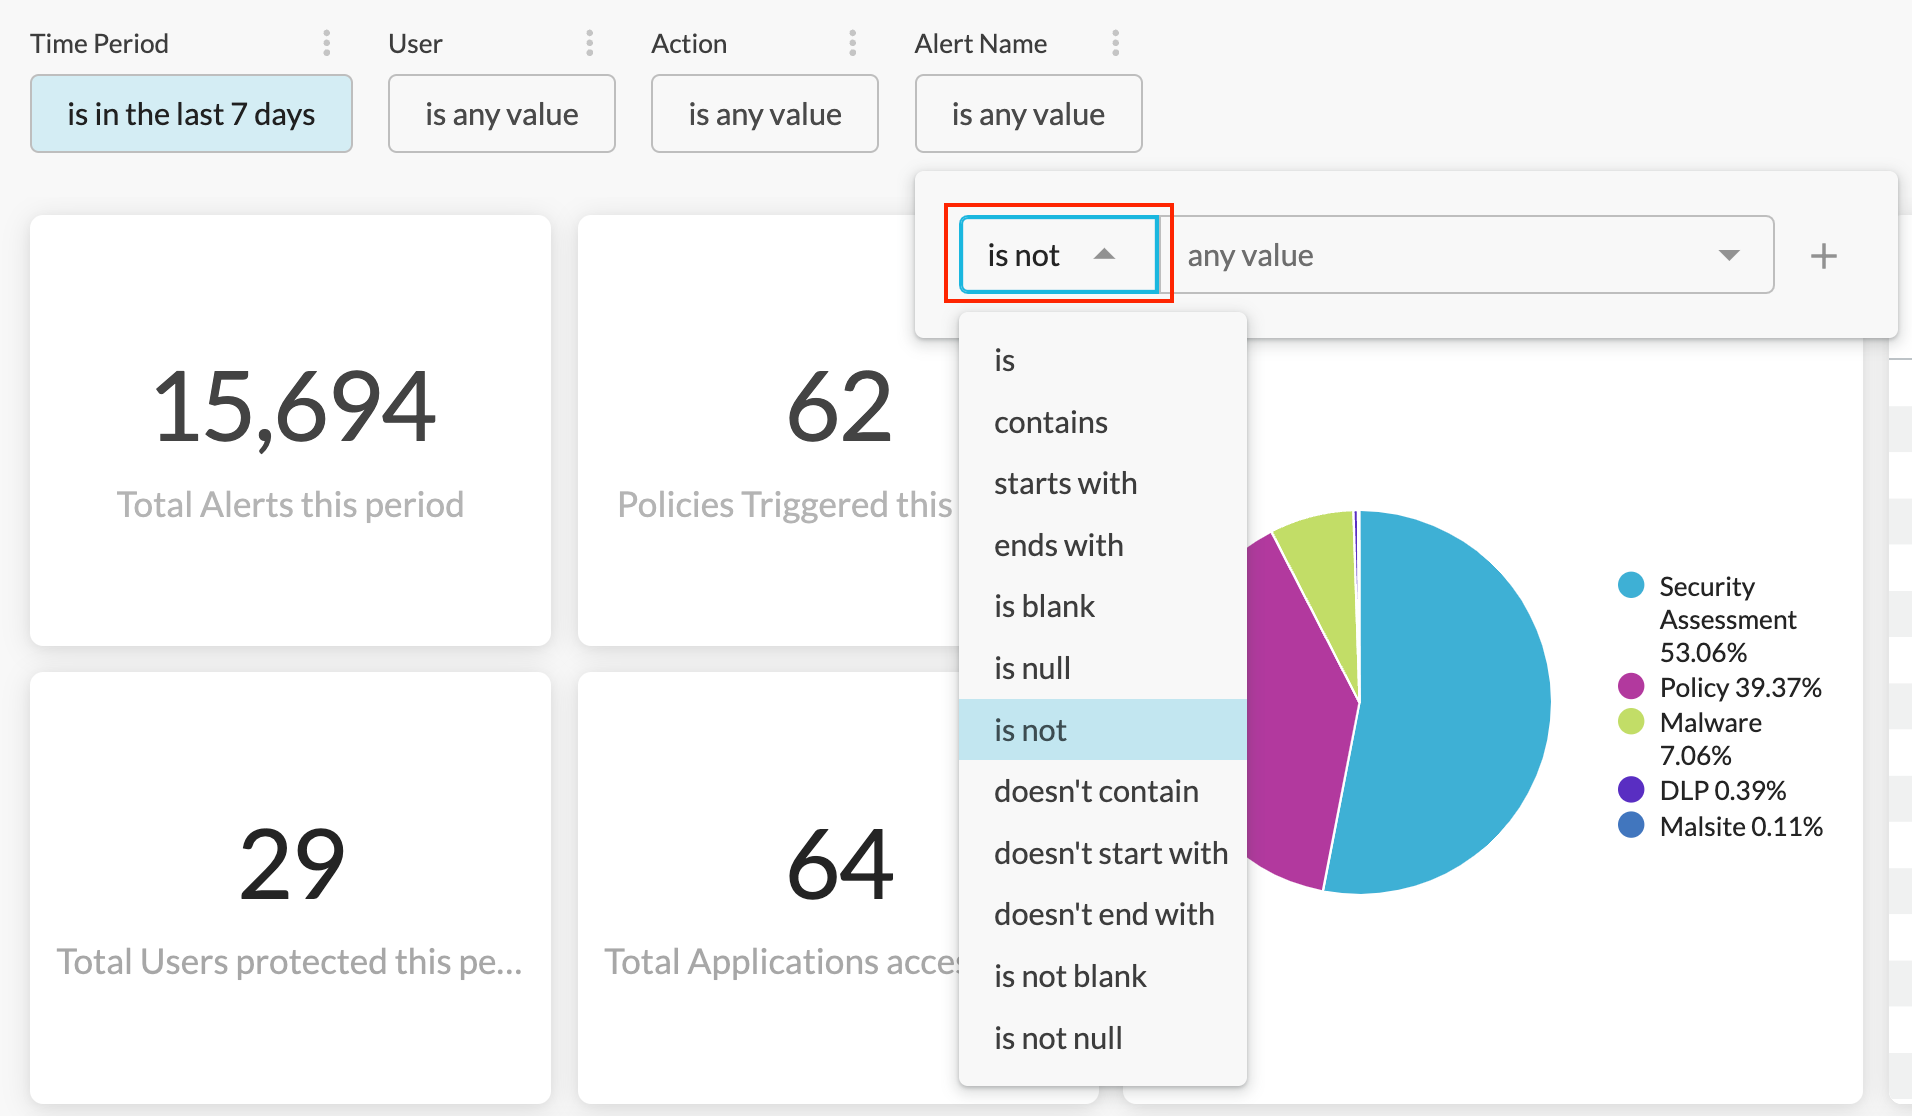
Thanks @Aaron_Zhang - Any issue if I add in a filter that filters out “Fallback Action” from alerts? That accounts for most of our alerts and it’s really not an “alert”
@nduda No problem! You can definitely add an “Alert Name” filter, or any other filters based on your use cases, to filter out “Fallback Action” from the alerts in your environment.
While adding a new filter to the dashboard, please select “Advanced” in the control panel. This will allow you to set the filter to “is not Fallback Action.”
Currently, there is not a pre-defined health check dashboard specifically for ZTNA Next since Advanced Analytics does not provide very thorough visibility into this topic.
If you are looking for particular metrics to monitor ZTNA security posture, feel free to reach out to your Netskope account representatives. Our team can help you customize a dashboard if the metrics are available.
Best,
Aaron
Senior Data Analyst - Analytics Strategy
Hi Aaron,
Yes, we also found that the attributes and prebuilt dashboards for ZTNA are limited. We would like to rely on your expertise to understand which metrics Netskope recommends monitoring for a better functional health check.
As ZTNA creates a security & access framework that connects users with enterprise resources, private app usage is the one of the top used & recommended metrics for ZTNA security health check. The Private Application Overview Dashboard in Advanced Analytics > Netskope Library provides great visibility into this topic, including:
Private app usage overview that helps you gauge how heavily ZTNA is being used in your organization
Data center locations that helps you identify ZTNA usage in unexpected regions
Policy info that helps you monitor policy violations
Usage trend that helps you uncover anomalous usage
This is also the only pre-defined dashboard about ZTNA health check currently. If you are looking for additional metrics or data, please feel free to share it in ourIDEA boardor reach our to your Netskope account representatives to initiate the feature request process.
Please let me know if you have any other questions!