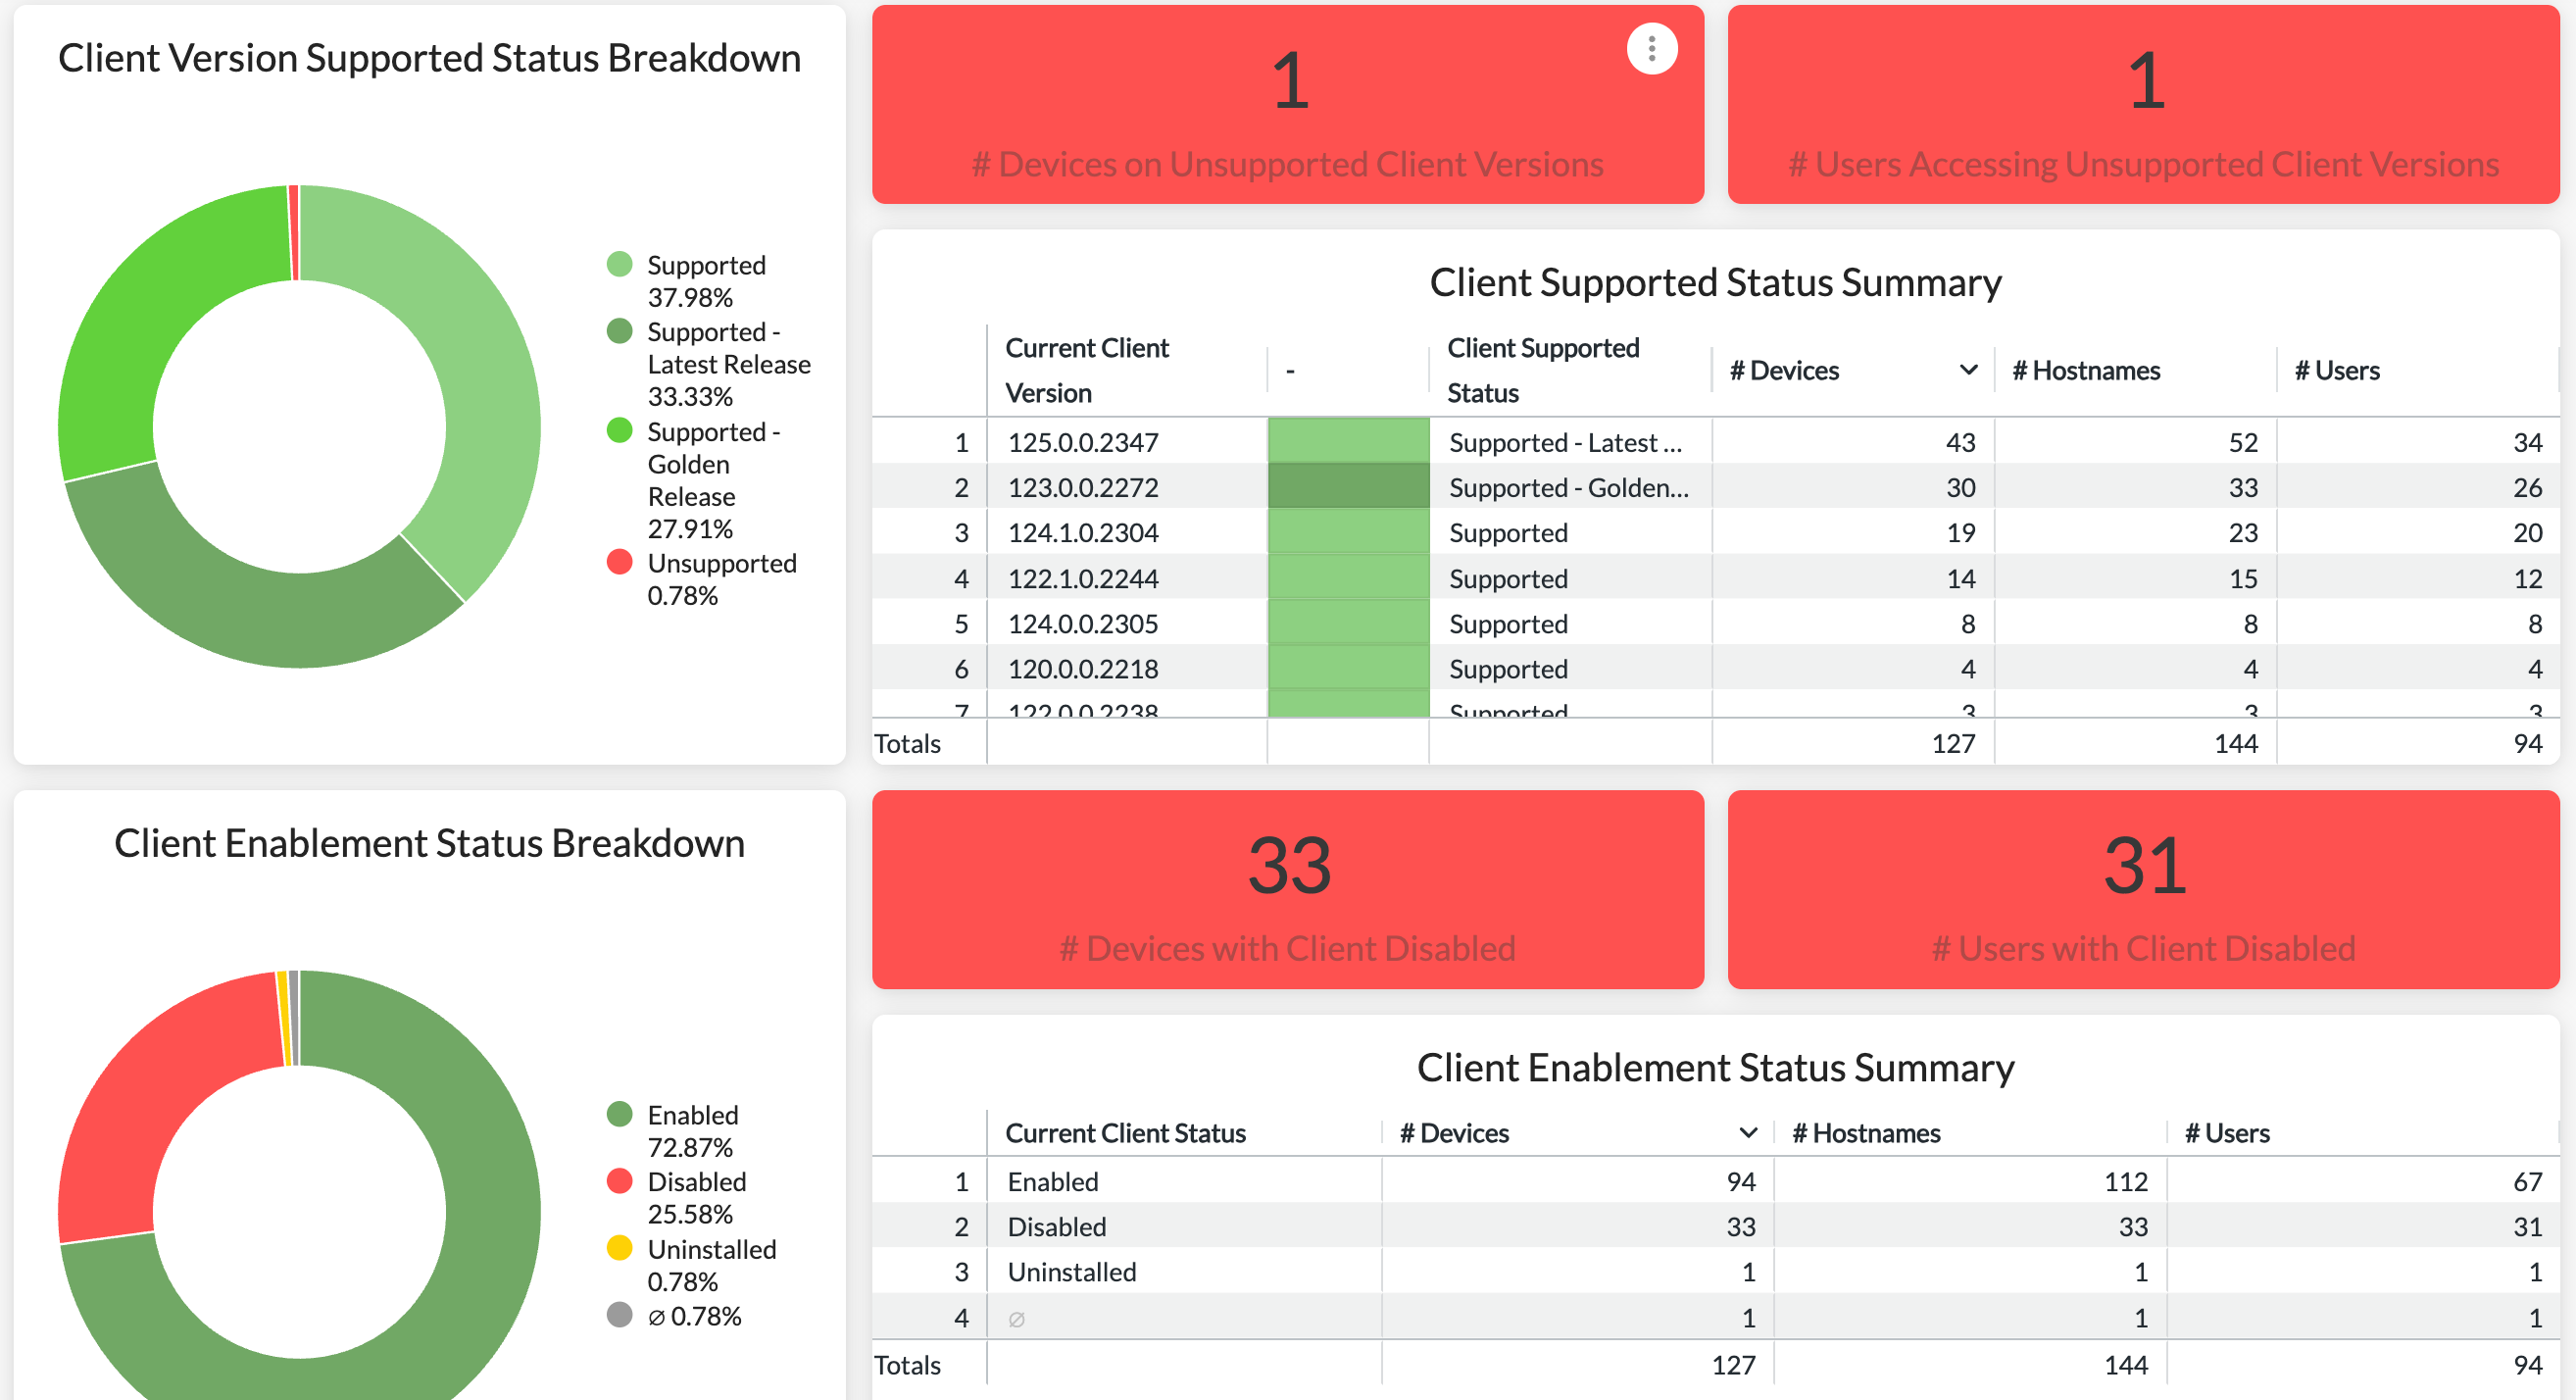
Added the “Netskope Client Insights” section that uncovers devices & users currently running on disabled Netskope Client and unsupported Client versions.
An updated version of the NG-SWG Health Check dashboard is now available!
The purpose of this dashboard is to help you maximize the ROI of your Netskope investment by highlighting ways to ensure you are using Netskope to it's full potential. The specific focus of this dashboard is operationalization of the NG-SWG product. Below you will find a breakdown of some of the views in this dashboard.
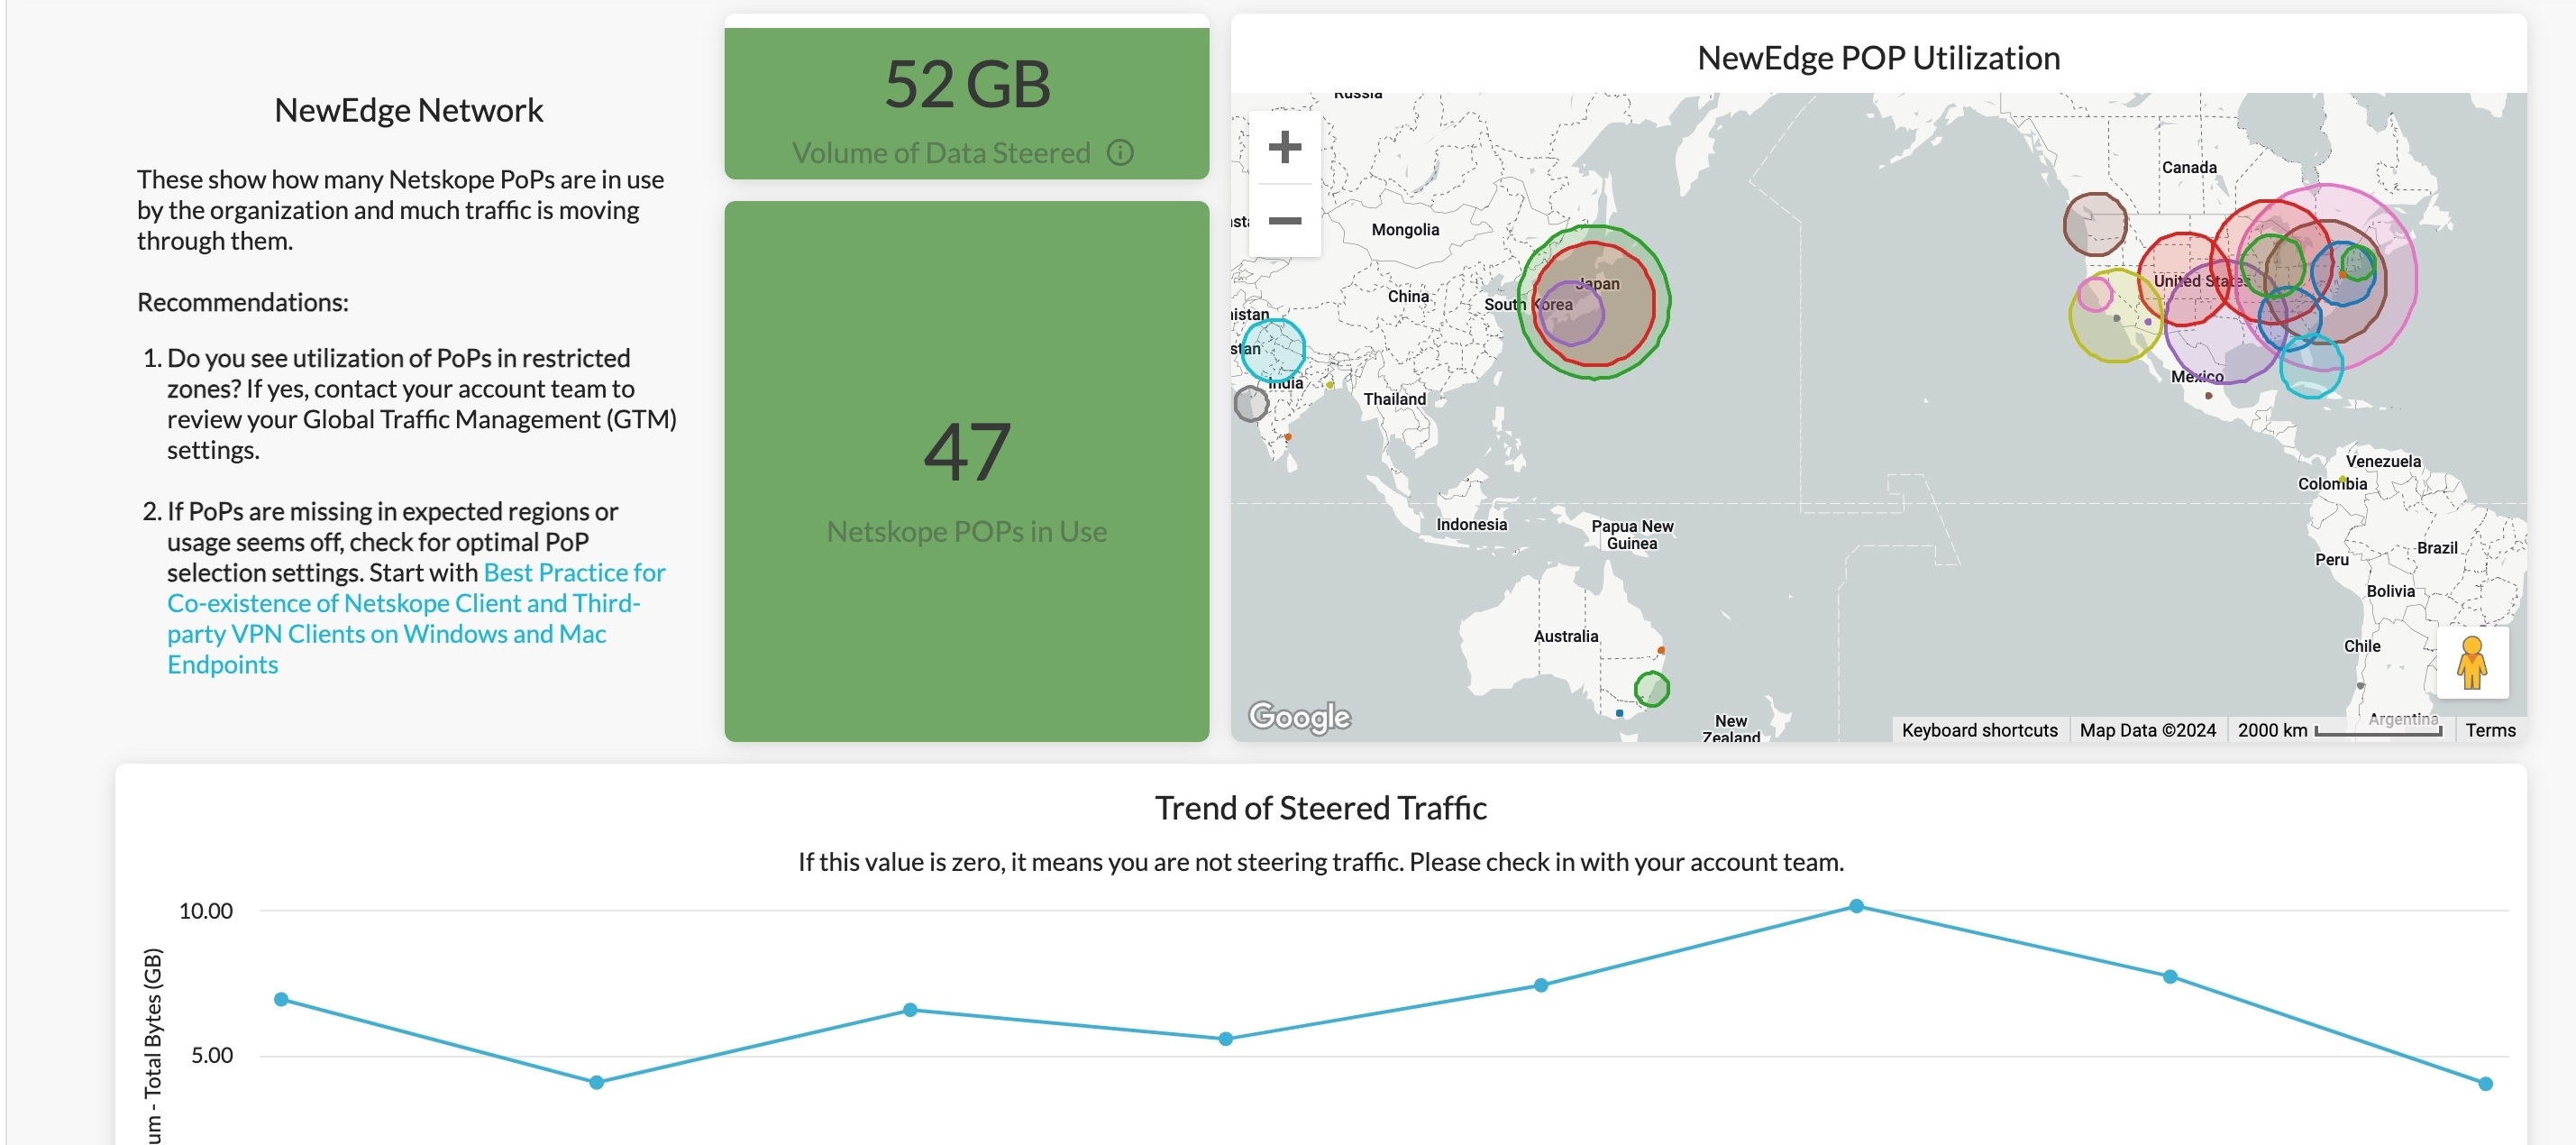
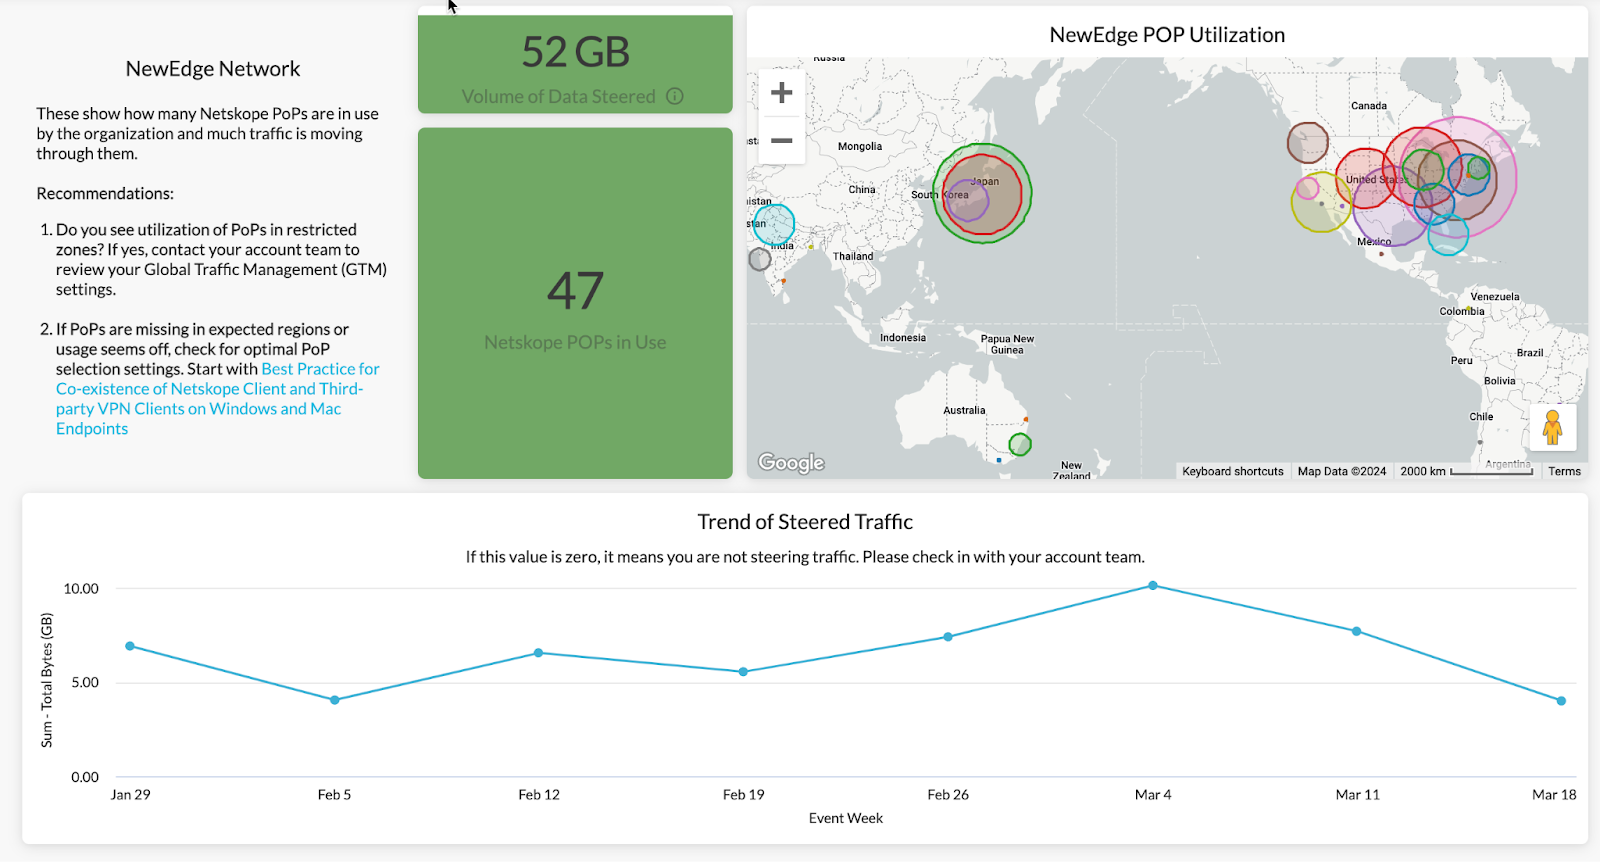
The first set of widgets focus on the NewEdge network and the POPs in use by your organization. These views help you determine if you need to optimize your POP selection settings.
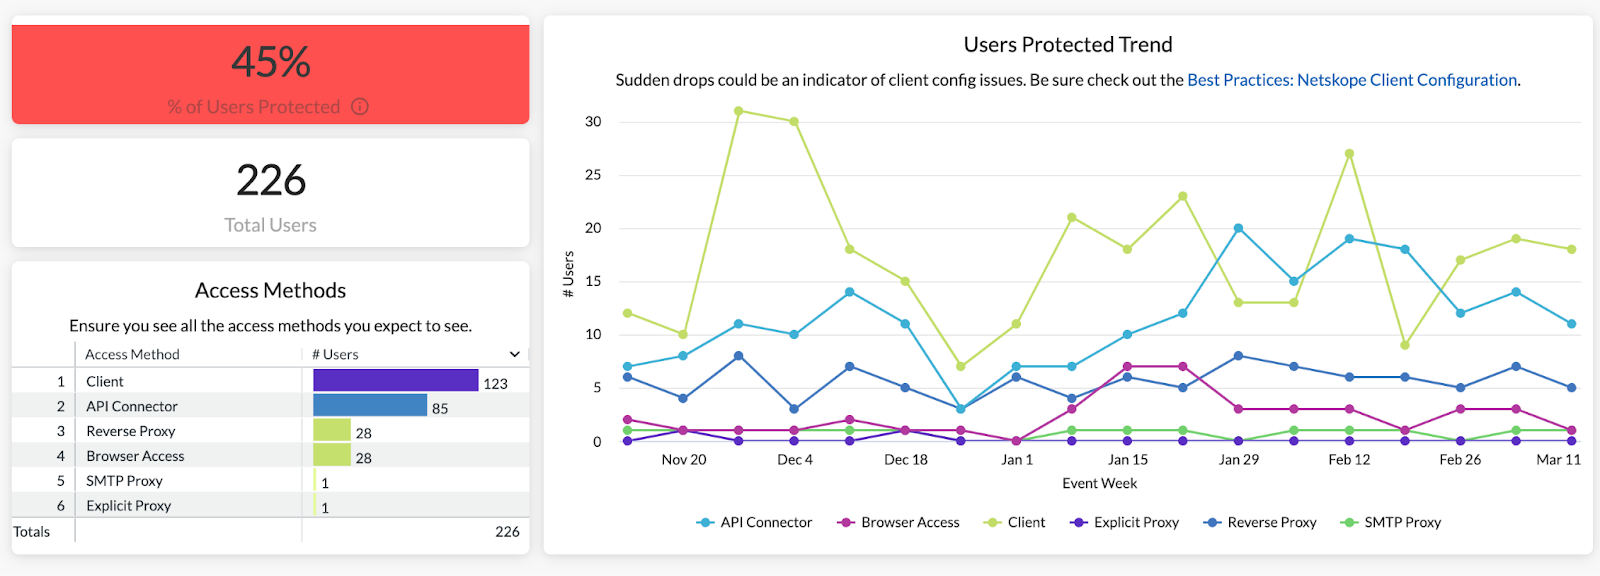
Next you can see the number of users protected and steering methods used. Are the total users protected close to 100% of your organization size? Do you see the expected # of users protected? Are the access methods listed the expected ones? If not, these are red flags and we encourage to check the recommendations to resolve your issue.
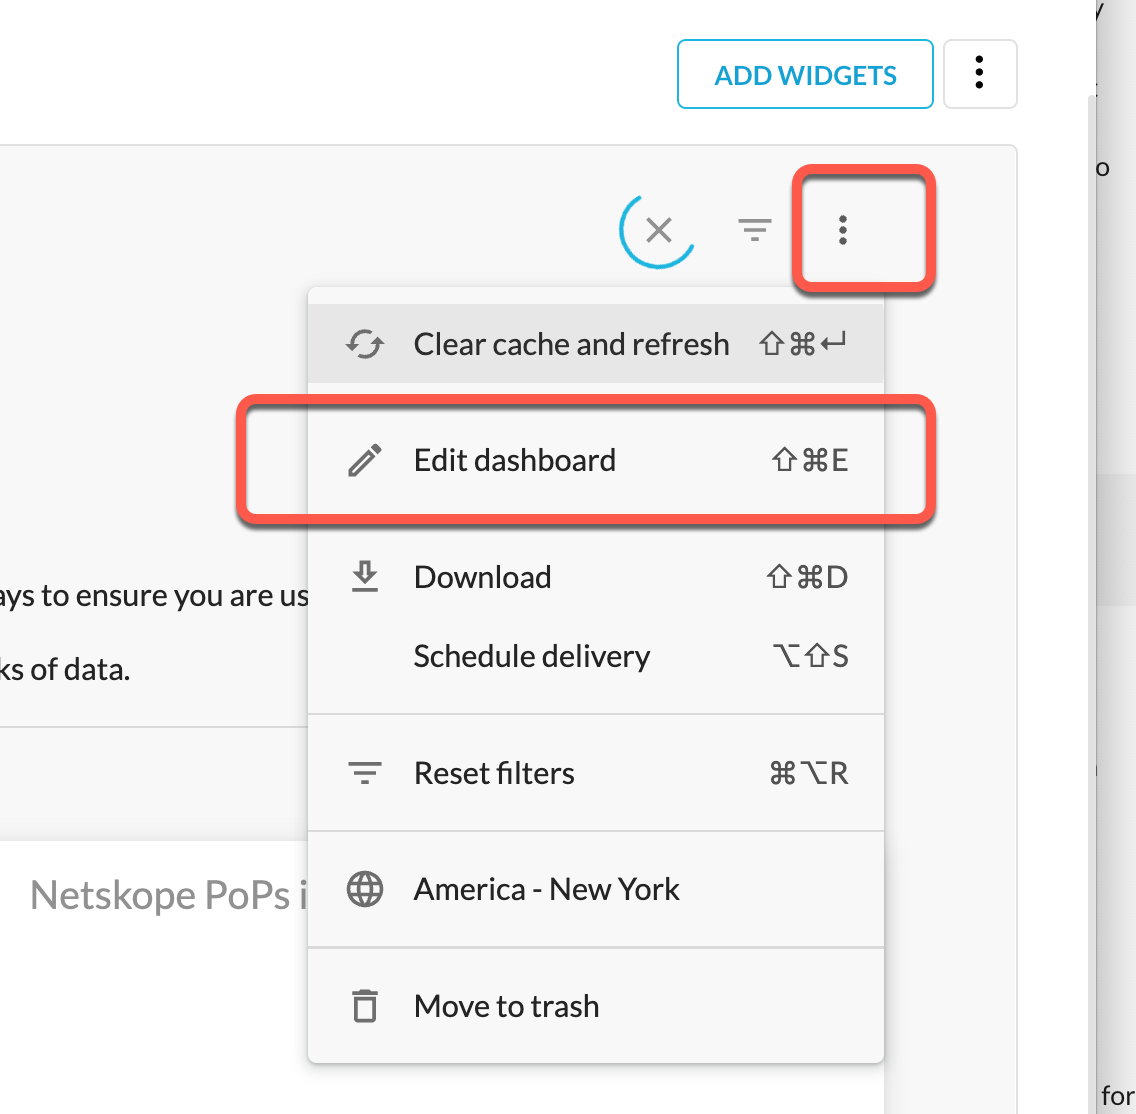
Please Note: Customization is required for the “% of Users Protected”. Use the following steps to do this (reference screenshot below):
Edit the Dashboard
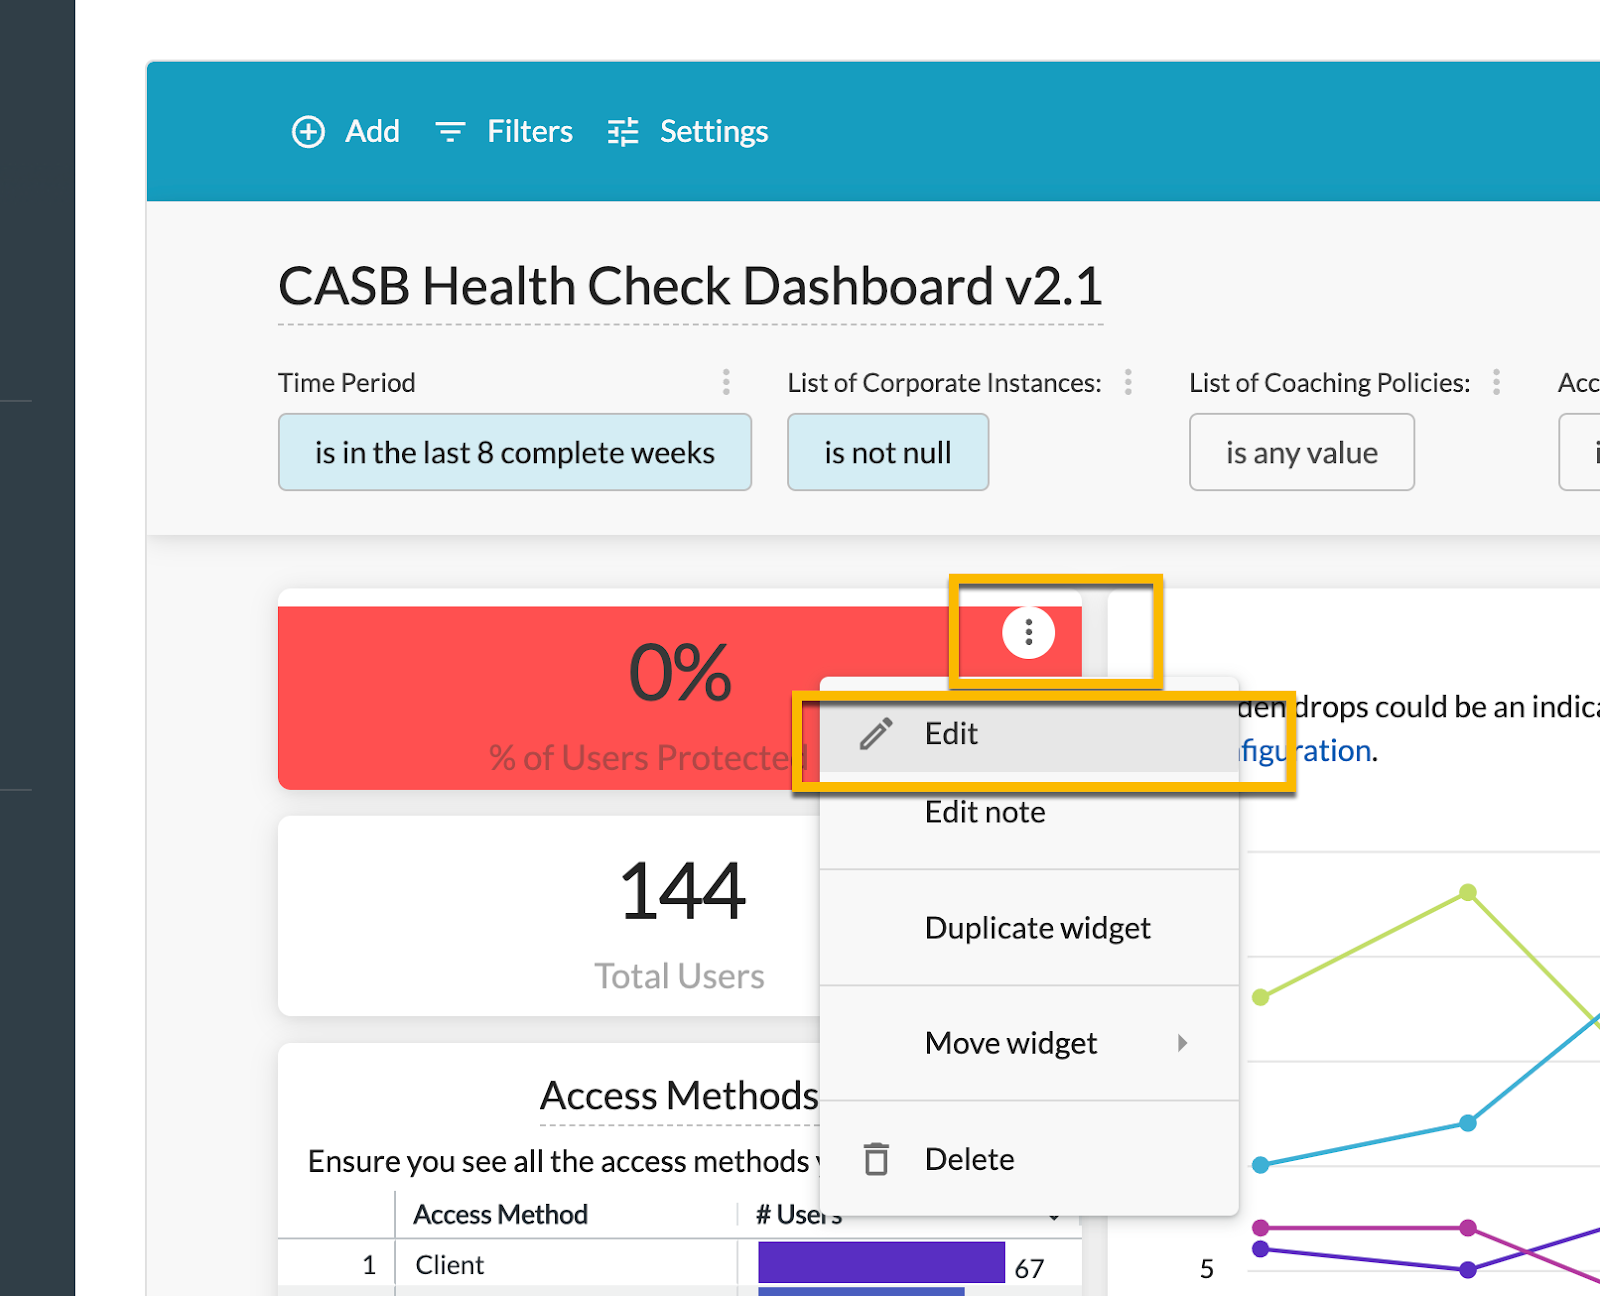
Edit the Widget
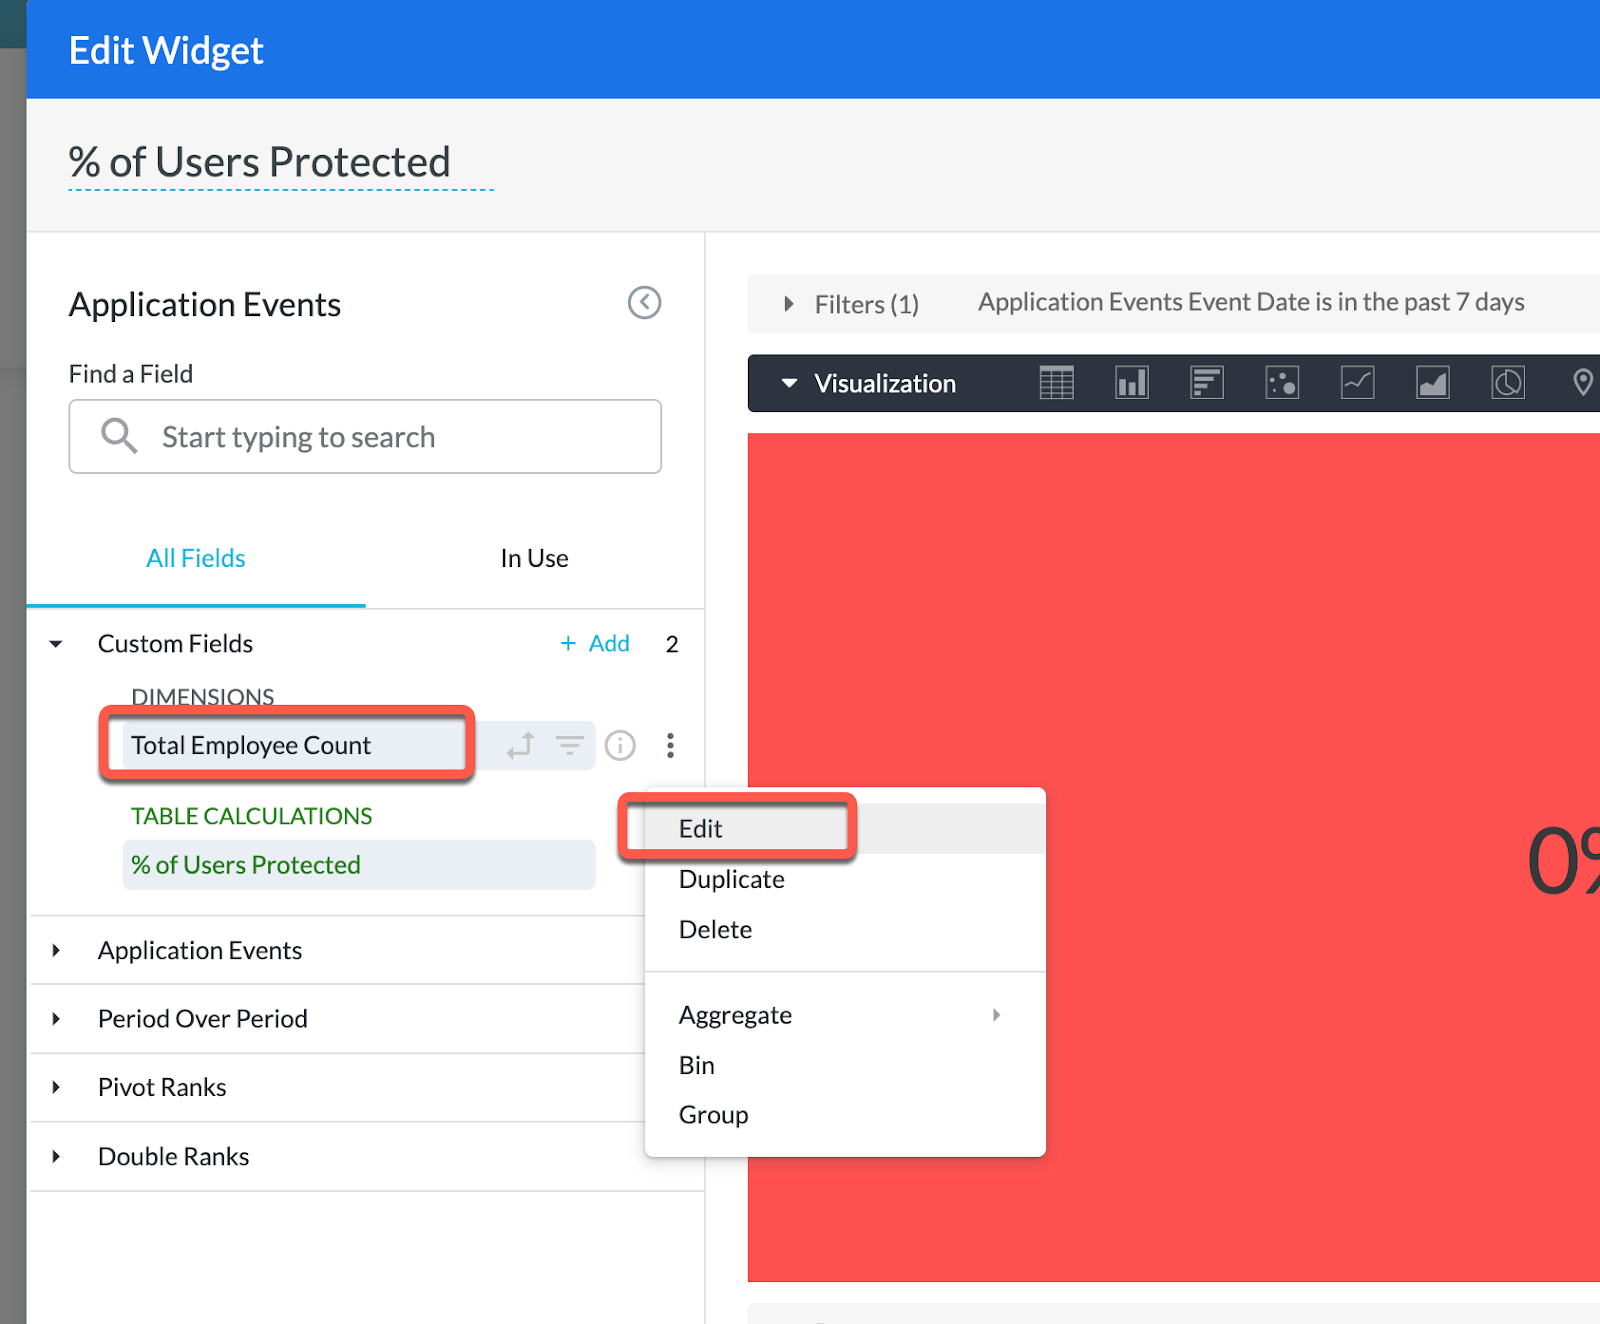
On the left side navigation, expand “Custom” section
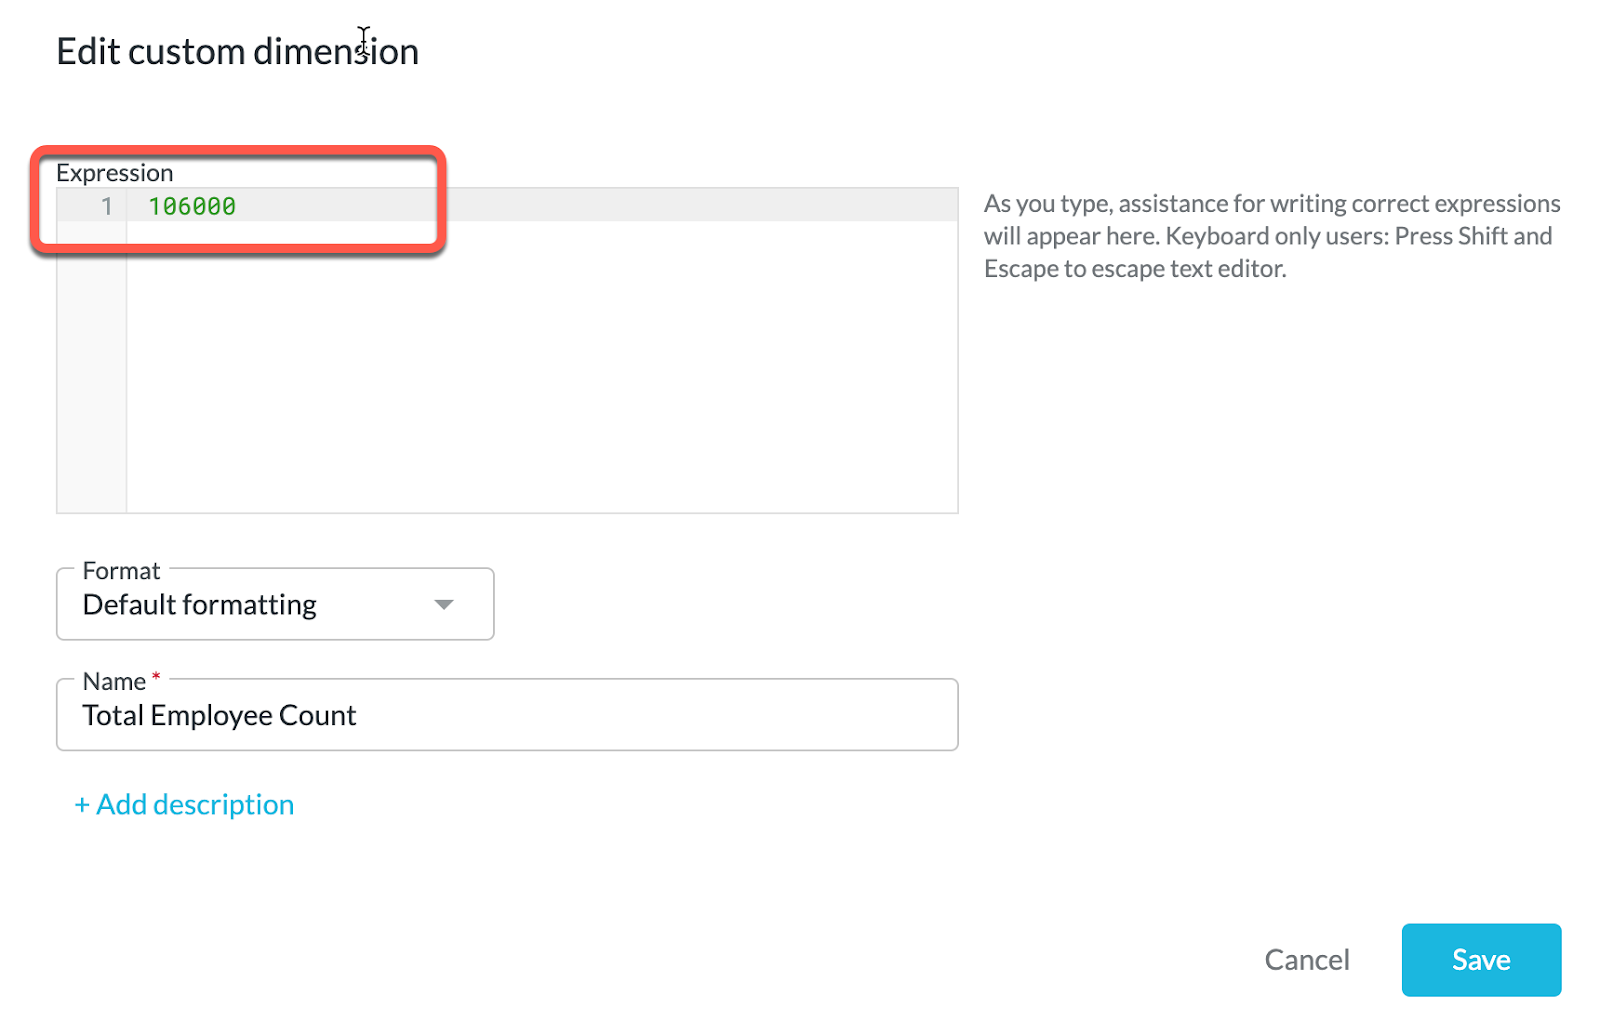
Edit the “Total Employees” and update the value with your employee count
Save update. Save widget. Save Dashboard. (Reference screenshots below)
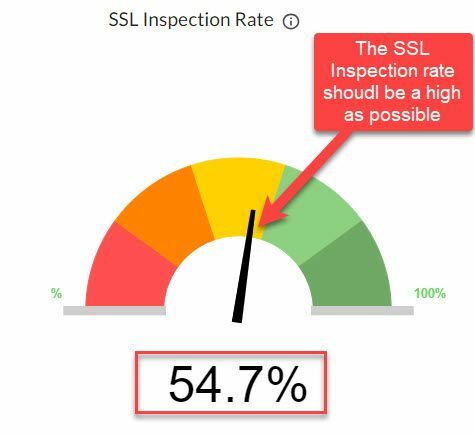
After making sure the users are adequately covered, it is important to ensure that traffic is being inspected. The next set of widgets help you understand the SSL inspection rate:
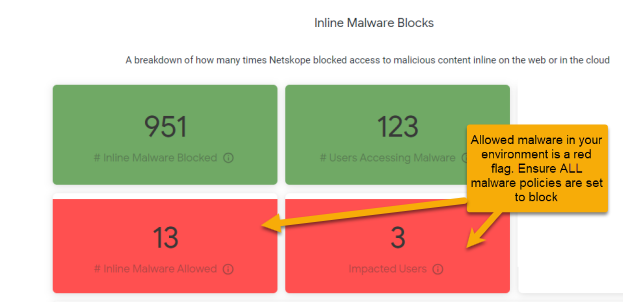
After this section we get to a set of views to help you understand Malware & Malsites and common pitfalls. Here is one example below:
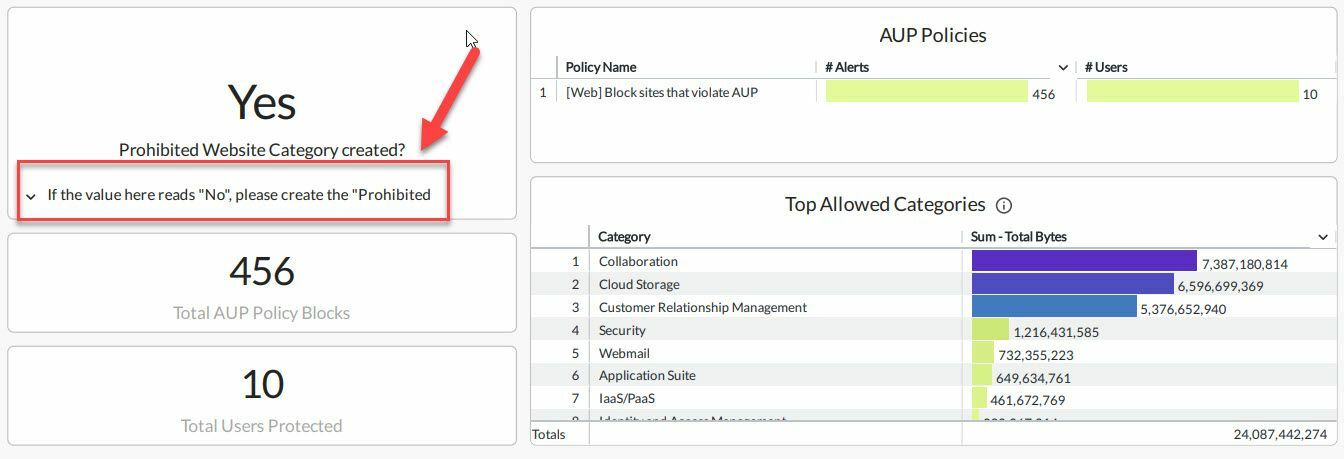
Netskope best practices encourages customers to create a "Prohibited Websites" custom category. Ensure it exists in your environment and being used:
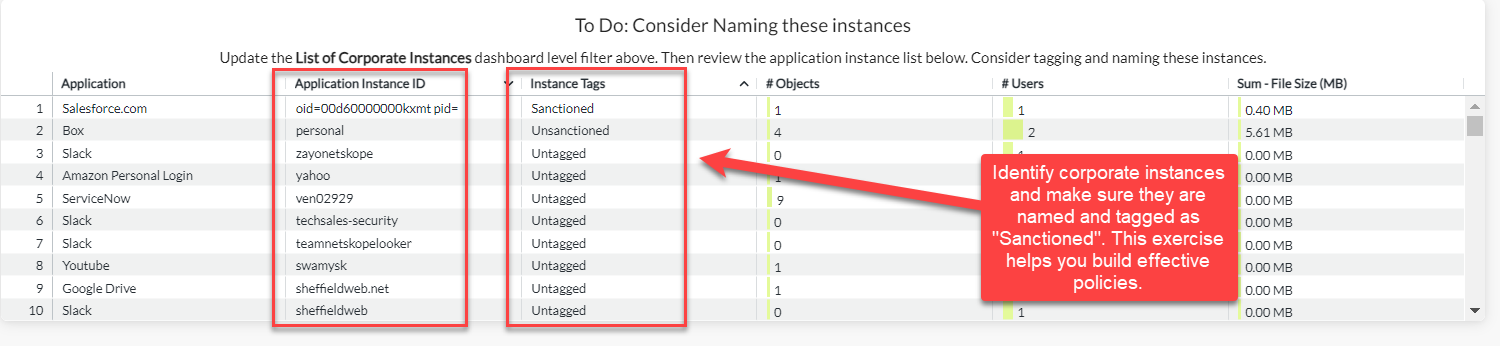
Tagging corporate-managed applications and identifying corporate instances are a very important prerequisite to the creation of effective polices. This widget helps you identify instances that should be named:
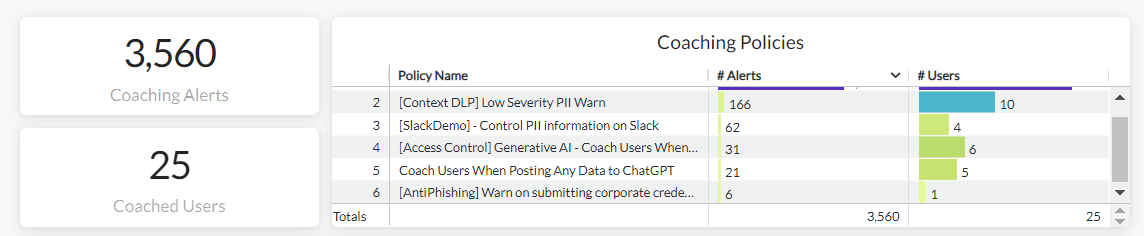
Coaching policies are recommended to gently nudge users into appropriate web usage while at the same time ensuring business use cases are not blocked. Make sure coaching is implemented in your environment with these views:
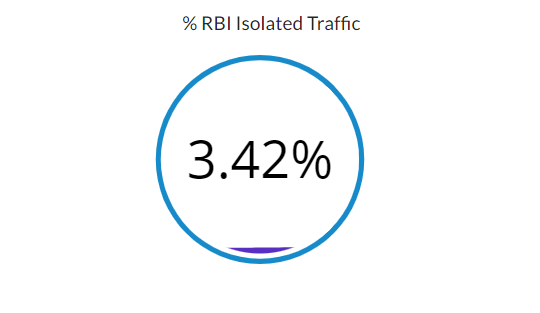
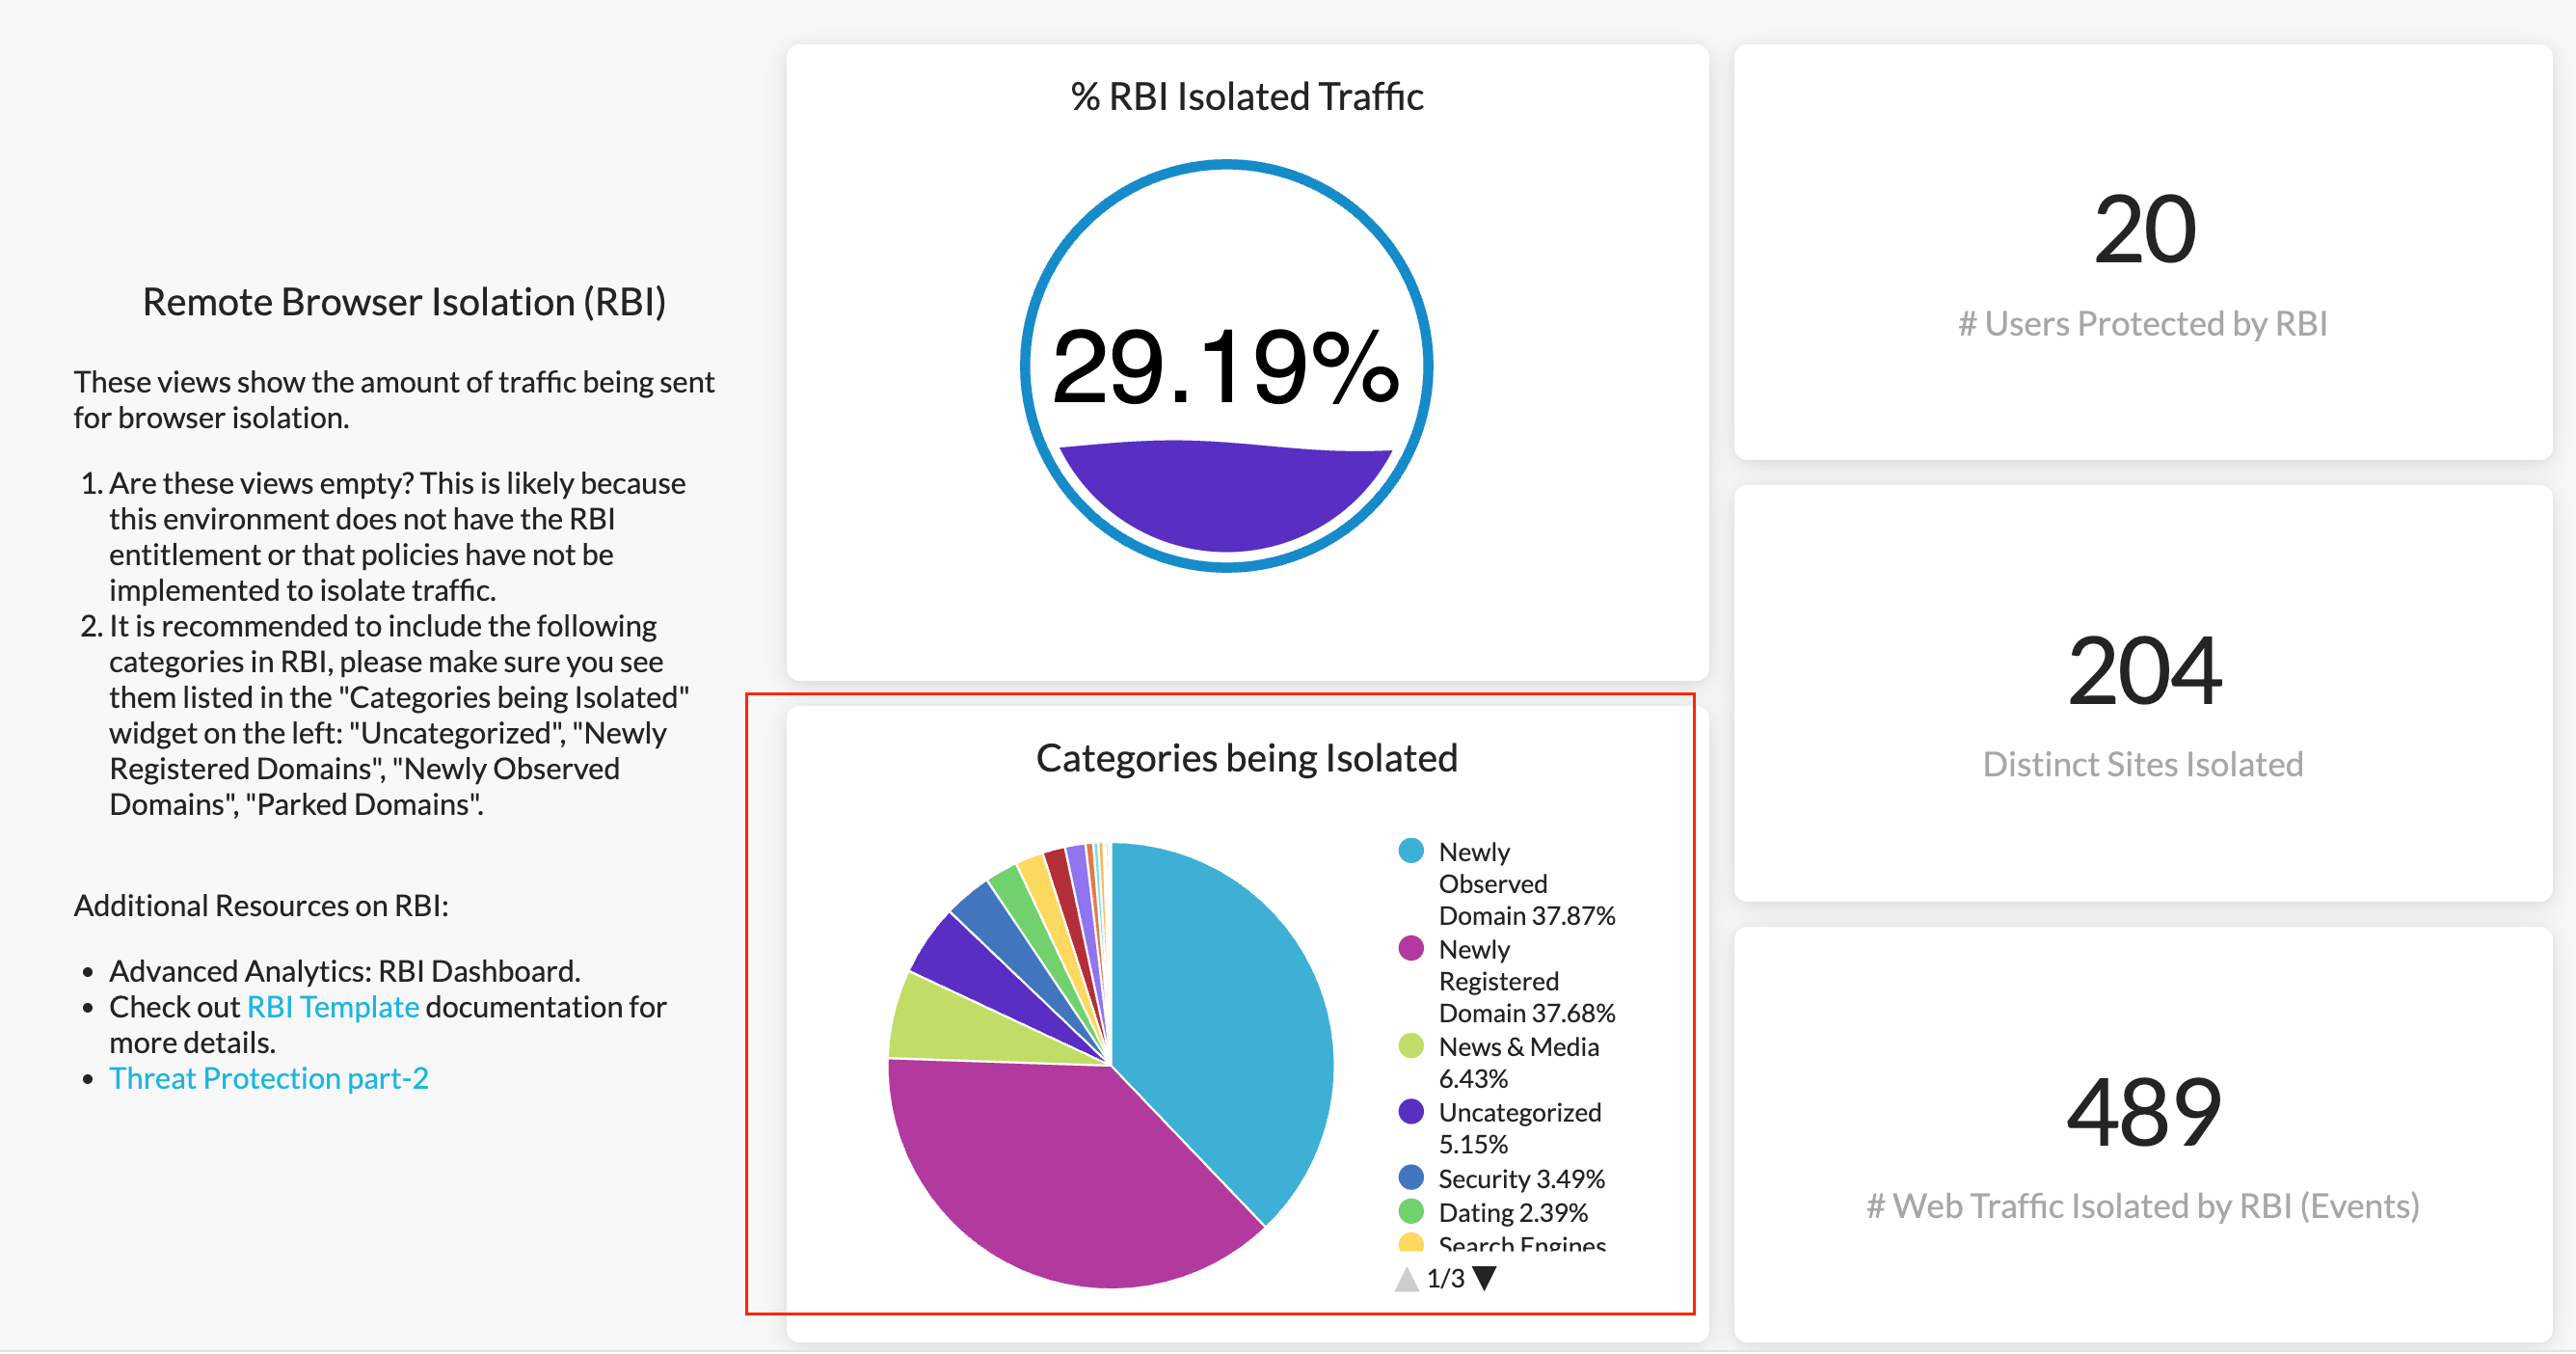
Finally, if you have the Remote Browser Isolation capability, ensure it is running and effectively isolating traffic:
This is just the start, we look forward to hearing from you so we can create insights to move you forward! Thank you!
This is a really good dashboard. I am a little confused by the “Top 10 Users Visiting Malicious Sites” widget, as it filters on malsite blocks and graphs on # of events over time. Is it an accurate title?
Also, # events isn’t the only criteria - I copied that widget and put in #sites, and then another widget for #users. Graphing only # events could be 1000 people for 38,000 events, or it could be 3 people for 38,000 events, knowing the difference - especially over time - would lead to different reactions.
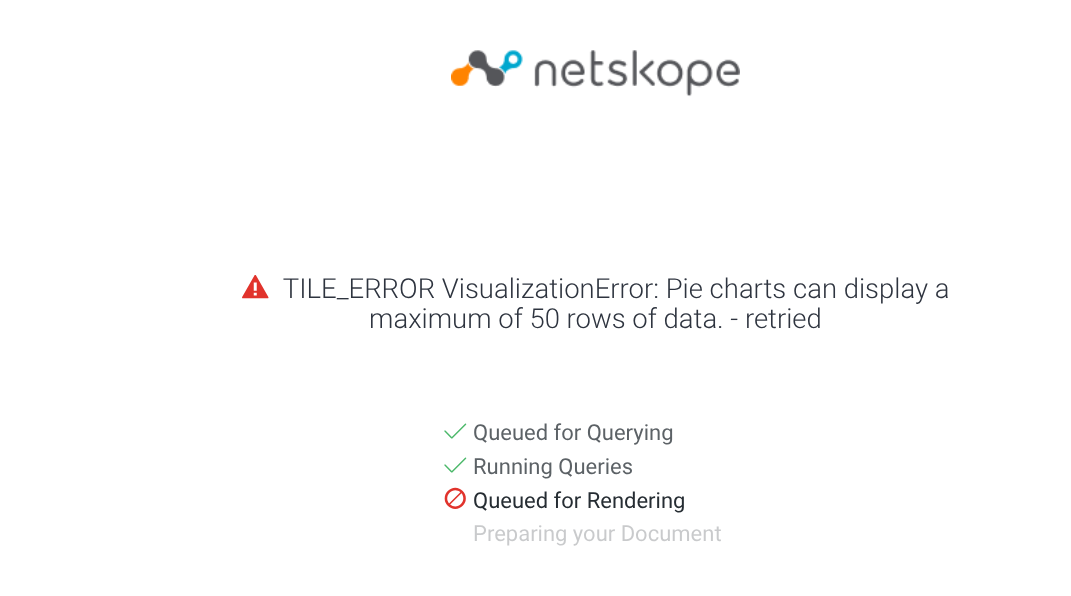
No matter the number of days (90, 60, 30, 7, 5, 3) I choose in the UI, the download report function of this report throws up this error, how do I resolve it?
Hi @hjw . The issue is caused by the pie chat in the last section of the dashboard. Pie chart can only display a maximum of 50 rows of data, so when there are more than 50 rows of data returned, this error shows up.
To avoid the error, we have replaced the pie chart with a table that does not have a “50 row” limit. The updated dashboard is attached. Please take a look and let us know if the issue remains unresolved.