

🚀 Netskope One Enterprise Browser is a game-changer!
While enjoying the secure and seamless web browsing experience with Enterprise Browser, a common question is being asked by many users: “How is Enterprise Browser being used in my organization?” Our latest Enterprise Browser Usage Monitoring dashboard will help answer this question.
The dashboard contains four sections that drill into Enterprise Browser usage from two aspects: operations and security.
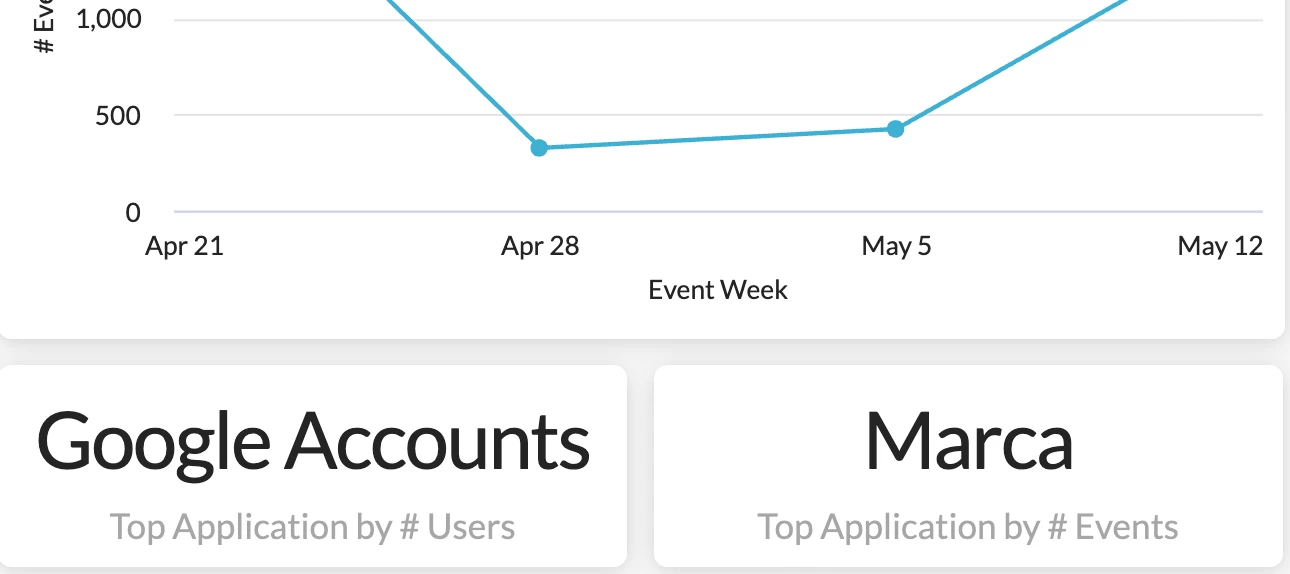
[Operations] Enterprise Browser Usage Overview
As a starting point, this section allows you to monitor the deployment of Enterprise Browser by providing high-level visibility into user trend, traffic volume, and data movement.
Use this section to understand:
- How users in your organization are being onboarded to Enterprise Browser

- If users in your organization are accessing Enterprise Browser from unexpected/unauthorized locations

[Operations] Application Usage Summary
This section allows you to drill into Enterprise Browser usage by providing visibility into app usage, user info, and data movement.
Use this section to understand:
- How heavily/frequently Enterprise Browser is being used

- Are there any unexpected/unauthorized apps, users, and user groups detected

- If there is any data moving to unexpected/unauthorized locations through these apps

[Security] Risky Application Usage
Now let’s move to security. This section helps you identify security concerns within Enterprise Browser by providing detailed visibility into unmanaged and risky app usage.
Use this section to understand:
- What unmanaged/risky apps are being used in your organization, what is the usage trend, who are the users, and what actions have been taken by your policies to control the usage.


[Security] Risky Data Movement
The last section drills into app usage by highlighting risky/sensitive data movement through the apps.
Use this section to understand:
- If there is any sensitive data, either allowed or blocked, moving to unmanaged apps within Enterprise Browser, and what activities have been performed by users with the data movement

Depending on your use cases, you may want to focus on different sections of the dashboard. For example, if you are a workspace admin looking to understand how Enterprise Browse is being deployed and used, the operations sections can be great starting points. If you are a security analyst focusing on identifying risky user activities within Enterprise Browser, the security sections will be better starting points.
The dashboard template is attached below. Feel free to view it in your own environment and share your feedback. Enjoy!
Looking to drill into Enterprise Browser usage and better understand how security concerns are being controlled? This dashboard can help.


