

This dashboard aims to surface the application risk in your environment. Use the dashboard to better understand:
- What applications are being used in your environment
- Are any of them unmanaged, untagged, or risky
- Is there any sensitive or risky data movement through these applications
Let’s take a look in our demo environment.
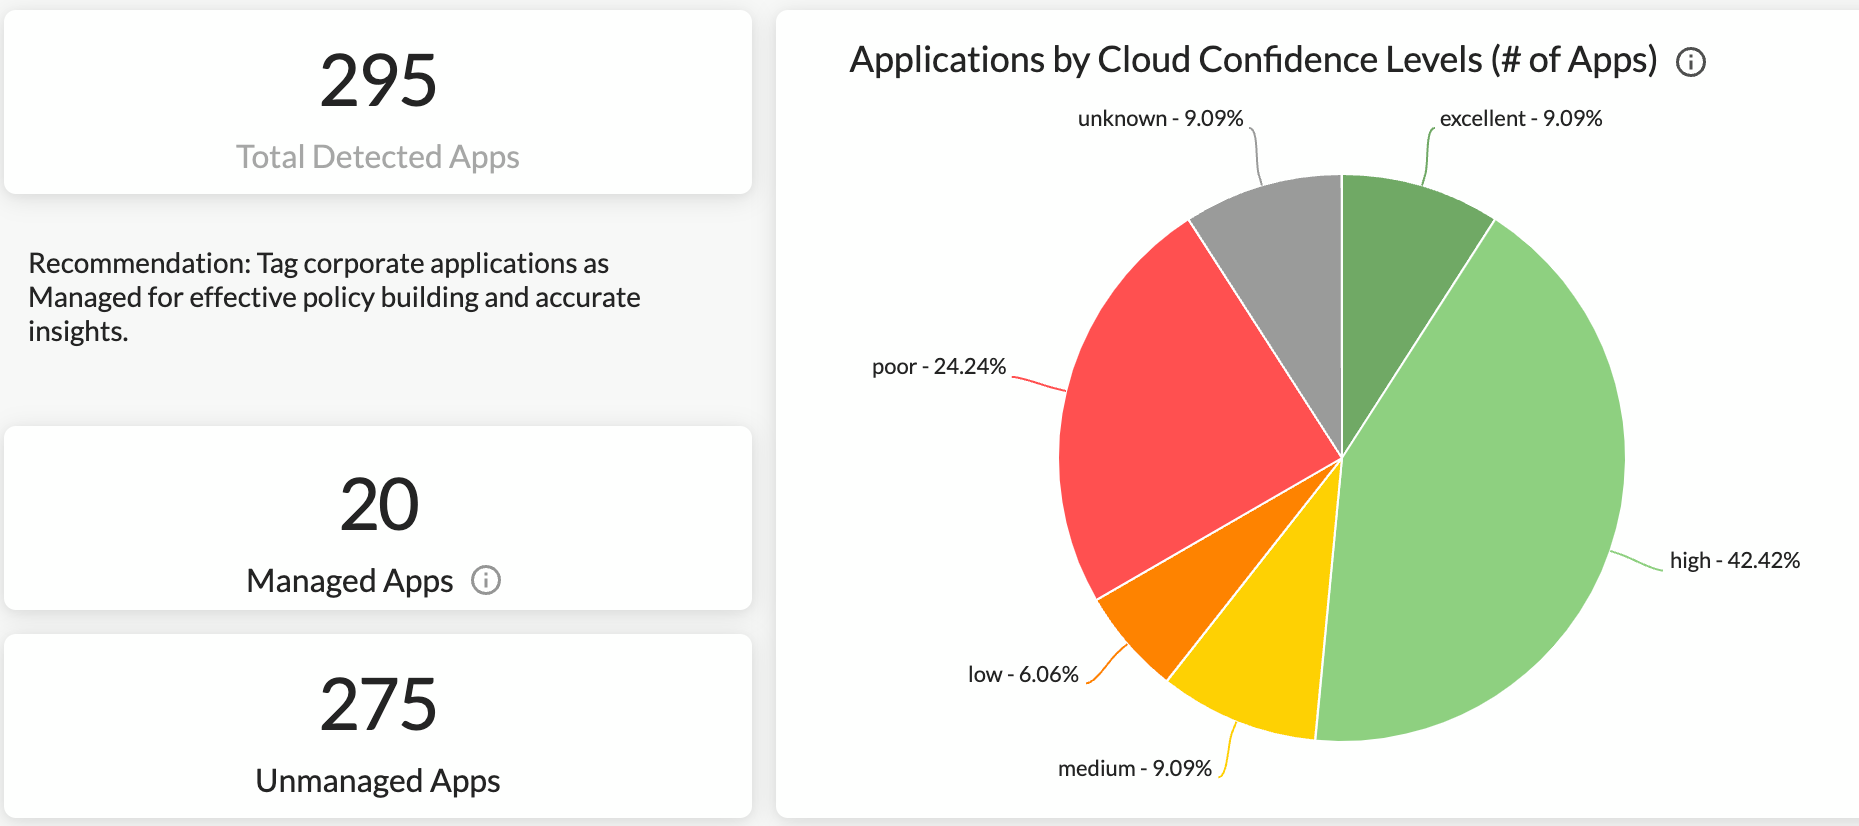
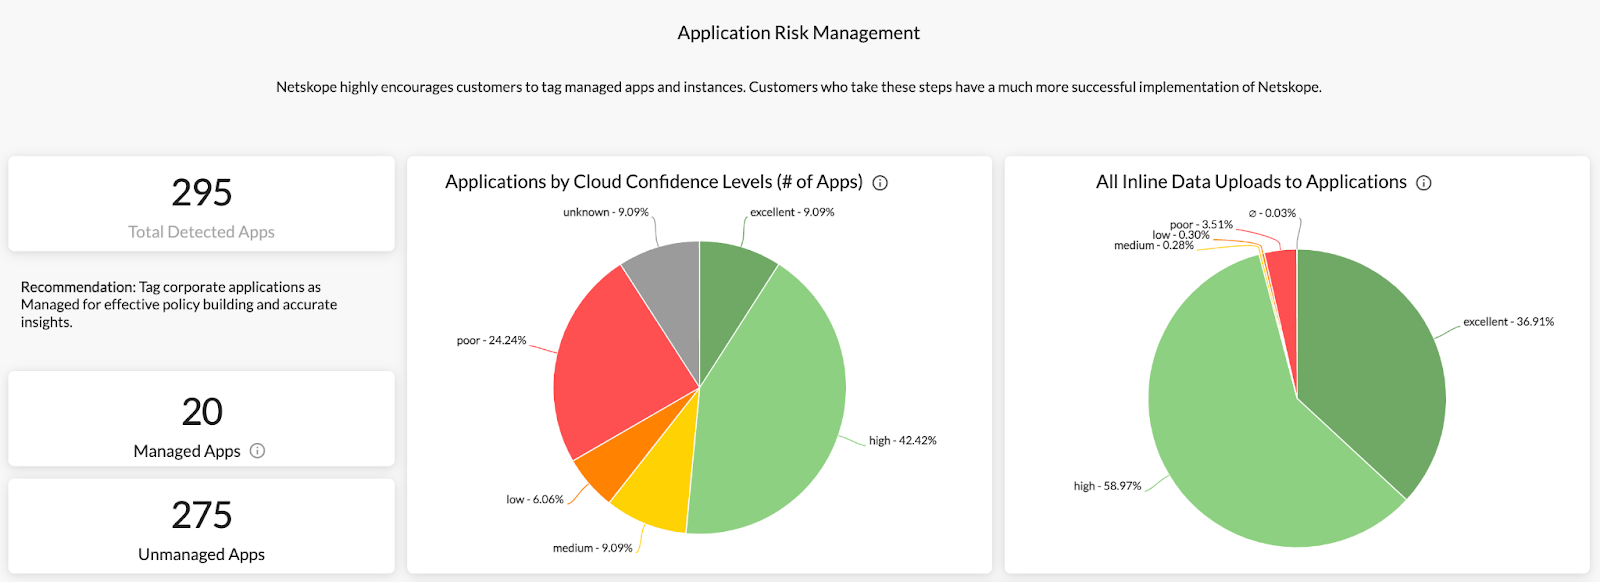
The dashboard starts with a summary of applications being used. Here we can see 295 applications are detected, and 275 of them are unmanaged. Out of these applications, we can get visibility into how many of them are rated as “excellent,” “high,” “medium,” “low,” and “poor” in terms of risk (Cloud Confidence Level). This will help us decide how many “risky” and “less risky” applications are being used in our environment. In the meantime, we can also see how much data is moving to these “risky” and “less risky” applications.
The dashboard then provides detailed information about risky applications and traffic detected, which allows us to perform deep investigations on risky application usage and sensitive data movement.
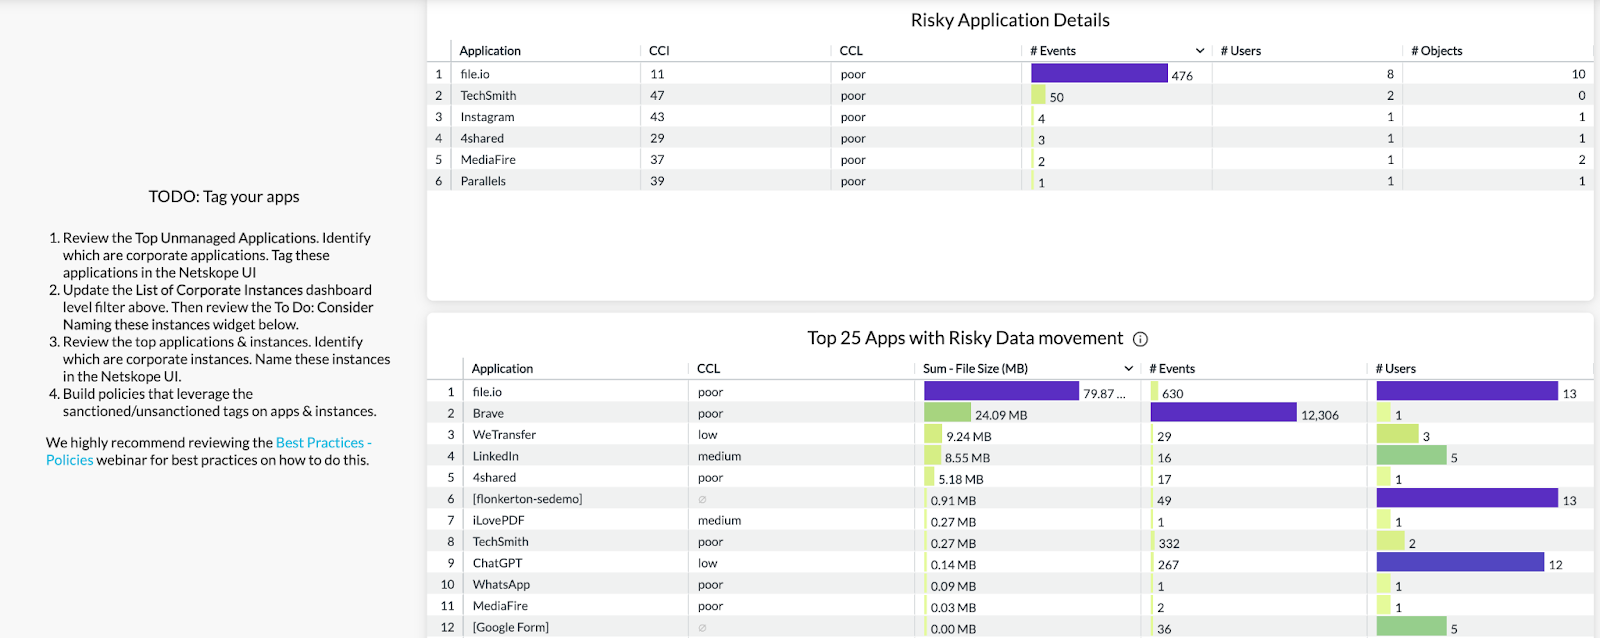
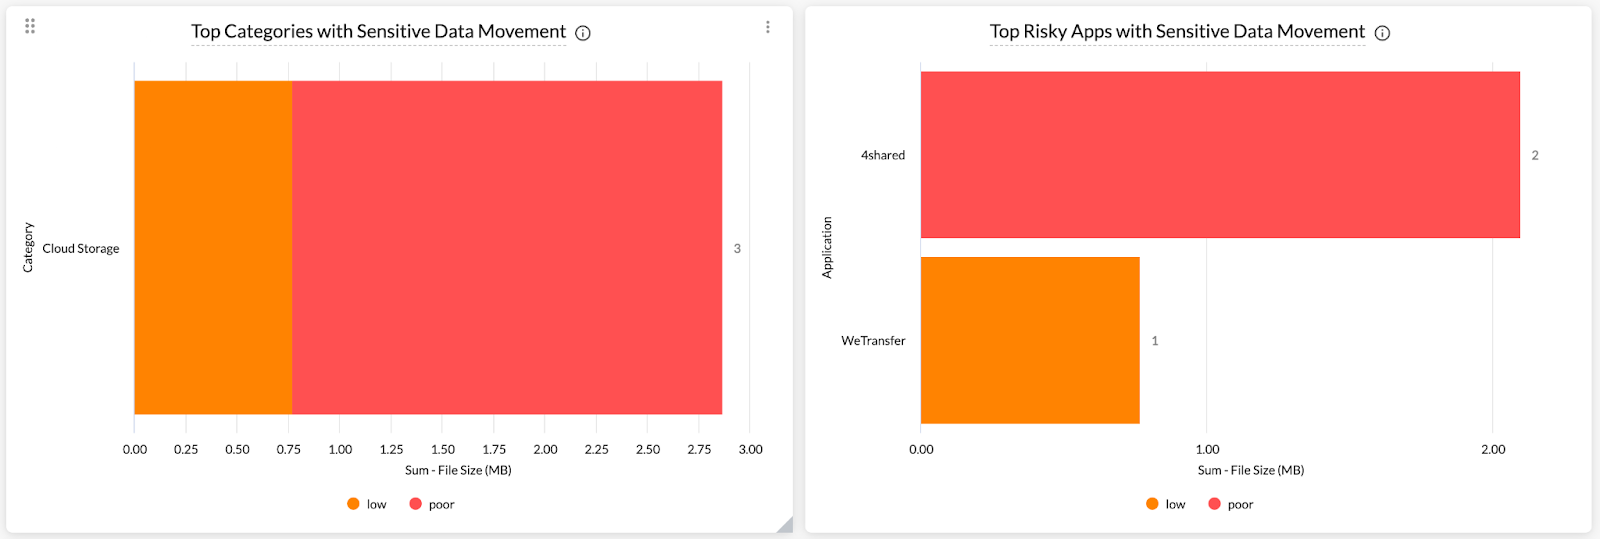
Organizations usually accept the risk of managed applications, even if they are not well-rated in Cloud Confidence Level. So, the dashboard highlights the volume of allowed data movement to risky unmanaged applications, and the top risky unmanaged applications with allowed data movement.
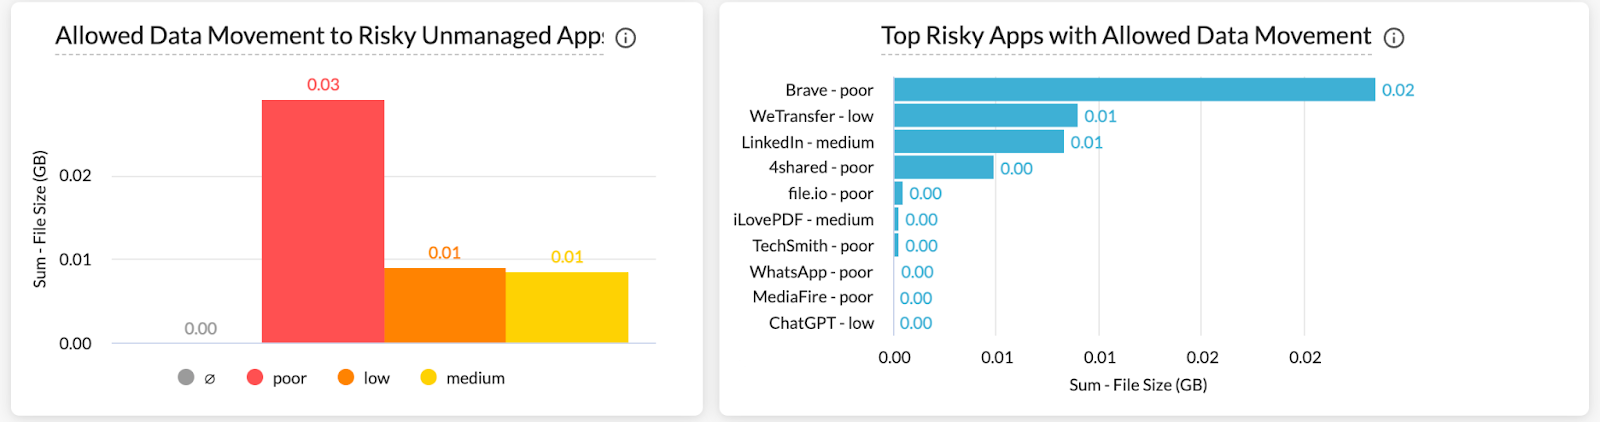
Here, the dashboard also highlights sensitive data moving to risky applications with no restrictions, which represents the opportunity to add controls or tune policies. You may want to consider coaching or blocking sensitive data movement to unmanaged and risky applications.
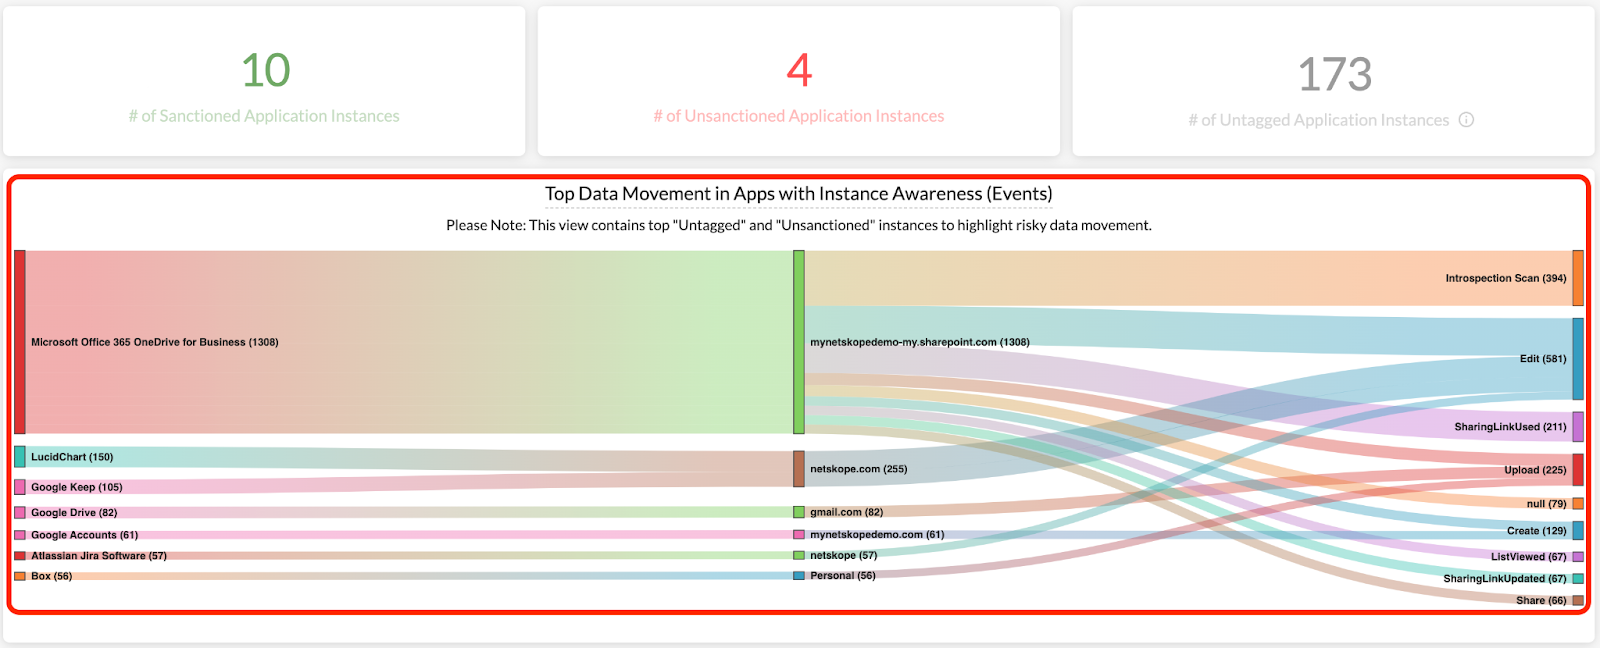
Keep scrolling down. We will get visibility into application instance awareness. This part helps us better understand instance usage in our environment. Here we can see how many of our applications are “sanctioned,” “unsanctioned,” or even “untagged.” Use the Sankey chart to identify data movement to non-corporate instances. If you see corporate instances listed, please tag them as “sanctioned” in the Netskope UI.
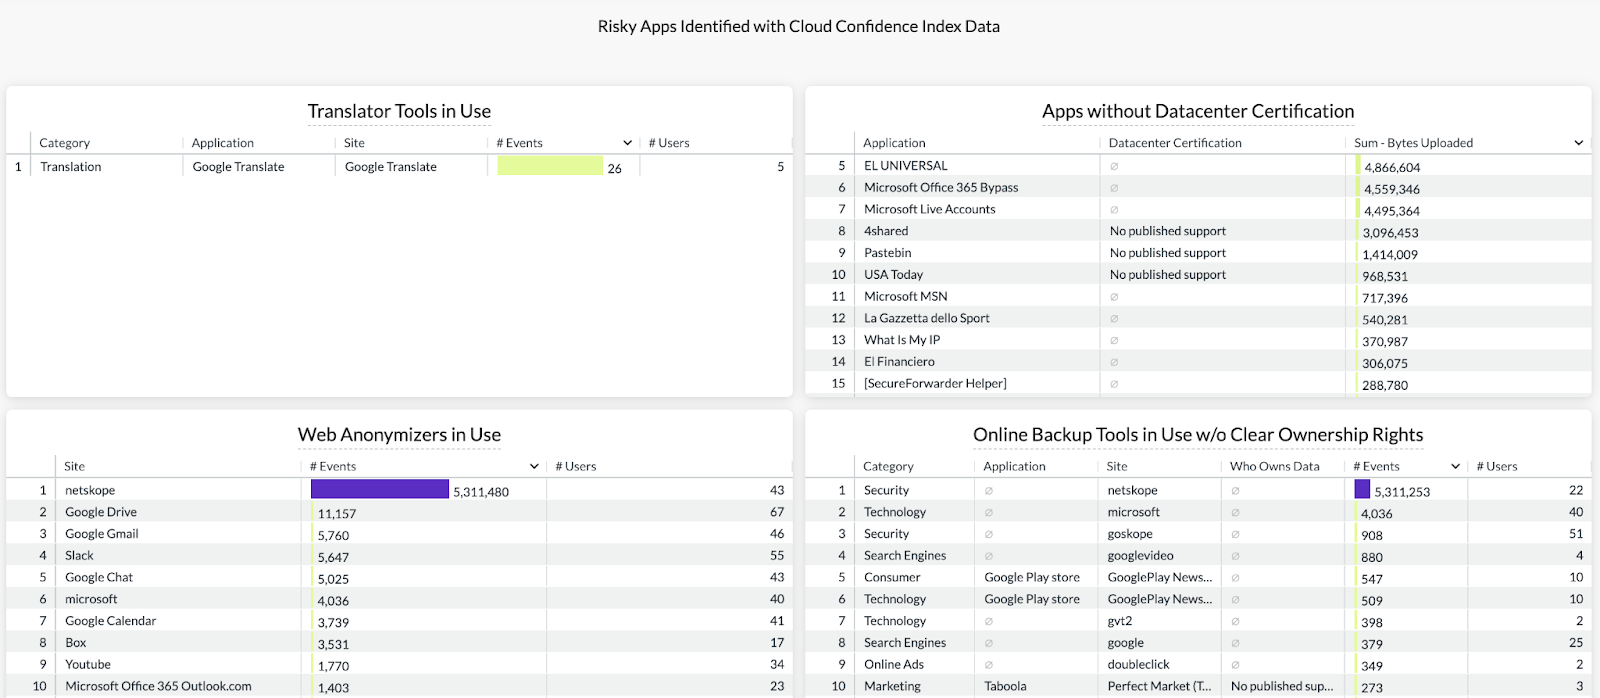
The last section of this dashboard provides visibility into risky applications identified with Cloud Confidence Index data. Use this section to identify and manage intense usage of CCI risky applications.
The dashboard is attached below. Feel free to import and view it in your own environment. Let us know if you have any questions or feedback!


