<Thanks to Steve Johnson, SEM, North East for this Dashboard and the directions below.>
-----------------------------------------------------------------------------------------------------------------------
OVERVIEW:
When using the "Risk Management: Cloud Services" Dashboard, located in the Advanced Analytics library, you will want to customize the Report to focus on your specific "managed" and "unmanaged" cloud applications. Below the steps to customize this dashboard to meet your needs.
-----------------------------------------------------------------------------------------------------------------------
PRELIMINARY STEPS:
- Clone the Dashboard using the following steps: https://support.netskope.com/hc/en-us/articles/360056831574-Netskope-Library
- Tagging Sanctioned vs. Unsanctioned Applications by using SkopeIT is the first policy oriented task
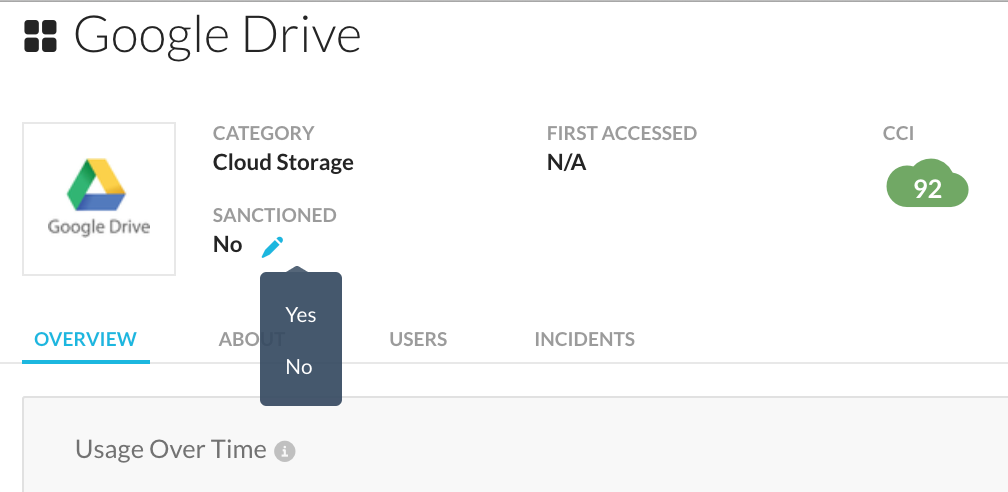 to accomplish. Do not continue until this is done. Everything else builds upon this tagging and visibility.
 - Customizing Activity Risk Levels (Optional) can be achieved by mapping activities to a Risk level: Informational, Low, Medium and High. This concept will be incredibly powerful as you start mapping activity to unmanaged applications. Attached is a custom dimension file (Activity Risk Custom Dimension.txt) that can be modified as needed.
-----------------------------------------------------------------------------------------------------------------------
MODIFYING THE CUSTOM DIMENSIONS OF THE DASHBOARD
In the Classify Cloud Services section, you will need to make the same edits to both the “Top 20 Managed App Instances with Downloads” & the “Top 20 Unmanaged Apps & Instances with Uploads” and also edit the Letter Grade widget found in this section.

1. Edit the Top 20 Managed App Instances with Downloads
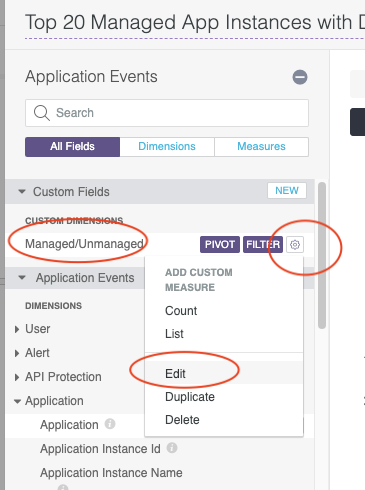
Edit the Custom Dimension called “Managed/Unmanaged”. It’s looking for whether or not the Application Instance Id contains the name of your company. In this case “netskope” is the default company name. If there are multiple instance names/abbreviations that would not be picked up by the contains statement, you’ll need to modify…
Looking for single instance name (default):
coalesce (
if(contains(${app_event.instance_id}, "netskope"), "Managed", "Unmanaged"), "unknown")
Looking for multiple instance names:
coalesce( if(contains(${app_event.instance_id}, "a"), "Managed", "Unmanaged"), if(contains(${app_event.instance_id}, "b"), "Managed", "Unmanaged"), "unknown")
2. Repeat for Top 20 Unmanaged Apps & Instances with Uploads
-
Consider adding the Application Instance Id Dimension to the prior two tiles. When hovering over the bar charts, you will now see the instance names of managed and unmanaged apps.
3. Repeat for Top Managed Apps with Downloads to Unmanaged Devices
4. Repeat for TO DO: Apps that may need to be managed
Under Analyze Risk Section, the next chart needing customization is Top Managed Apps breakdown by Doc Type, External Exposure, and Domain.

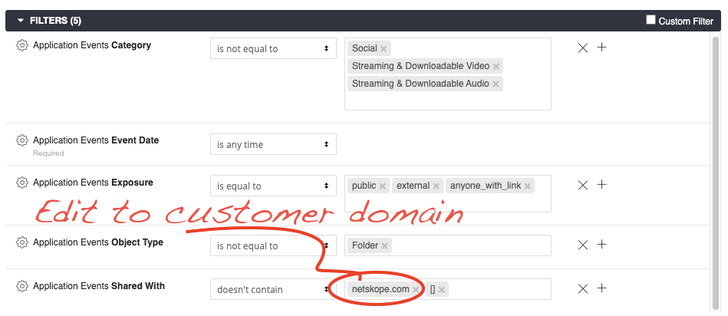
5. In the main Filter to the left, scroll down to “Shared With” and enter in your company domain. There is also a [], leave that one (it helps to clean up junk).
6. In the Protect Data Section, Edit Top 20 Managed App w/Downloads & Data Loss using the same process used for the “Top 20 Managed App Instances with Downloads” & the “Top 20 Unmanaged Apps & Instances with Uploads”.
Any questions/problems/improvements, please let @Steve Johnson know (stevej@netskope.com).


