

This article will walk you through the 3 major types of custom fields in Advanced Analytics and showcase how to use them to address advanced use cases. A sample dashboard is attached to help you better understand the process.
Get Started
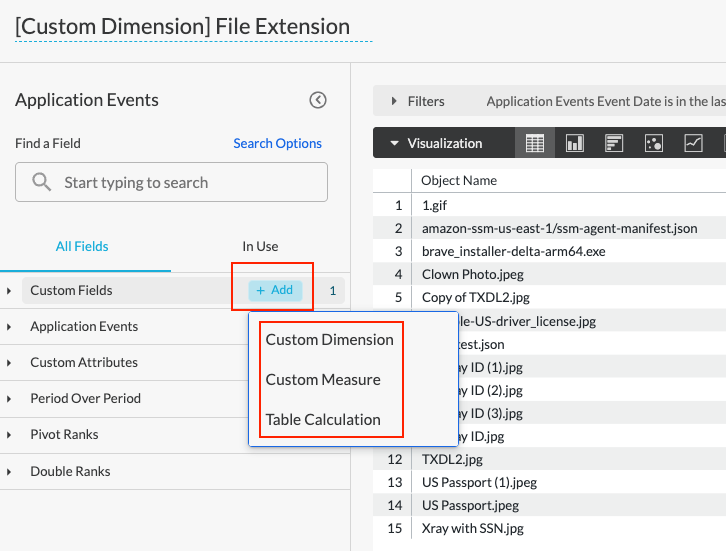
To start creating a custom field, simply click the “+ Add” button next to “Custom Fields.” You will then be able to select from the 3 major types of custom fields: Custom Dimension, Custom Measure, & Table Calculation.
Custom Dimension
Custom dimensions allow you to create new data fields based on the existing data, which provides richer visibility into your environment. A great sample use case is to identify & extract file extensions.
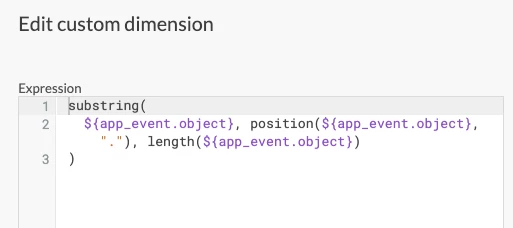
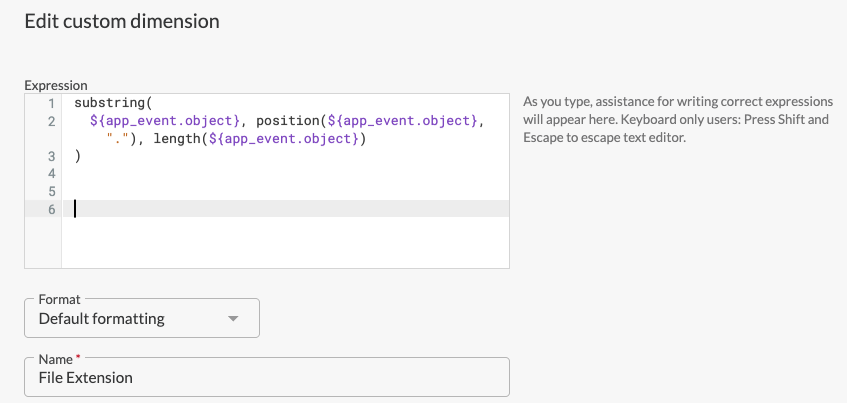
To do this, enter the query below in a new custom dimension.
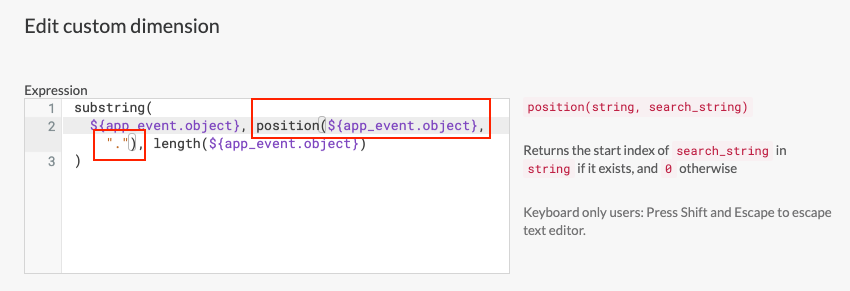
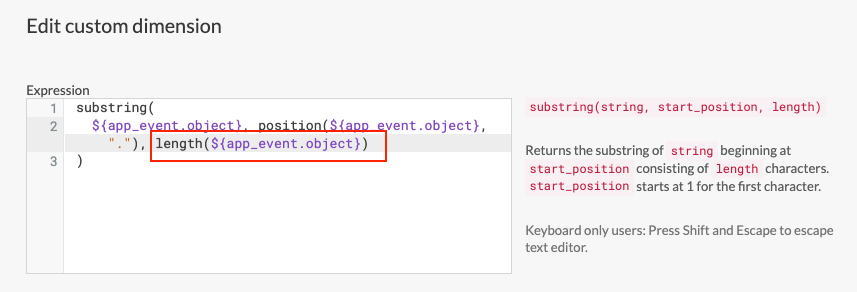
substring(
  ${app_event.object}, position(${app_event.object}, "."), length(${app_event.object})
)
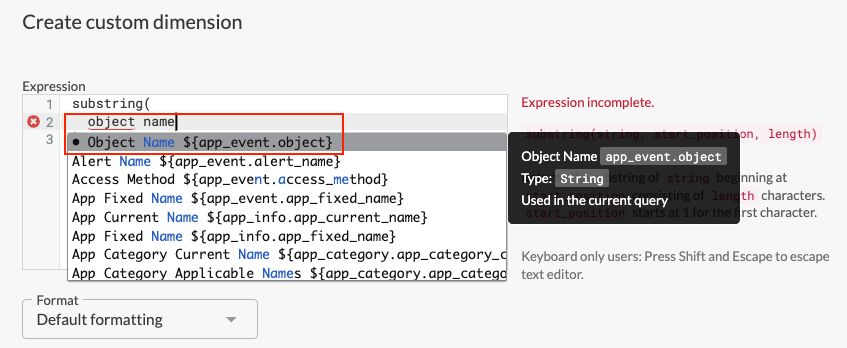
The “substring” command will extract part of the characters from a string. The command requires 3 parameters:
- Target string: This specifies “where” the substring is extracted from. Since we are looking to extract file extensions from file names, the target string here will be “object name.” By entering “object name,” the corresponding field name will show up in the dropdown list. Click it to add it to the query.
- Start position: This specifies “where” the substring starts. Since a file extension usually starts with a dot, we will use the “position” command to identify the start position of the file extension.
- End position: This specifies “where” the substring ends, in other words, the position of the last character. The last character of the file extension is also the last character of the full file name, so we will use the “length” command to identify the end position of this substring.
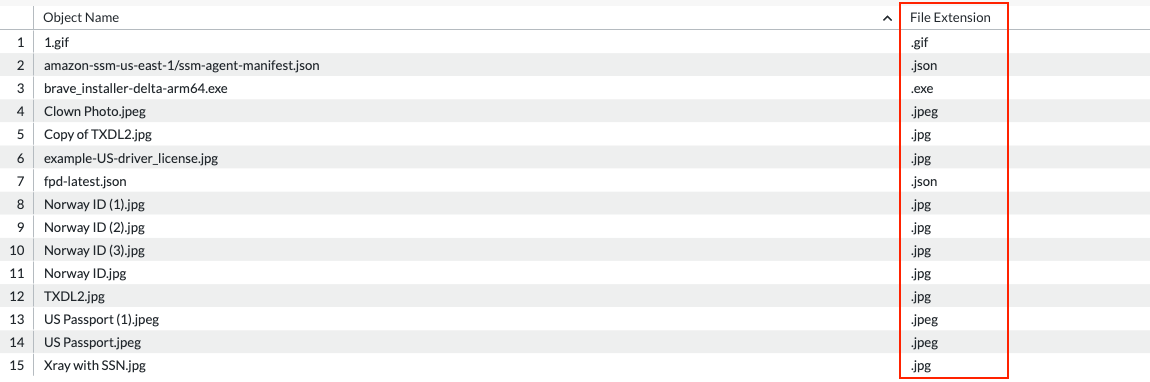
Now, we have successfully created a custom dimension that extracts file extensions.
Another great use case with custom dimensions is to identify user credentials (corporate vs. non-corporate) using the “if” command. The corresponding visual can be found in the sample dashboard.
Custom Measure
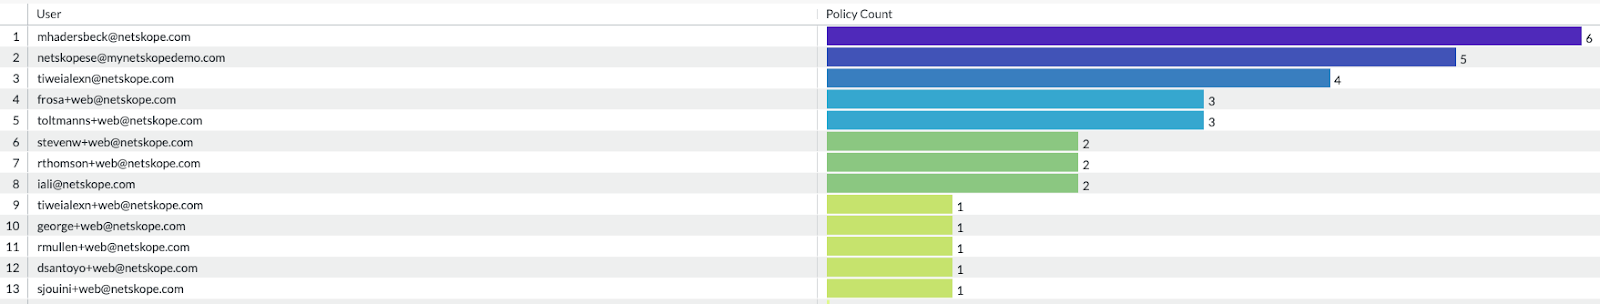
Custom measures allow you to run additional calculations based on the existing data. A great sample use case is to calculate the number of policies triggered by each user.
To do this, simply add “Policy Name” as the “Field to measure” and select “Count distinct” as “Measure type” in a new custom measure. You can also add a filter for particular alert/policy types, e.g. DLP.
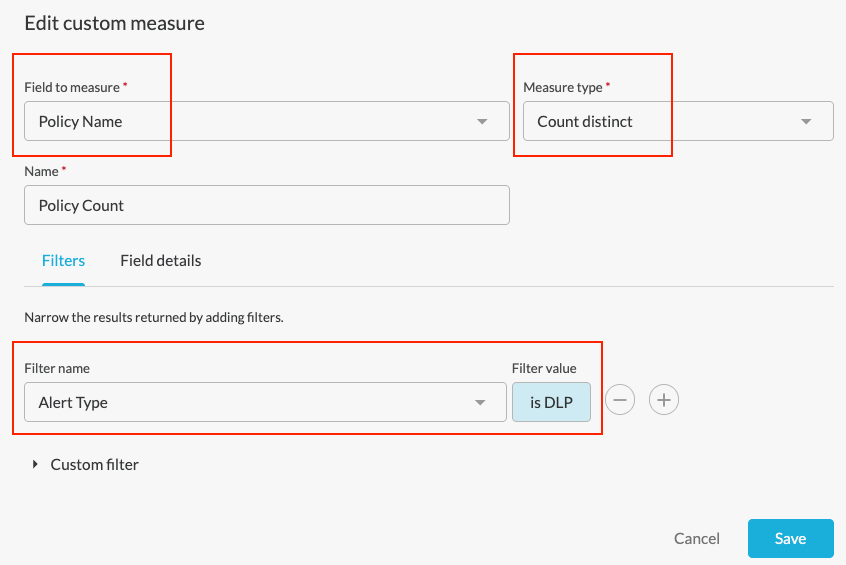
Now, a custom measure that returns the number of DLP policies triggered by each user has been created.
Another great use case with custom measures is to list all policy names for each user. The corresponding visual can be found in the sample dashboard as well.
Table Calculation
Table calculations combine the features of custom dimensions and custom measures, which allows you to perform advanced calculations based on the existing data. A great use case is to calculate the average alert count.
To do this, simply enter the query below in a new table calculation.
mean(${alert_event.event_count})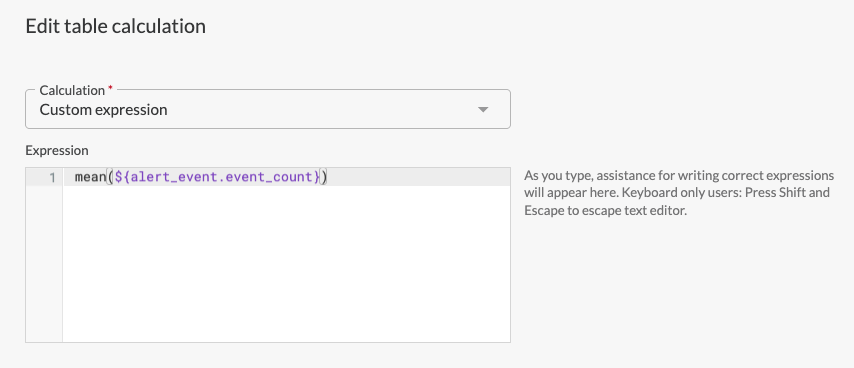
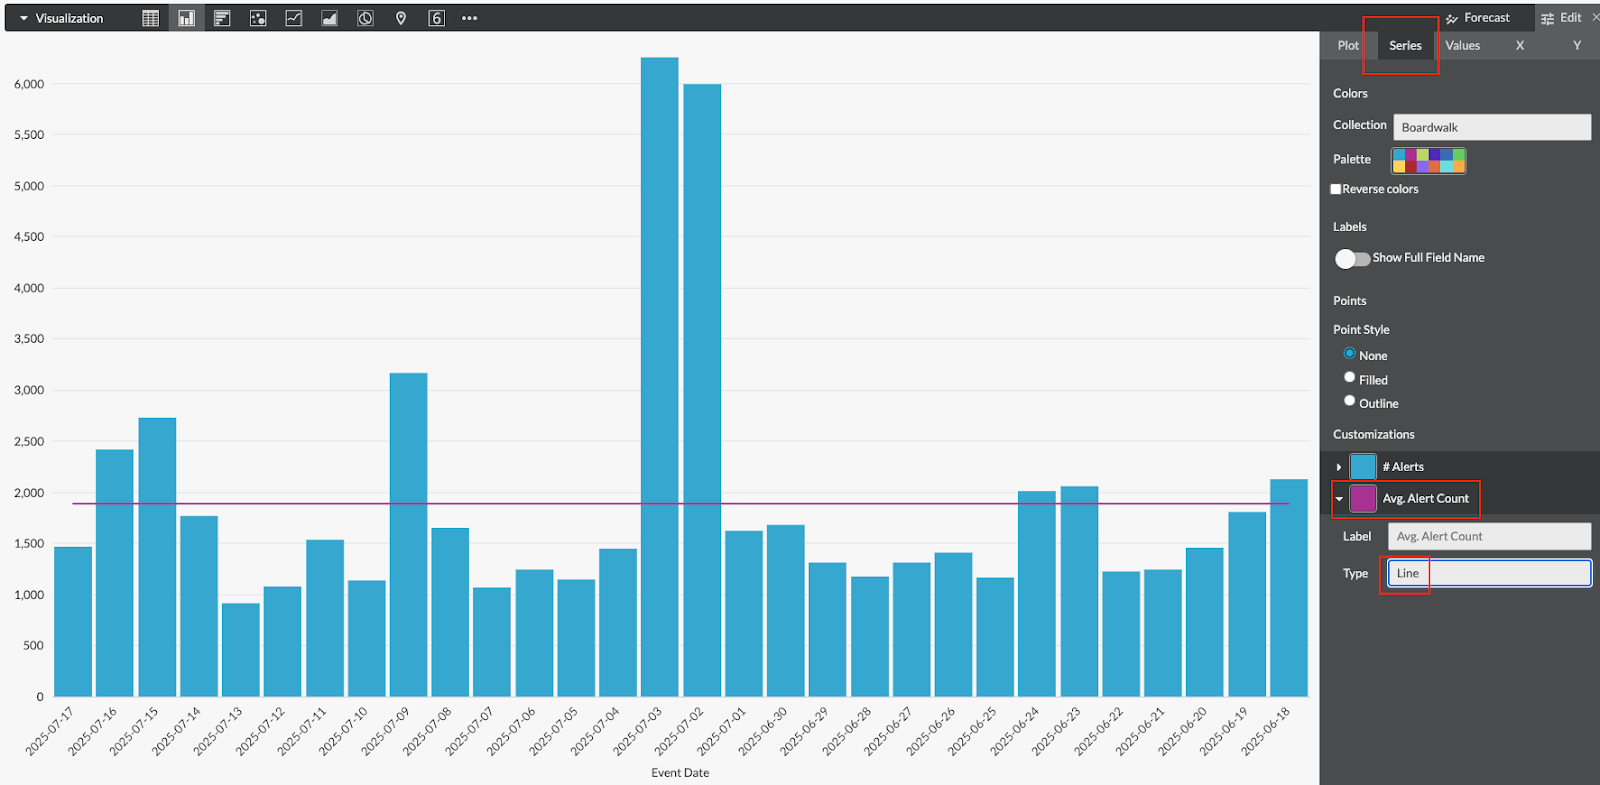
This will create a new field that returns the average alert count based on the existing data. By changing the visual type of this new field to “Line,” a line chart that represents the average alert count will be mapped to the existing visual.
Don’t forget the sample dashboard attached below. Feel free to try this out in your own environment and share your feedback.
Functions and operators supported can be found HERE.


