
Top Allowed & Blocked Websites by User Group & Organization Unit

  • November 27, 2023
  • 10 replies
  • 917 views
Top Allowed & Blocked Websites by User Group & Organization Unit
Aaron_Zhang
Netskope Employee
Forum|alt.badge.img+13


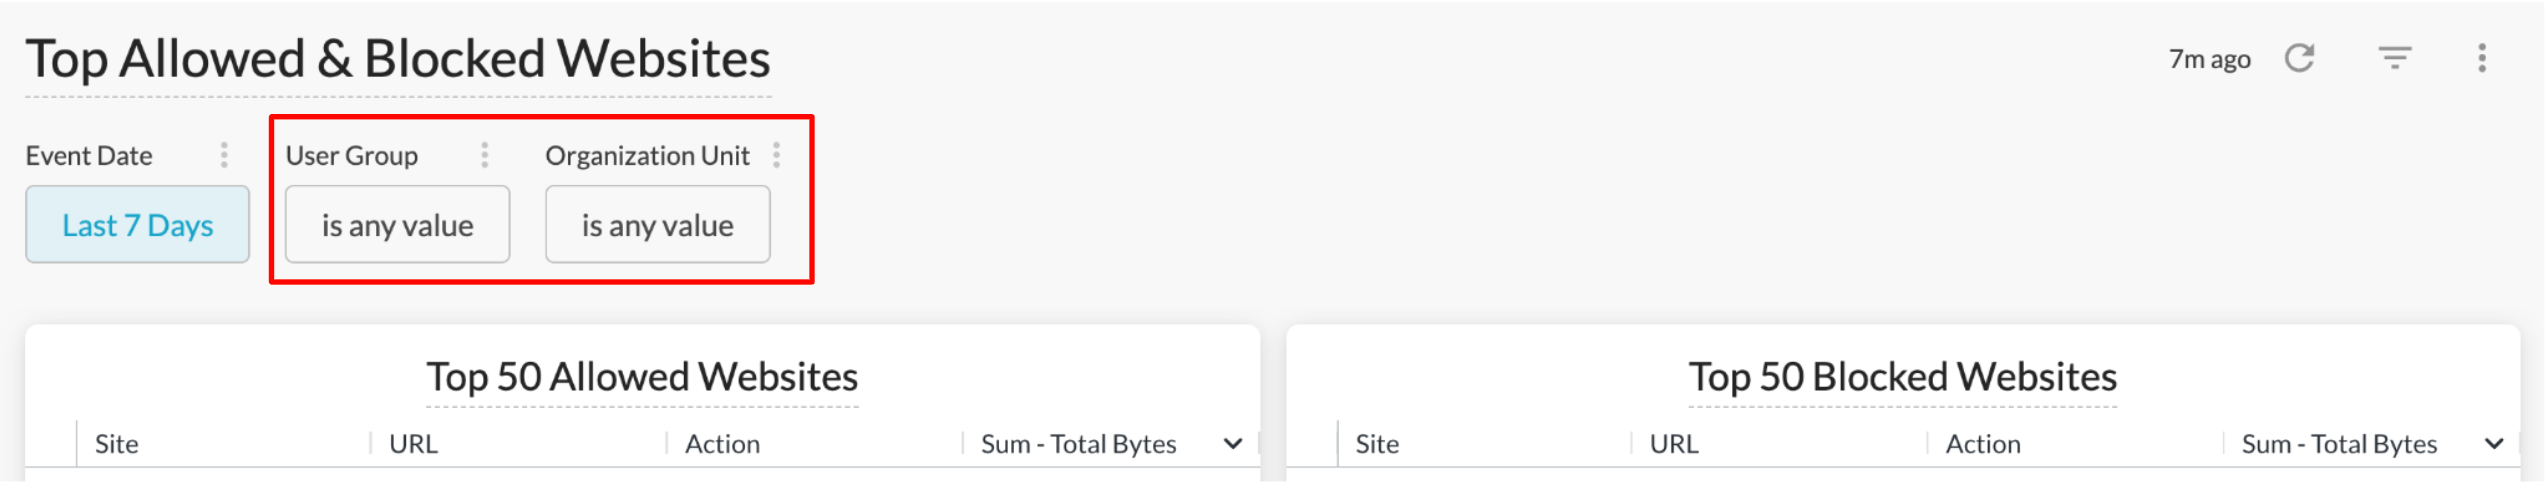
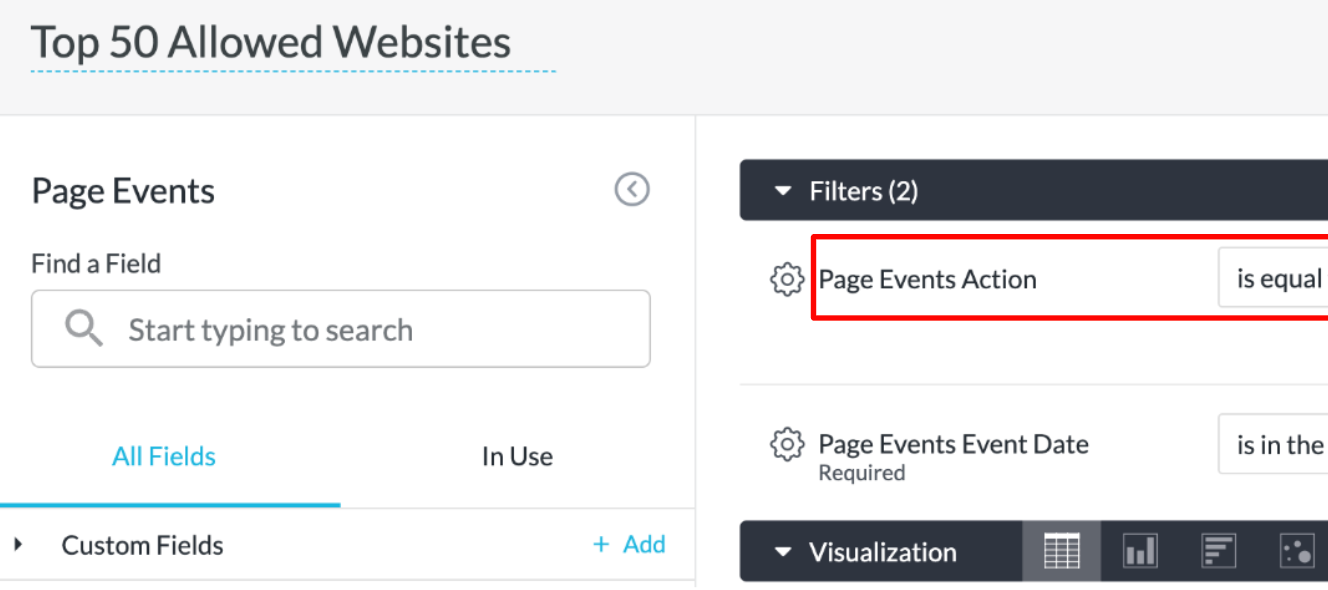
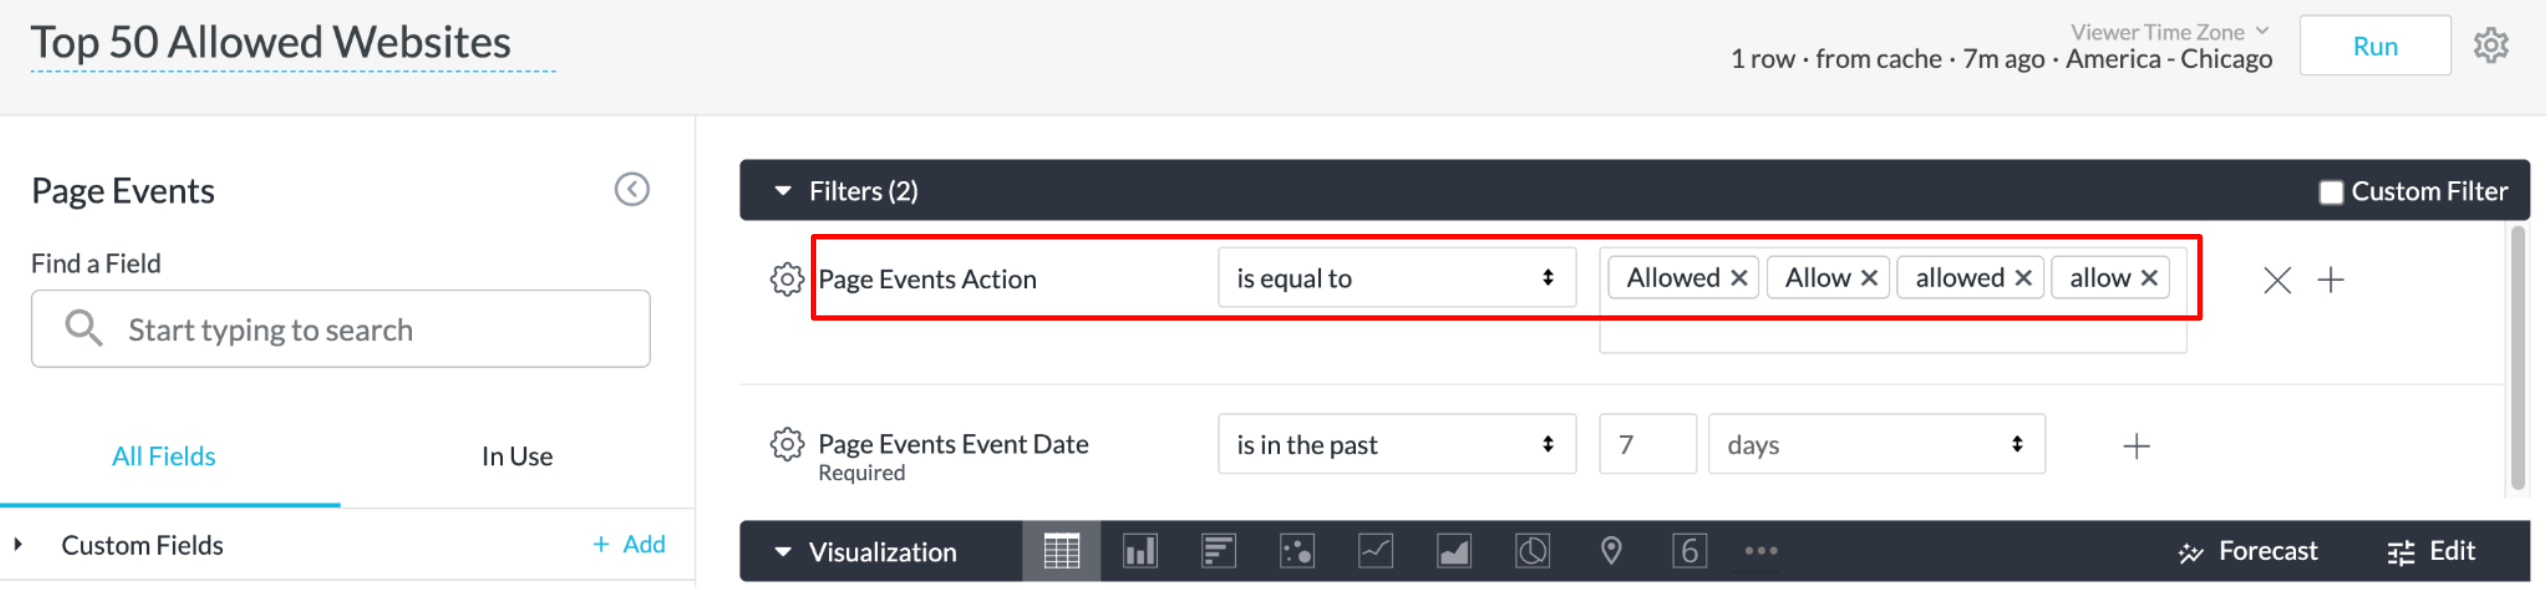
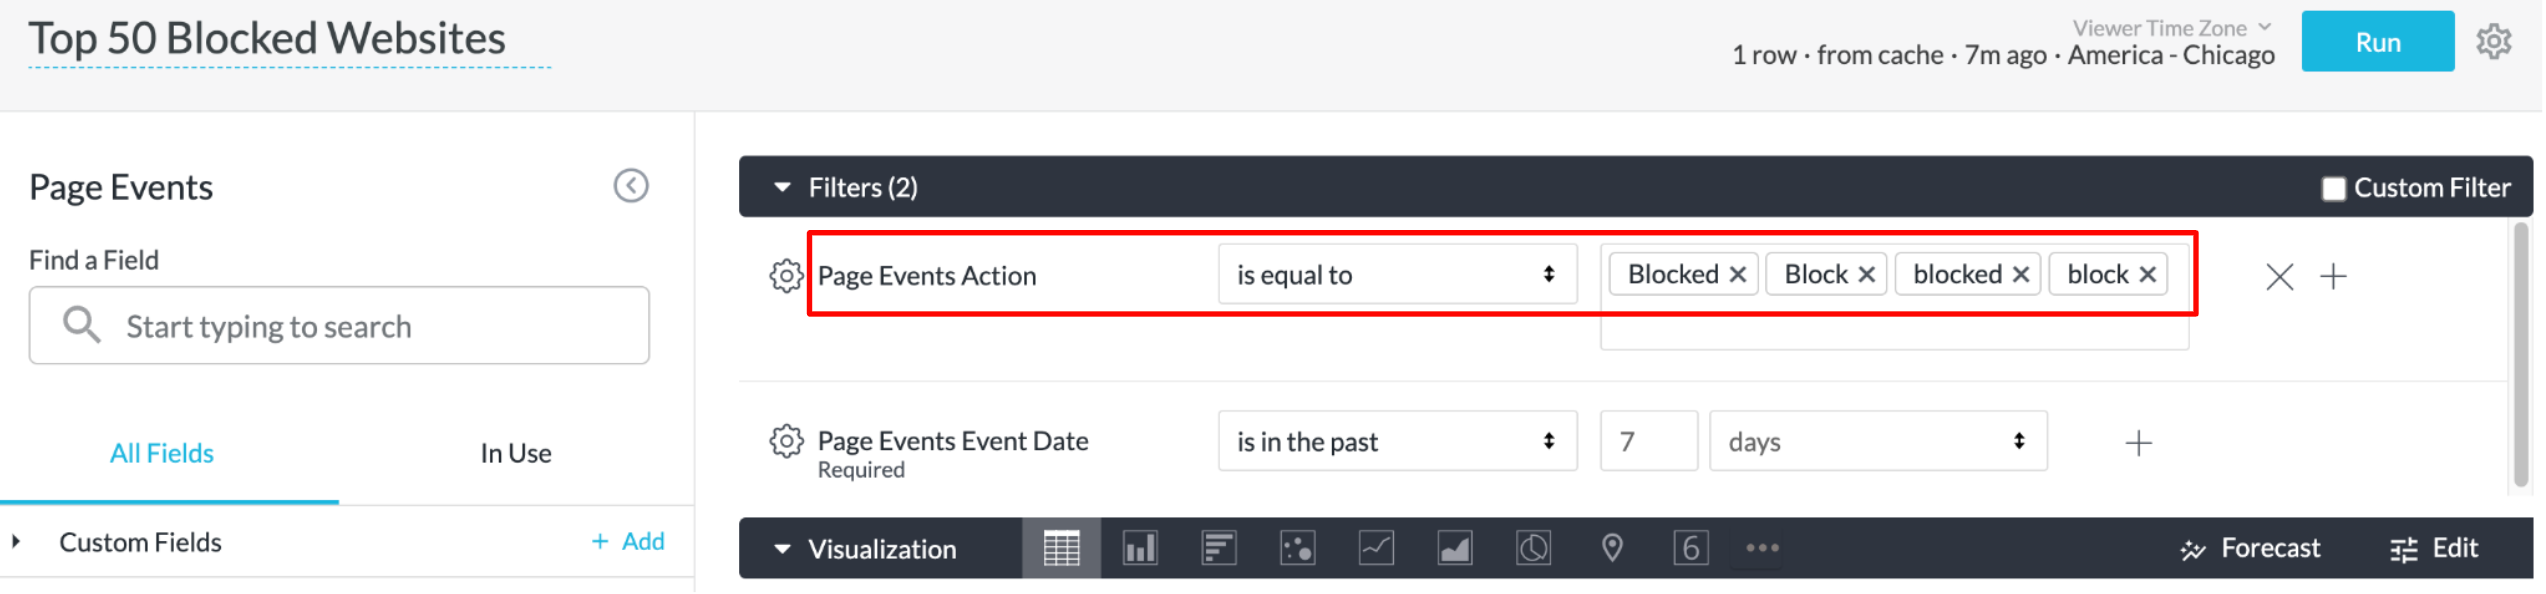
This dashboard provides visibility into top allowed & blocked websites and the corresponding URLs. "Allowed" & "Blocked" are determined using the "Action" filter in each widget, which can be further customized based on your environment. 


The dashboard also includes the "User Group" & "Organization Unit" filters that can be used to target any particular AD groups in your environment. 


10 replies

prajakta.yadav
Netskope Partner

Hi @Aaron_Zhang,


Thank you for this information.


If I create dashboard in similar way for Alerts, how should I segregate for top 10 users?


Aaron_Zhang
Netskope Employee
Forum|alt.badge.img+13
  • Author
  • Netskope Employee
  • October 9, 2024

Hi @prajakta.yadav ,


We can get top 10 users based on alert count. This can be done with the “sort” and “row limit” features. 


E.g. I created a table listing the alert count (# Alerts) for each user (User). To get the top 10 users who triggered the greatest number of alerts, we need to:

  1. Sort the data by alert count in descending order. We can do this by clicking “# Alerts.” A down arrow will show up, which means the data is being sorted by alert count in descending order. 
  2. Set the row limit to 10. We can do this by entering “10” in “Row Limit.”

By following these 2 steps, we can get top 10 users by alert count. Feel free to let us know if you have any other questions.


Best,

Aaron


prajakta.yadav
Netskope Partner

Hello @Aaron_Zhang ,


Thank you!! 


  • New Member III
  • March 10, 2025

Hello Aaron,

This dashboard is not working


Aaron_Zhang
Netskope Employee
Forum|alt.badge.img+13
  • Author
  • Netskope Employee
  • March 11, 2025

Hi ​@milind.sampat ,

Could you please provide more details about the issue?

We have observed that the “Action” field in Page Events is showing “isolate” only, and our teams are investigating this.

If you are facing the same situation, please open a support ticket. Thanks!

Best,

Aaron


cubesecure
Netskope Partner
  • Netskope Partner
  • May 13, 2025

Hi ​@Aaron_Zhang 


Was there any resolution found for this?

Thank you.


Regards

Aj


Aaron_Zhang
Netskope Employee
Forum|alt.badge.img+13
  • Author
  • Netskope Employee
  • May 14, 2025

Hi ​@cubesecure ,

Not yet. Our team is still working on the issue. I’ve escalated this with your feedback. Thanks!

Best,

Aaron


  • New Member III
  • September 16, 2025

@Aaron_Zhang  Still this template doesnt shows data 


  • New Member III
  • September 16, 2025

@Aaron_Zhang  I was looking for the top 30 websites or applications consumed bandwidth from particular source do you have any template for it?


Aaron_Zhang
Netskope Employee
Forum|alt.badge.img+13
  • Author
  • Netskope Employee
  • September 16, 2025

Hi ​@milind.sampat .

For the data loading issue with this dashboard, please reach out to your Netskope account team to open a support ticket so that out support team can help you troubleshoot.

For your use case about identifying the top 30 sites/apps consuming bandwidth from particular sources, the Web Traffic Consumption Insights - Top Contributors Dashboard attached below can help. The dashboard highlights the top domains, apps, and users based on their bandwidth consumption and comes with a “Source Country” filter that allows you to narrow down the results based on particular source locations.