Solved

Advanced Analytics - Using Explore to create a report


Forum|alt.badge.img
  • New Member
  • 4 replies

Hello, I'm new to Advanced Analytics and I'm testing out my first report. I'm creating a simply report which has the following fields:


  • User
  • Netskope Host POP
  • Source IP Address


I'm using Page events under Data Collection.


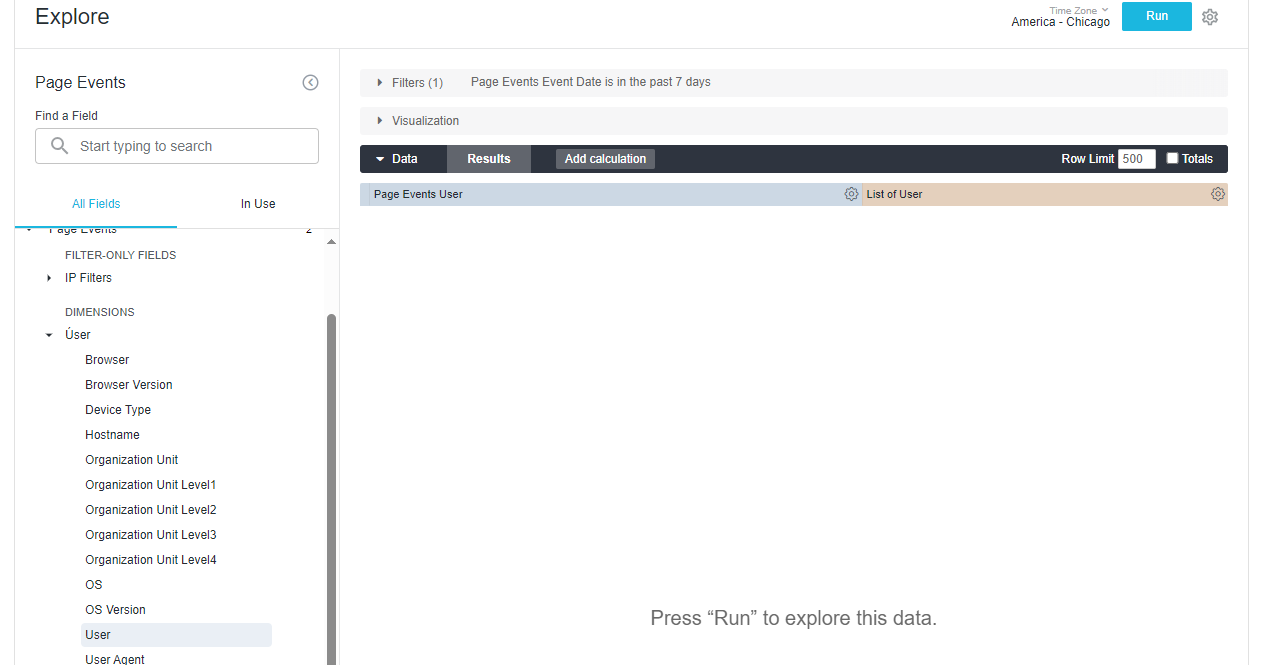
The data shows up in the report, but the issue I'm having is that instead of listing all users in their individual row in the table the report is listing all users in 1 field separated by columns. The same is true for the Source IP Address.


How can I resolve this issue?  

Best answer by qyost

Any chance you're using the "Aggregate -> List of Unique values" for your User field rather than the Dimension itself?


View original
Did this topic help you find an answer to your question?

3 replies

qyost
Forum|alt.badge.img+16
  • Explorer III
  • 146 replies
  • Answer
  • November 27, 2023

Any chance you're using the "Aggregate -> List of Unique values" for your User field rather than the Dimension itself?


Forum|alt.badge.img
  • Author
  • New Member
  • 4 replies
  • November 27, 2023

Thanks for your assistance. You hit the nail on the head !!!!


qyost
Forum|alt.badge.img+16
  • Explorer III
  • 146 replies
  • November 27, 2023

Glad to help.   I had to ask a couple weeks ago how to get the formatting you stumbled into.  😆


Reply


Cookie policy

We use cookies to enhance and personalize your experience. If you accept you agree to our full cookie policy. Learn more about our cookies.

 
Cookie settings