Facing challenges on the NPA report, not able to see how many active users are connected. Is there any options o create the dashboard for npa traffic 

We have 3 ways to look at this data.


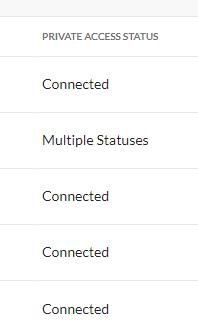
1. Under Settings> Security Cloud Platform > Devices - you could export in CSV and look for a column named Private Access Status which will tell you users connected to NPA


2. SkopeIT>> Network Events capture all the NPA related events and this data can be exported in CSV


3. In Reports, you could add widgets and scope the events as Network Events and pull report with Top Users/Top Applications etc


4. We can also pull NPA details using RESTAPI since we support Network Events(NPA)


We also have some pretty good NPA related dashboards in Advanced Analytics, please request a trial with your TSM or SE


Please let me know if this helps.


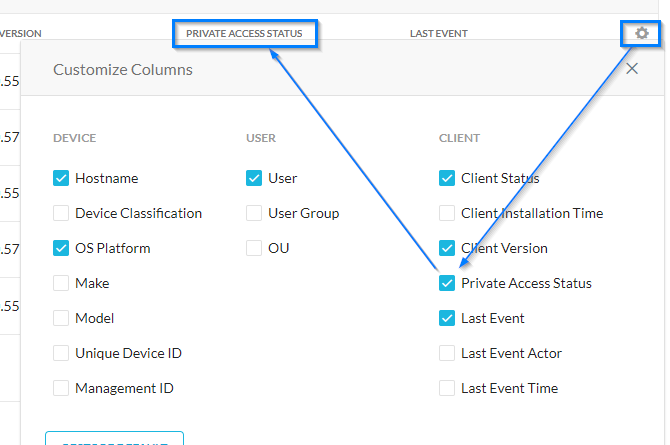
Further to Kishore's #1:


You can add "Private Access Status" to your Devices view


Hi Kishore, 

Thanks for the update. Yes I'm aware about the exporting the data through csv format but you can't see the current  active user session count.  In that report we will get when the traffic is passed and who connected. I'm looking for centralized dashboard to see the active session. Even not able to see the private app dropped traffic


Any update?


@jspmsc The Netskope Advanced Analytics is not a real-time view of your data. @rkessler gave you the best current way of viewing device status of your connected users. For dropped traffic, NPA drops all traffic except what is specifically allowed or block via the inline policy rule. The purpose of providing a block action in policy is typically so you can provide popup messages to the end user vs. the default of silently blocking.


Reply