


Hello Folks,
Below you will find a recap of questions asked at the office hours sessions last week and those sent in that we were not able to cover at the session. Feel free to comment and continue the discussion, as well as attend future sessions that can be found on the Community Events calendar!
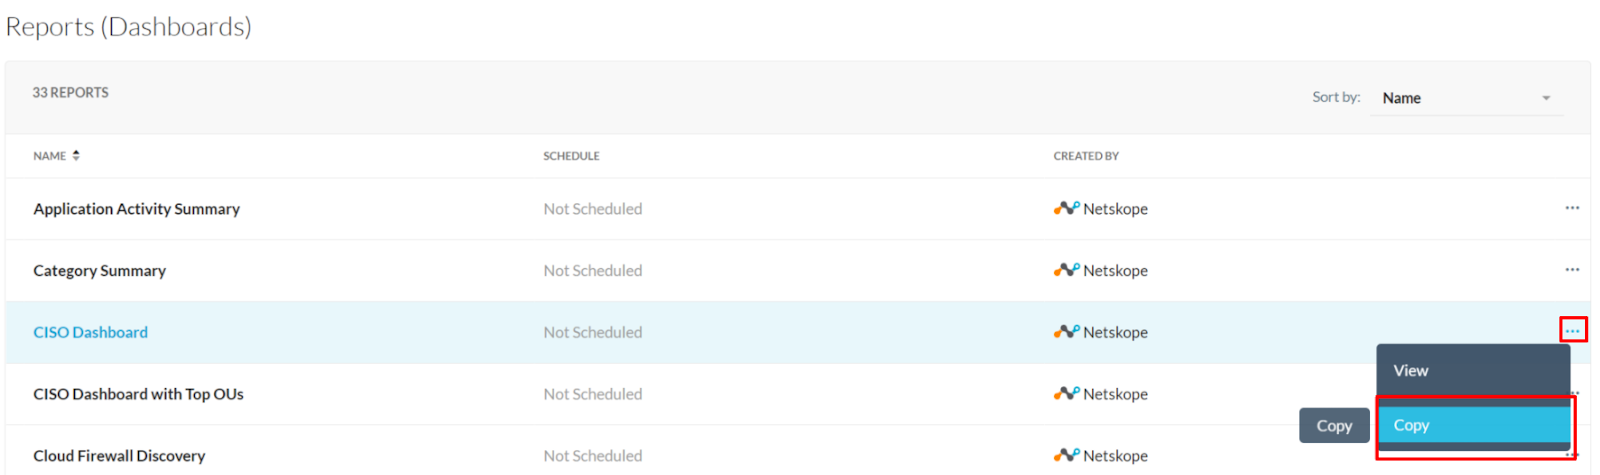
Q: How can I start to edit/customize a dashboard?
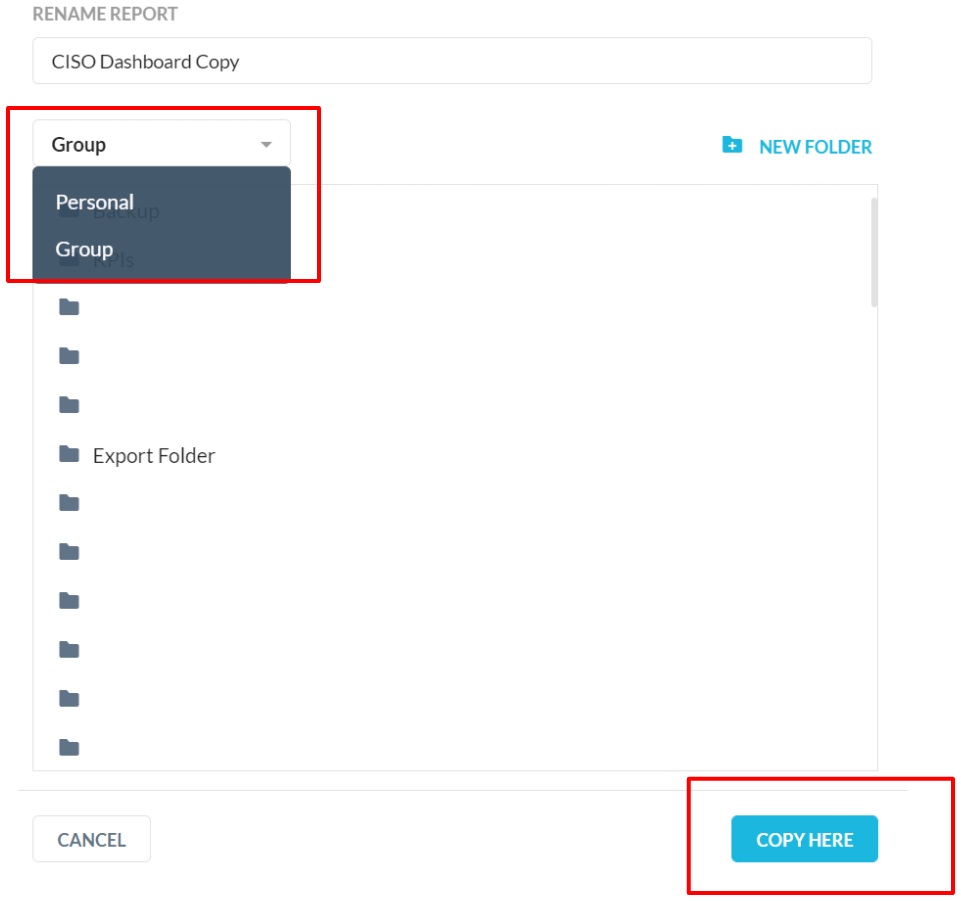
A: Before customizing a dashboard, please copy and save the dashboard to your personal or group folder. To do this, click on the 3-dot button and then hit “Copy.” You can then select the destination folder with the dropdown menu (personal/group). By hitting “COPY HERE,” the dashboard will be saved to your selected folder. You can then find and start to edit the dashboard.
Q: What reports can be used to show executives a summary of cloud usage, threat, and risk assessment, etc.?
A: “CISO dashboard” and “Cloud Risk Assessment - QBR” dashboard are 2 good options. You may also use the “Industry Benchmarks” dashboard to provide a comparative analysis of Netskope operational metrics between your environment and industry peers. All these dashboards can be found in Netskope Library section of Advanced Analytics.
Q: What is the Period over Period filter? How does it work?
A: Period over Period filter shows the difference between data from 2 different periods. To apply this feature, you need to select a timeframe and a particular reference date via the dashboard level filters. Details can be found here: https://www.youtube.com/watch?v=XP_qhKncKuA&list=PLoCX2twqHg72m7Cds9C_FKV5_9G2ZjnYH&index=23
Q: I changed the dashboard level filter at the top. Why does the visual still remain unchanged?
A: The dashboard level filter may only apply to selected widgets. If the widget has no dashboard level filter applied, the visual will not change with the filter. More information can be found here: https://www.youtube.com/watch?v=Rs7PI_wgD-4&list=PLoCX2twqHg72m7Cds9C_FKV5_9G2ZjnYH&index=8
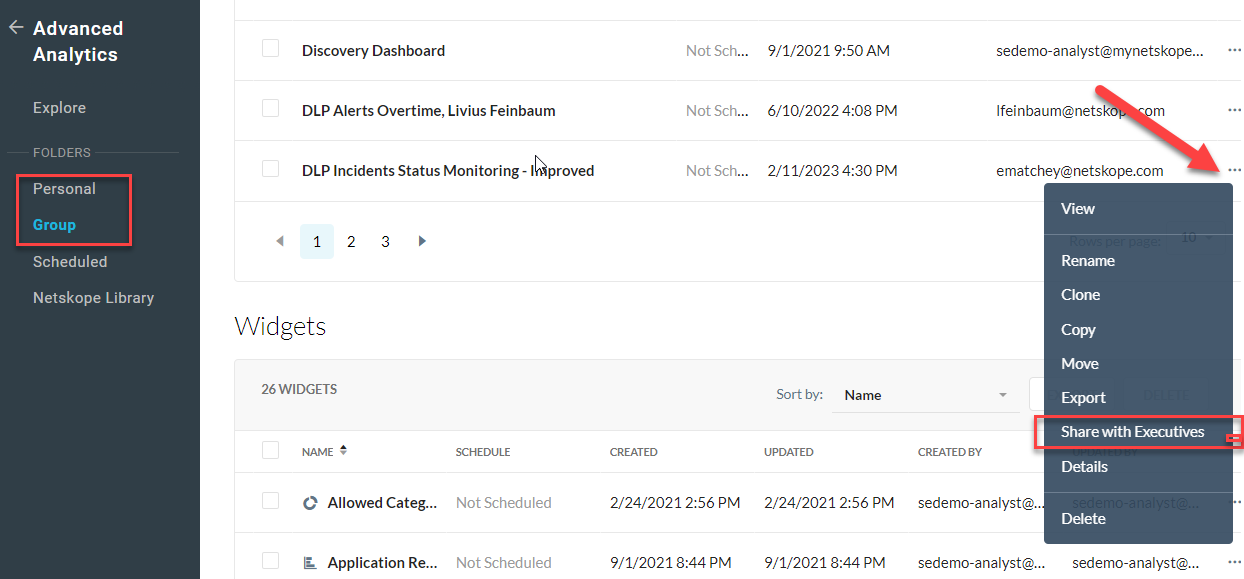
Q: I don’t like the PDF export since it’s not interactive. Are there any other ways to share the dashboard with executives so that they can also play around with it?
A: Find the dashboard in your folder. Click on the 3-dot button on the right and select “Share with Executives.” You can then enter the receiver’s email address and set an expiration date. By doing so, the receiver will be granted temporary access to the dashboard.
Q: Are there any existing dashboards that can be used to view data regarding particular users?
A: The “User/Organization Unit Summary” dashboard in the Netskope Library can help you with this. Alternatively, you can import the “User Activities in Non Work-Related Categories” dashboard available out in the community to understand user productivity.
https://community.netskope.com/t5/Advanced-Analytics-Dashboard/Non-work-Activities-by-Users/ba-p/2186. For more information about how to import dashboards from community, please check our instructional video here: https://www.youtube.com/watch?v=z1ZxsKbK6Z4.
Q: Are there any existing dashboards showing data regarding policy hits and responses to user coaching?
A: The Coaching Policy Dashboard, in Netskope Library of Advanced Analytics, can help you with this. The dashboard will show you trends, the number of users who triggered the policy, their behaviors (proceed/stopped), and their justifications.
Q: Can I give read-only access to certain departments or certain folders?
A: It’s not possible to provide folder by folder access. Advanced Analytics provides general read-only access. We recommend leveraging the “Share with Executives” feature to share dashboards for this use case.
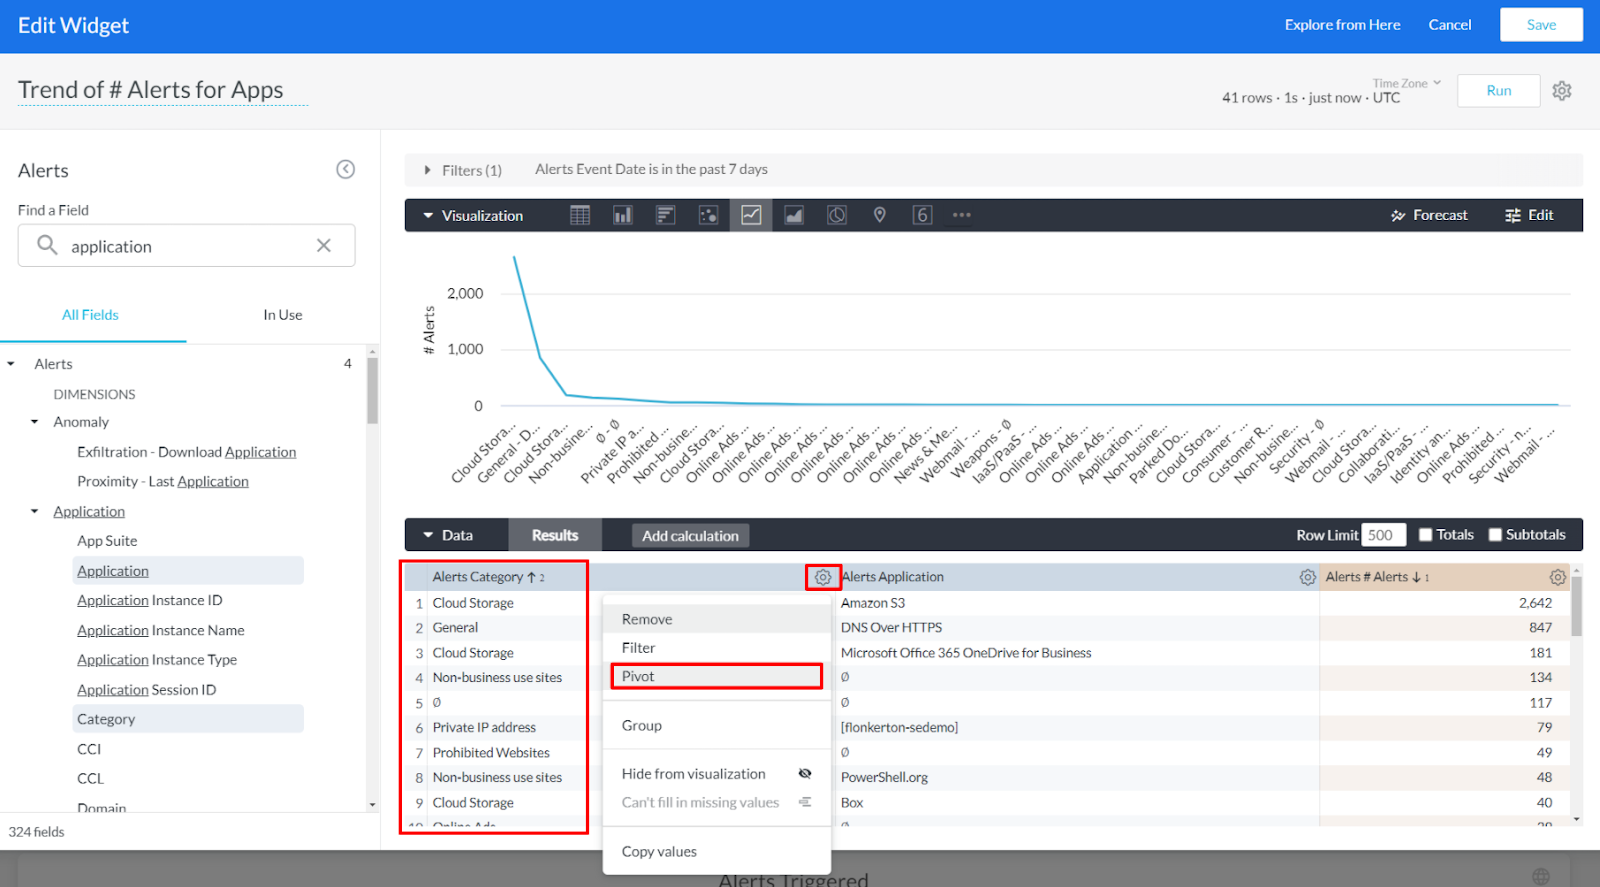
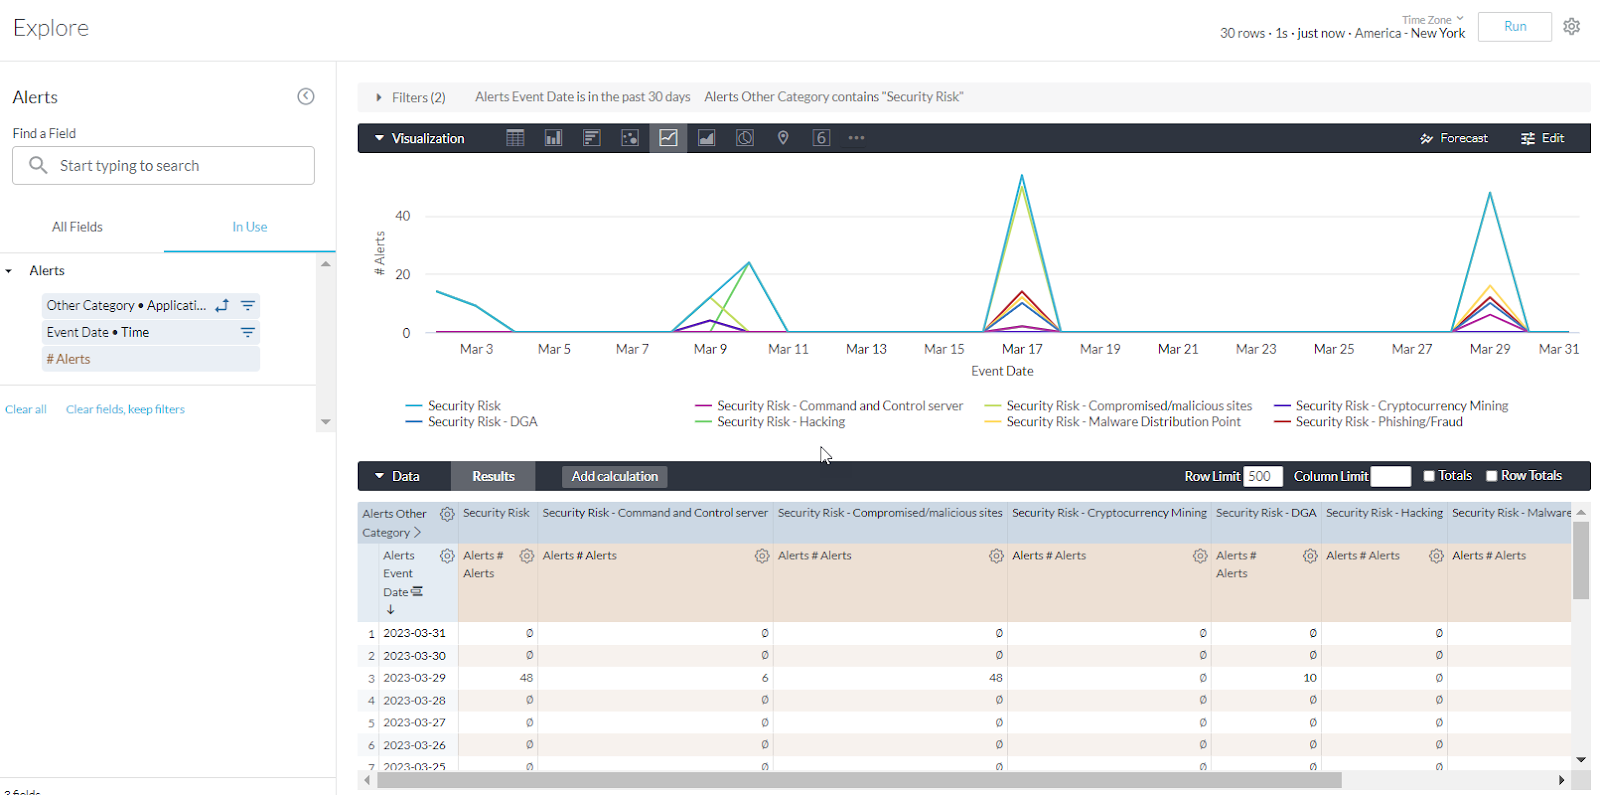
Q: How can I see the trend of alerts for apps from different categories (e.g., security risk)?
A: Start with the Explore section of Advanced Analytics. Select “Alerts” from the Data Collection section in the upper right hand side of the window. Once the Explore window refreshes, set it up as shown in the screenshot below.
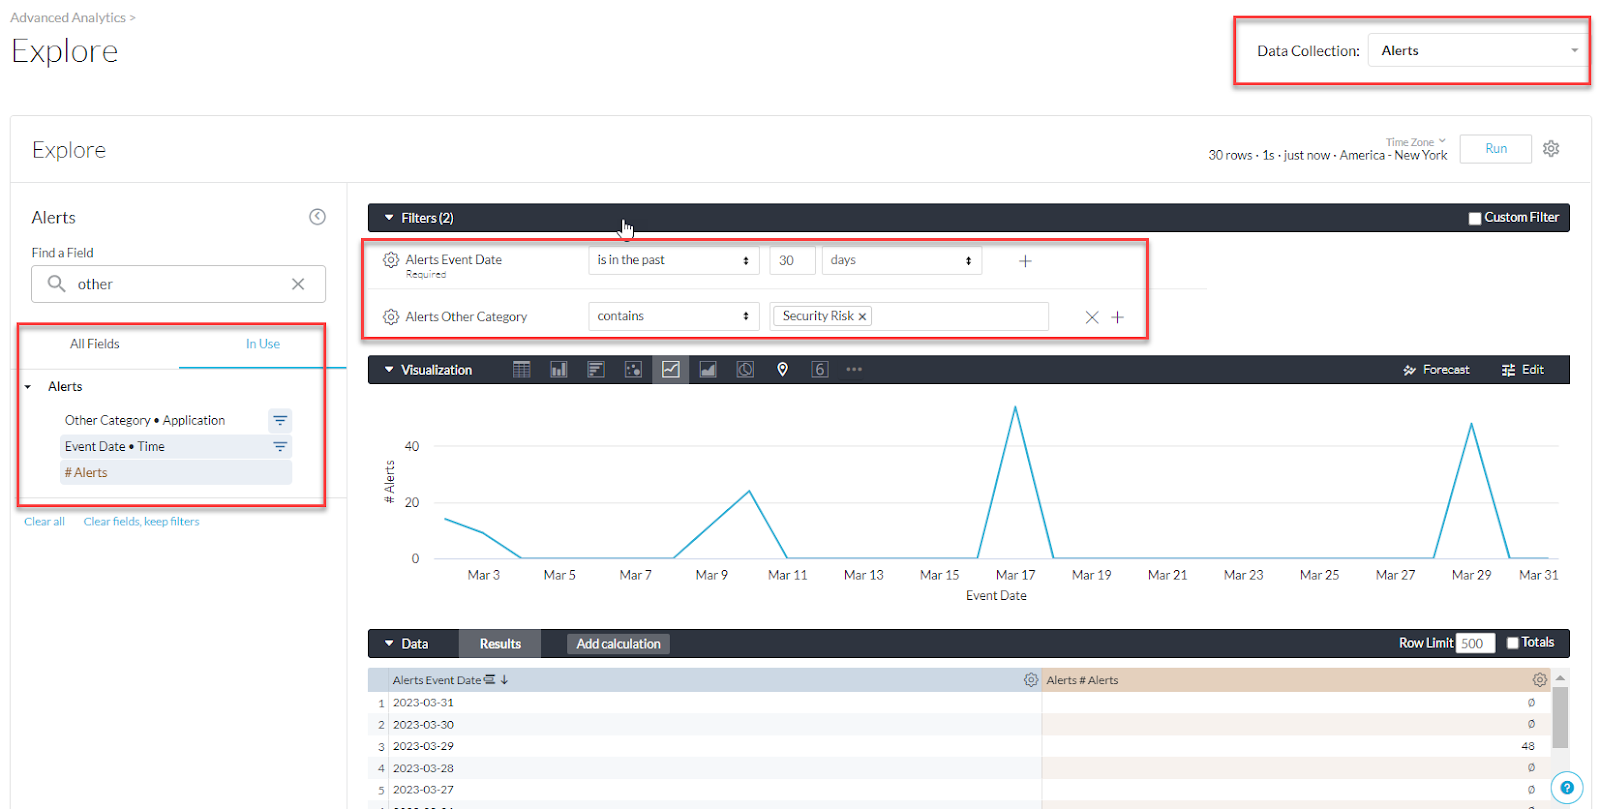
(Optionally)
“Pivot” will help you with this by segmenting the data into particular categories. In the widget edit mode, click the gear button and then hit “Pivot.” The visual will show you the trend of alerts by different application categories. Details can be found here: https://www.youtube.com/watch?v=N0nGDgiuSpI&list=PLoCX2twqHg72m7Cds9C_FKV5_9G2ZjnYH&index=11
Q: Netskope recently enabled localization zones including IP data for different regions/countries. Can I get visibility of this feature in Advanced Analytics?
A: Unfortunately, no. At this time, Advanced Analytics has no data on this feature. Our account team has filed enhancement requests to address this need.
Q: What is the best way to view and prioritize risky apps in the environment?
A: The “Tag Applications and Instances” dashboard can be a good choice. We recommend looking at data movement, usage, activity, and pairing that with the biggest risk in your environment. The dashboard can be found in Netskope community: https://community.netskope.com/t5/Advanced-Analytics-Dashboard/Tag-your-applications-and-instances/ba-p/2424. For more information about how to import dashboards from the community, please check the instructional video here: https://www.youtube.com/watch?v=z1ZxsKbK6Z4.
Q: I want to reduce my industry benchmark scores. Do you have any recommendations?
A: The “Industry Benchmarks” dashboard, which is available in the library, can be a great starting point. To reduce the application risk score, we recommend marking managed apps and reducing (or even blocking) risky unmanaged apps in your environment. To reduce the user risk score, it can be helpful to refine your UEBA policies. It’s a good idea to follow best practices listed at the bottom of the dashboard. Please keep in mind this is only a percentile ranking, and your ability to impact this may be limited.
Q: How to better operationalize using advanced analytics?
A: Operationalization means different things depending on product, use case, and your top needs. Below you can find some common operationalization topic and Advanced Analytics dashboards to address these.
- Tag your Applications and Instances: One of the first recommendations when starting to leverage the Netskope platform is to identify corporate/IT-managed applications and instances. This is important to do before writing policies to control traffic. For example, upload of data (sensitive or not) is probably ok when it is going to corporate applications and instances. Alternatively, uploads to non corporate applications and personal instances should be monitored and controlled for sensitive data movement. Use the dashboard at the link below to enable you identify your corporate apps and instances. BAsed on this information, tag them in the Netskope UI. https://community.netskope.com/t5/Advanced-Analytics-Dashboard/Tag-your-applications-and-instances/ba-p/2424
- Evaluate and Tune SSL Decrypt Bypasses: Use the “SSL Decrypt Policies” dashboard available at the link below to understand how much traffic is being bypassed for SSL decrypt. Using this information, tune the settings/policies to only bypass what is needed. https://community.netskope.com/t5/Advanced-Analytics-Dashboard/Tune-Bypasses-using-the-SSL-Decrypt-Bypass-Dashboard/ba-p/3830
- Tune DLP Policies: Use the “DLP Policies” dashboard to identify noisy DLP policies and identify the source of noise to tune the policies.
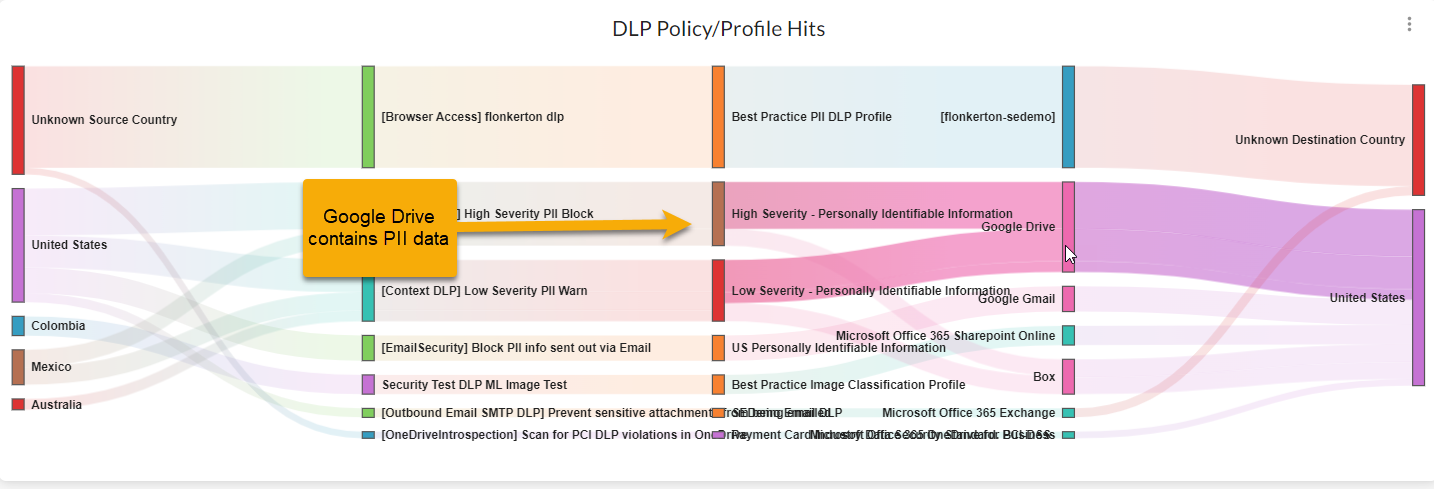
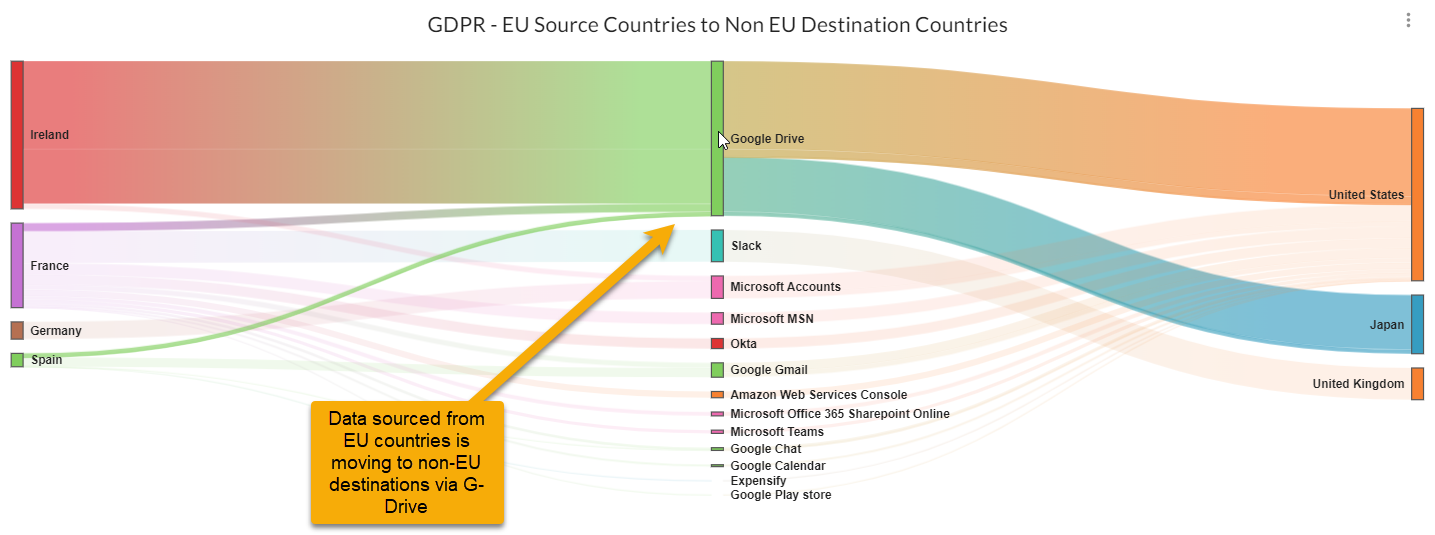
Q: How can Advanced Analytics be leveraged for compliance reporting?
A: Leverage the “Data Protection Dashboard” and the “GDPR Dashboard” for compliance related reporting and analysis. An important topic in compliance is understanding which systems are in or out of scope for compliance adherence. Systems containing PHI, PCI, PII need to be controlled in specific ways, systems without this sensitive data do not have the same requirements. Advanced analytics dashboards can be used to understand which applications contain sensitive data, where that data is moving, and how it is being controlled.
Q: What is the best way to view and prioritize risky apps in the environment?
A: Use the “Tag your App” dashboard described in a previous questions above. The dashboard can be found here. https://community.netskope.com/t5/Advanced-Analytics-Dashboard/Tag-your-applications-and-instances/ba-p/2424


