


Netskope Global Technical Success (GTS)
KB - Advanced Analytics - Customizing 'out of the box' dashboards
Netskope Cloud Version - 126
Objective
Explain briefly how to customize an ‘out of the box’ AA Dashboard
Prerequisite
Netskope Advanced Analytics entitlement
Context
There are several predefined Advanced Analytics dashboards that can be used immediately to have visibility into important insights, those can be customized by adding/removing dimensions, measures, and other fields.
Procedure
It’s important to clarify that predefined dashboards can’t be edited directly, they need first to be copied to another location to be able to edit them.
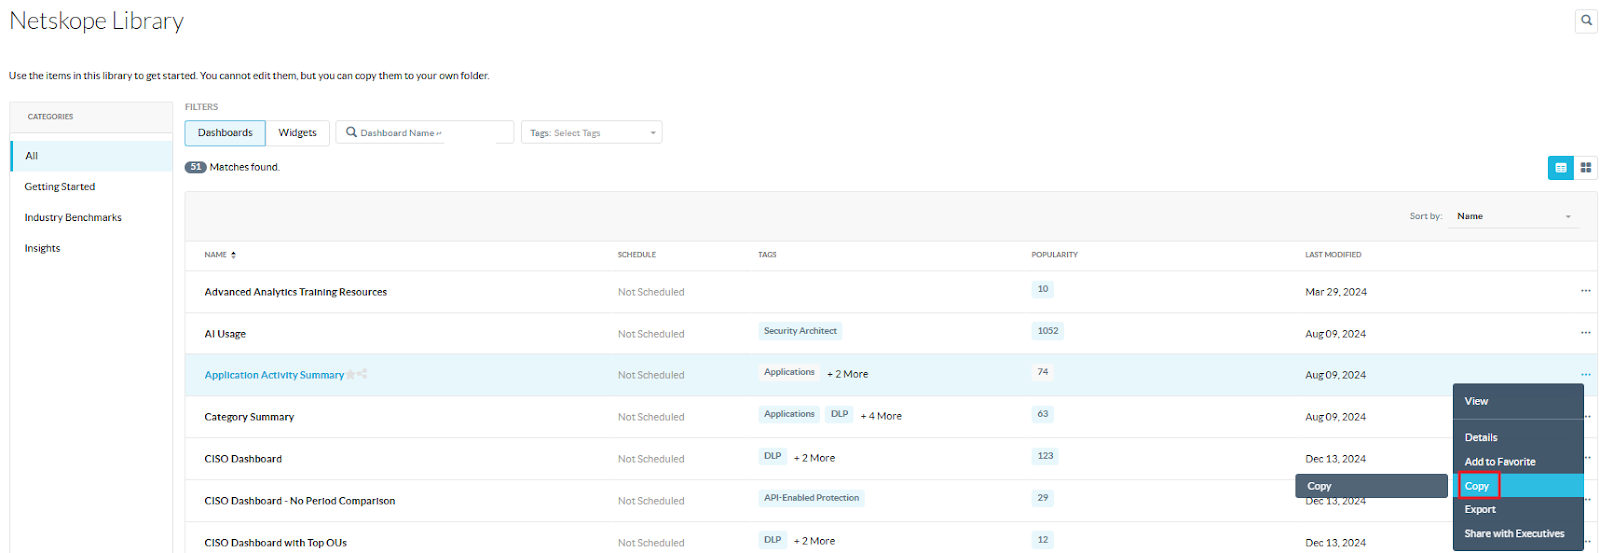
- Go to Advanced Analytics - Netskope Library and select the desired Dashboard (Application Activity summary in this example). Click on the the 3 dots to the right and select ‘Copy’
- Rename the report and select the folder where you want to place the copied Dashboard and click save
- Go to the folder where you have copied your Dashboard and click on it, once there you’ll be able to edit it, to do so simply go to the 3 dots on the top right corner and select ‘Edit Dashboard’
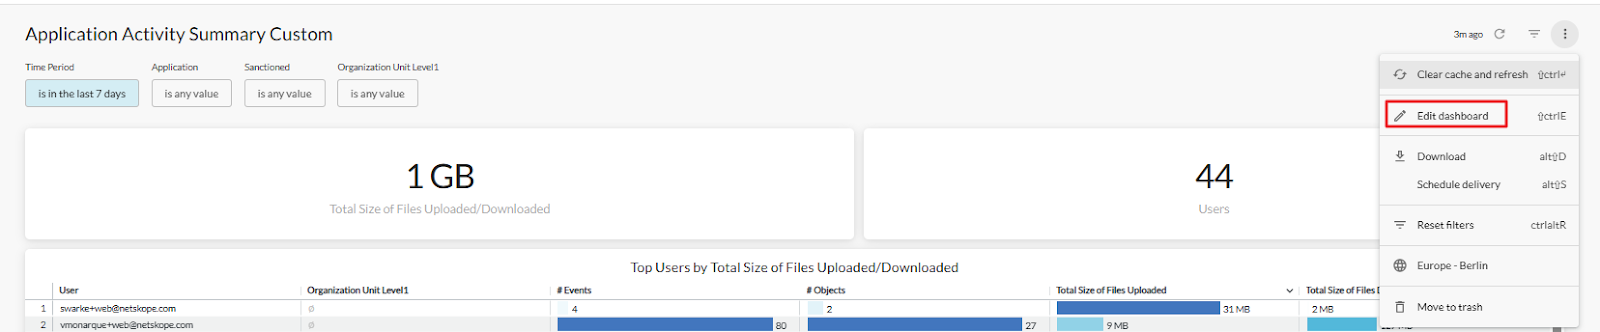
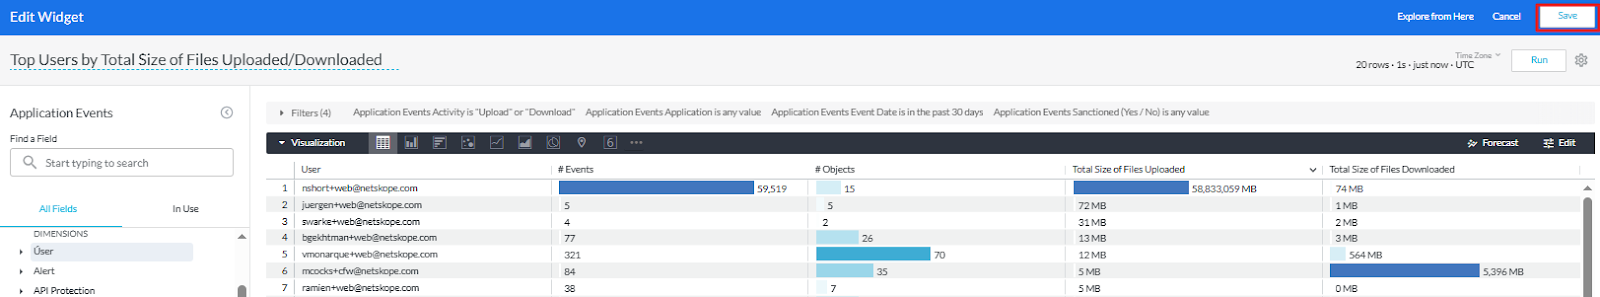
- Now you are in edit mode which allows you to edit widget by widget. Select the widget you want to edit and follow the same process by clicking on the 3 dots located on the top right corner of the widget

- From this view you can perform several actions, some examples are:
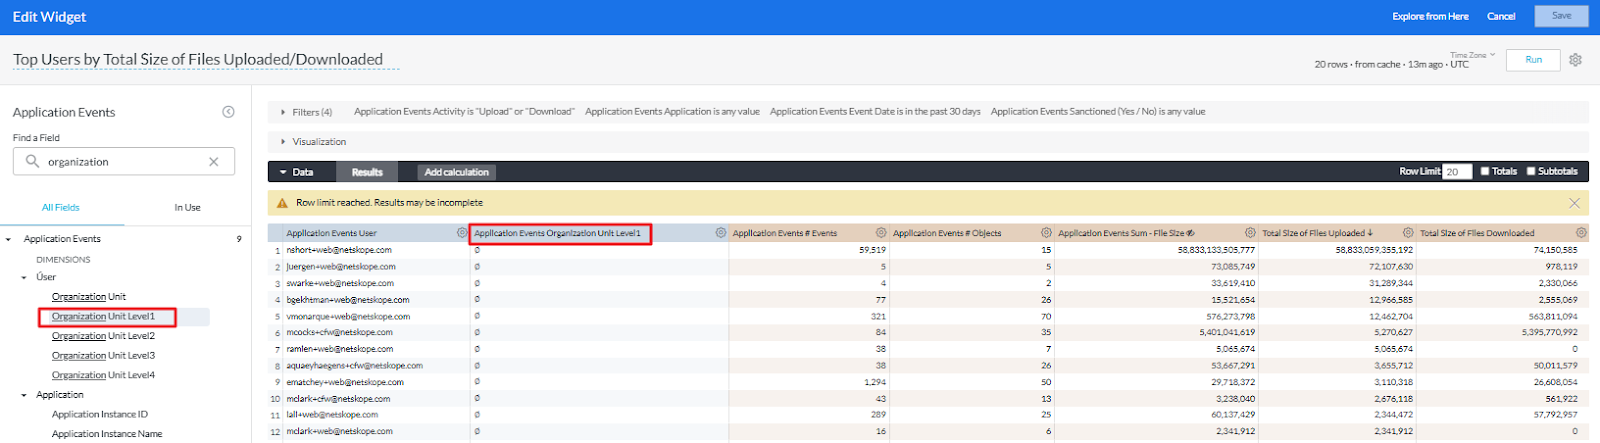
- Remove a dimension: You have 2 options to do so:
- By clicking the field on the left: Let’s say we are going to remove “Organization Unit Level 1” dimension.
- Remove a dimension: You have 2 options to do so:
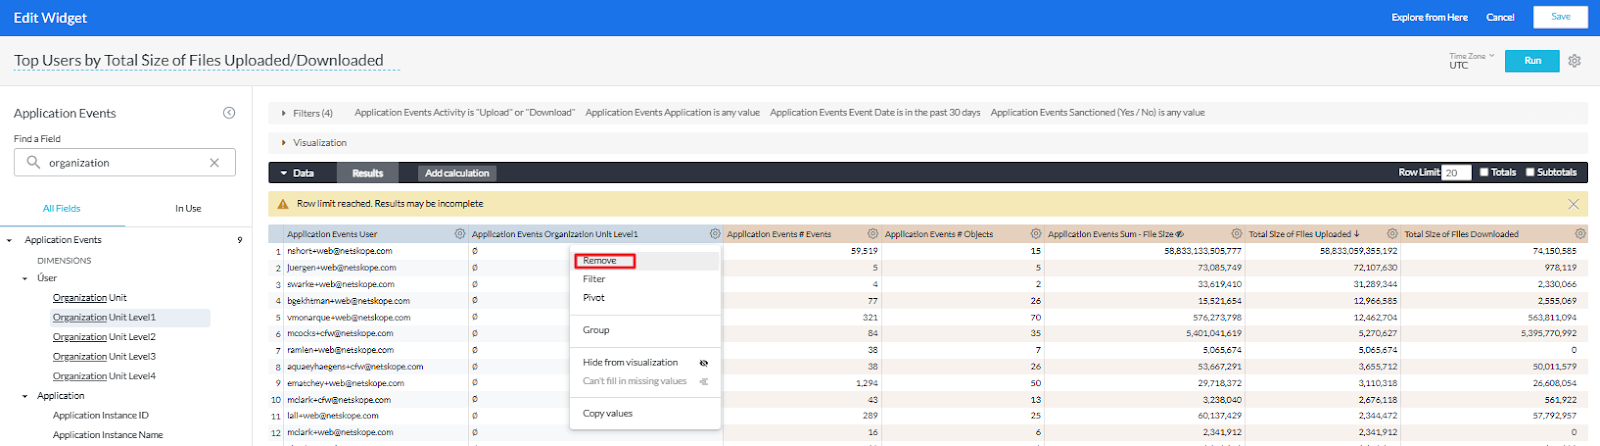
- By clicking on the gear next to the field in the Data section and selecting ‘Remove’.
- Add a dimension: Locate the dimension on the left panel and simply click on it, it will be added to the Data section
- Apply or remove filters: Unlike the above steps, the filters are displayed in the filter section.
- To remove a filter simply click on the X next to it
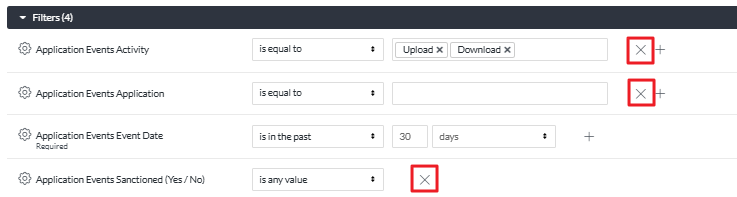
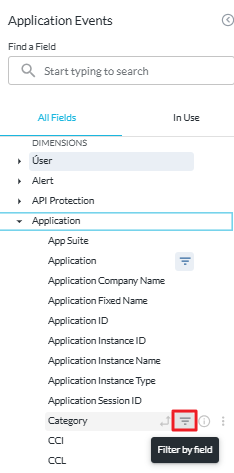
- To add a filter click on the funnel icon next to the dimensions on the left panel
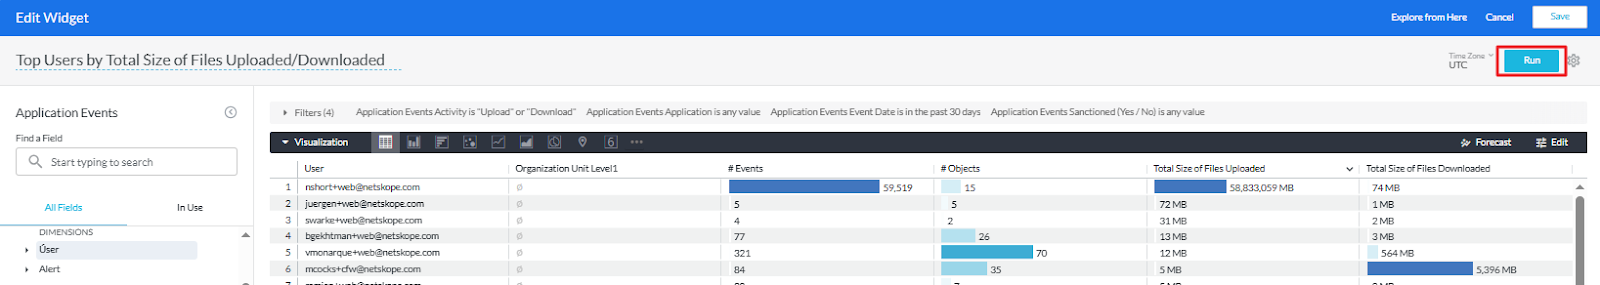
- The visualization section shows a preview of the dashboard. Please remember to click the ‘Run’ button on the top right to update the data:
- Before update:
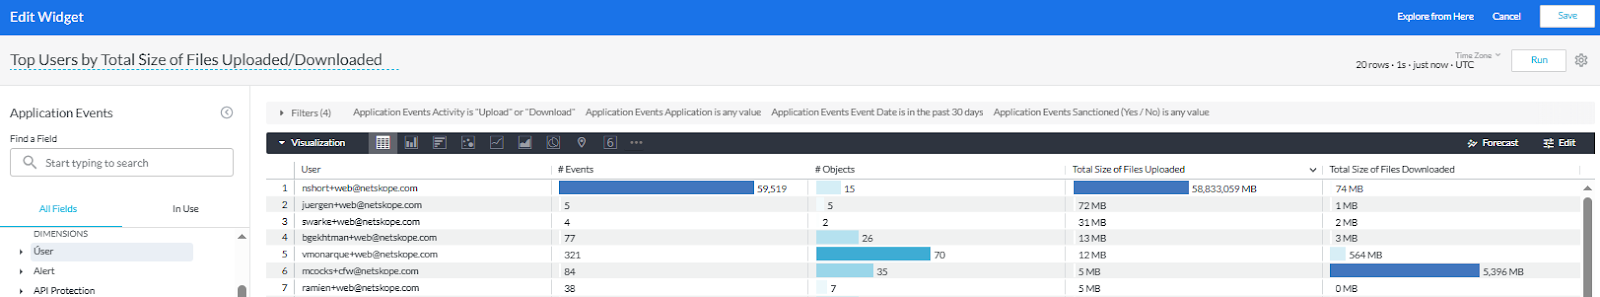
- After update:
- The process for measures is the same as for dimensions in step a.
- Remember to save your changes by clicking on the ‘Save’ button
For additional details on how to best leverage Advanced Analytics please visit:
Terms and Conditions
- All documented information undergoes testing and verification to ensure accuracy.
- In the future, If any such platform changes are brought to our attention, we will promptly update the documentation to reflect them.
Notes
- This article is authored by Netskope Global Technical Success (GTS).
- For any further inquiries related to this article, please contact Netskope GTS by submitting a support case with 'Case Type – How To Questions'.


