It’s incredibly difficult to know the overall NS client's status from thousands of log records at first glance. Netskope log analyzer will make it easy to understand over all NS client status.
 Prerequisite
Complete the procedure described in the below:
Linux user:
How to install Splunk on Linux machine🐧
Mac user:
How to install Splunk on an Apple silicon Mac machine🍎
How to Install
Here is a procedure how to install Netskope log analyzer.
-
Please create a folder at the following location. Splunk will monitor this folder and start indexing logs as soon as it detects client logs.
sudo mkdir -p /var/log/splunk/logs
sudo chmod 777 /var/log/splunk/logs -
Place the Add-on folder in the Splunk apps directory.
For Linux user:cd /opt/splunk/etc/apps/git clone https://github.com/netskopeoss/netskope_log_analyzer.gitMac Linux user:
cd /Applications/Splunk/etc/appsgit clone https://github.com/netskopeoss/netskope_log_analyzer.git -
Restart Splunk
sudo splunk restart
Congrat! App Installation completed!!
Let’s upload NS client log to Splunk server and study how to use this tool.
-
Access to http://127.0.0.1:8000/en-GB/app/netskope_log_analyzer
How to use
-
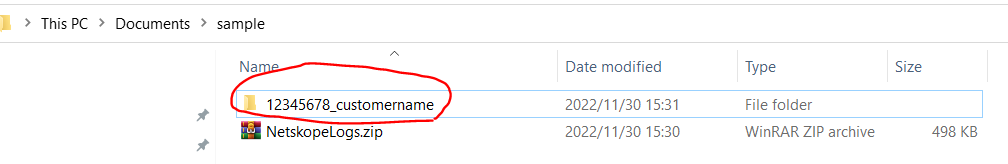
Unzip NS Client log and rename the folder
Important!
Unzip log file and give an unique folder name to it. This app uses this unique folder name internally.ex)
You can name the folder name like <SFDC ticket number>_<Customer name>
-
Extract the Netskope log bundle and upload the log folder to /var/log/splunk/logs. Splunk will detect the logs in the log folder and start indexing them.
- Go to Splunk Web UI using the user/pass you configred at How to install Splunk on Linux machine🐧
-
http://<your Ubuntu VM’s IP>:8000
-
-
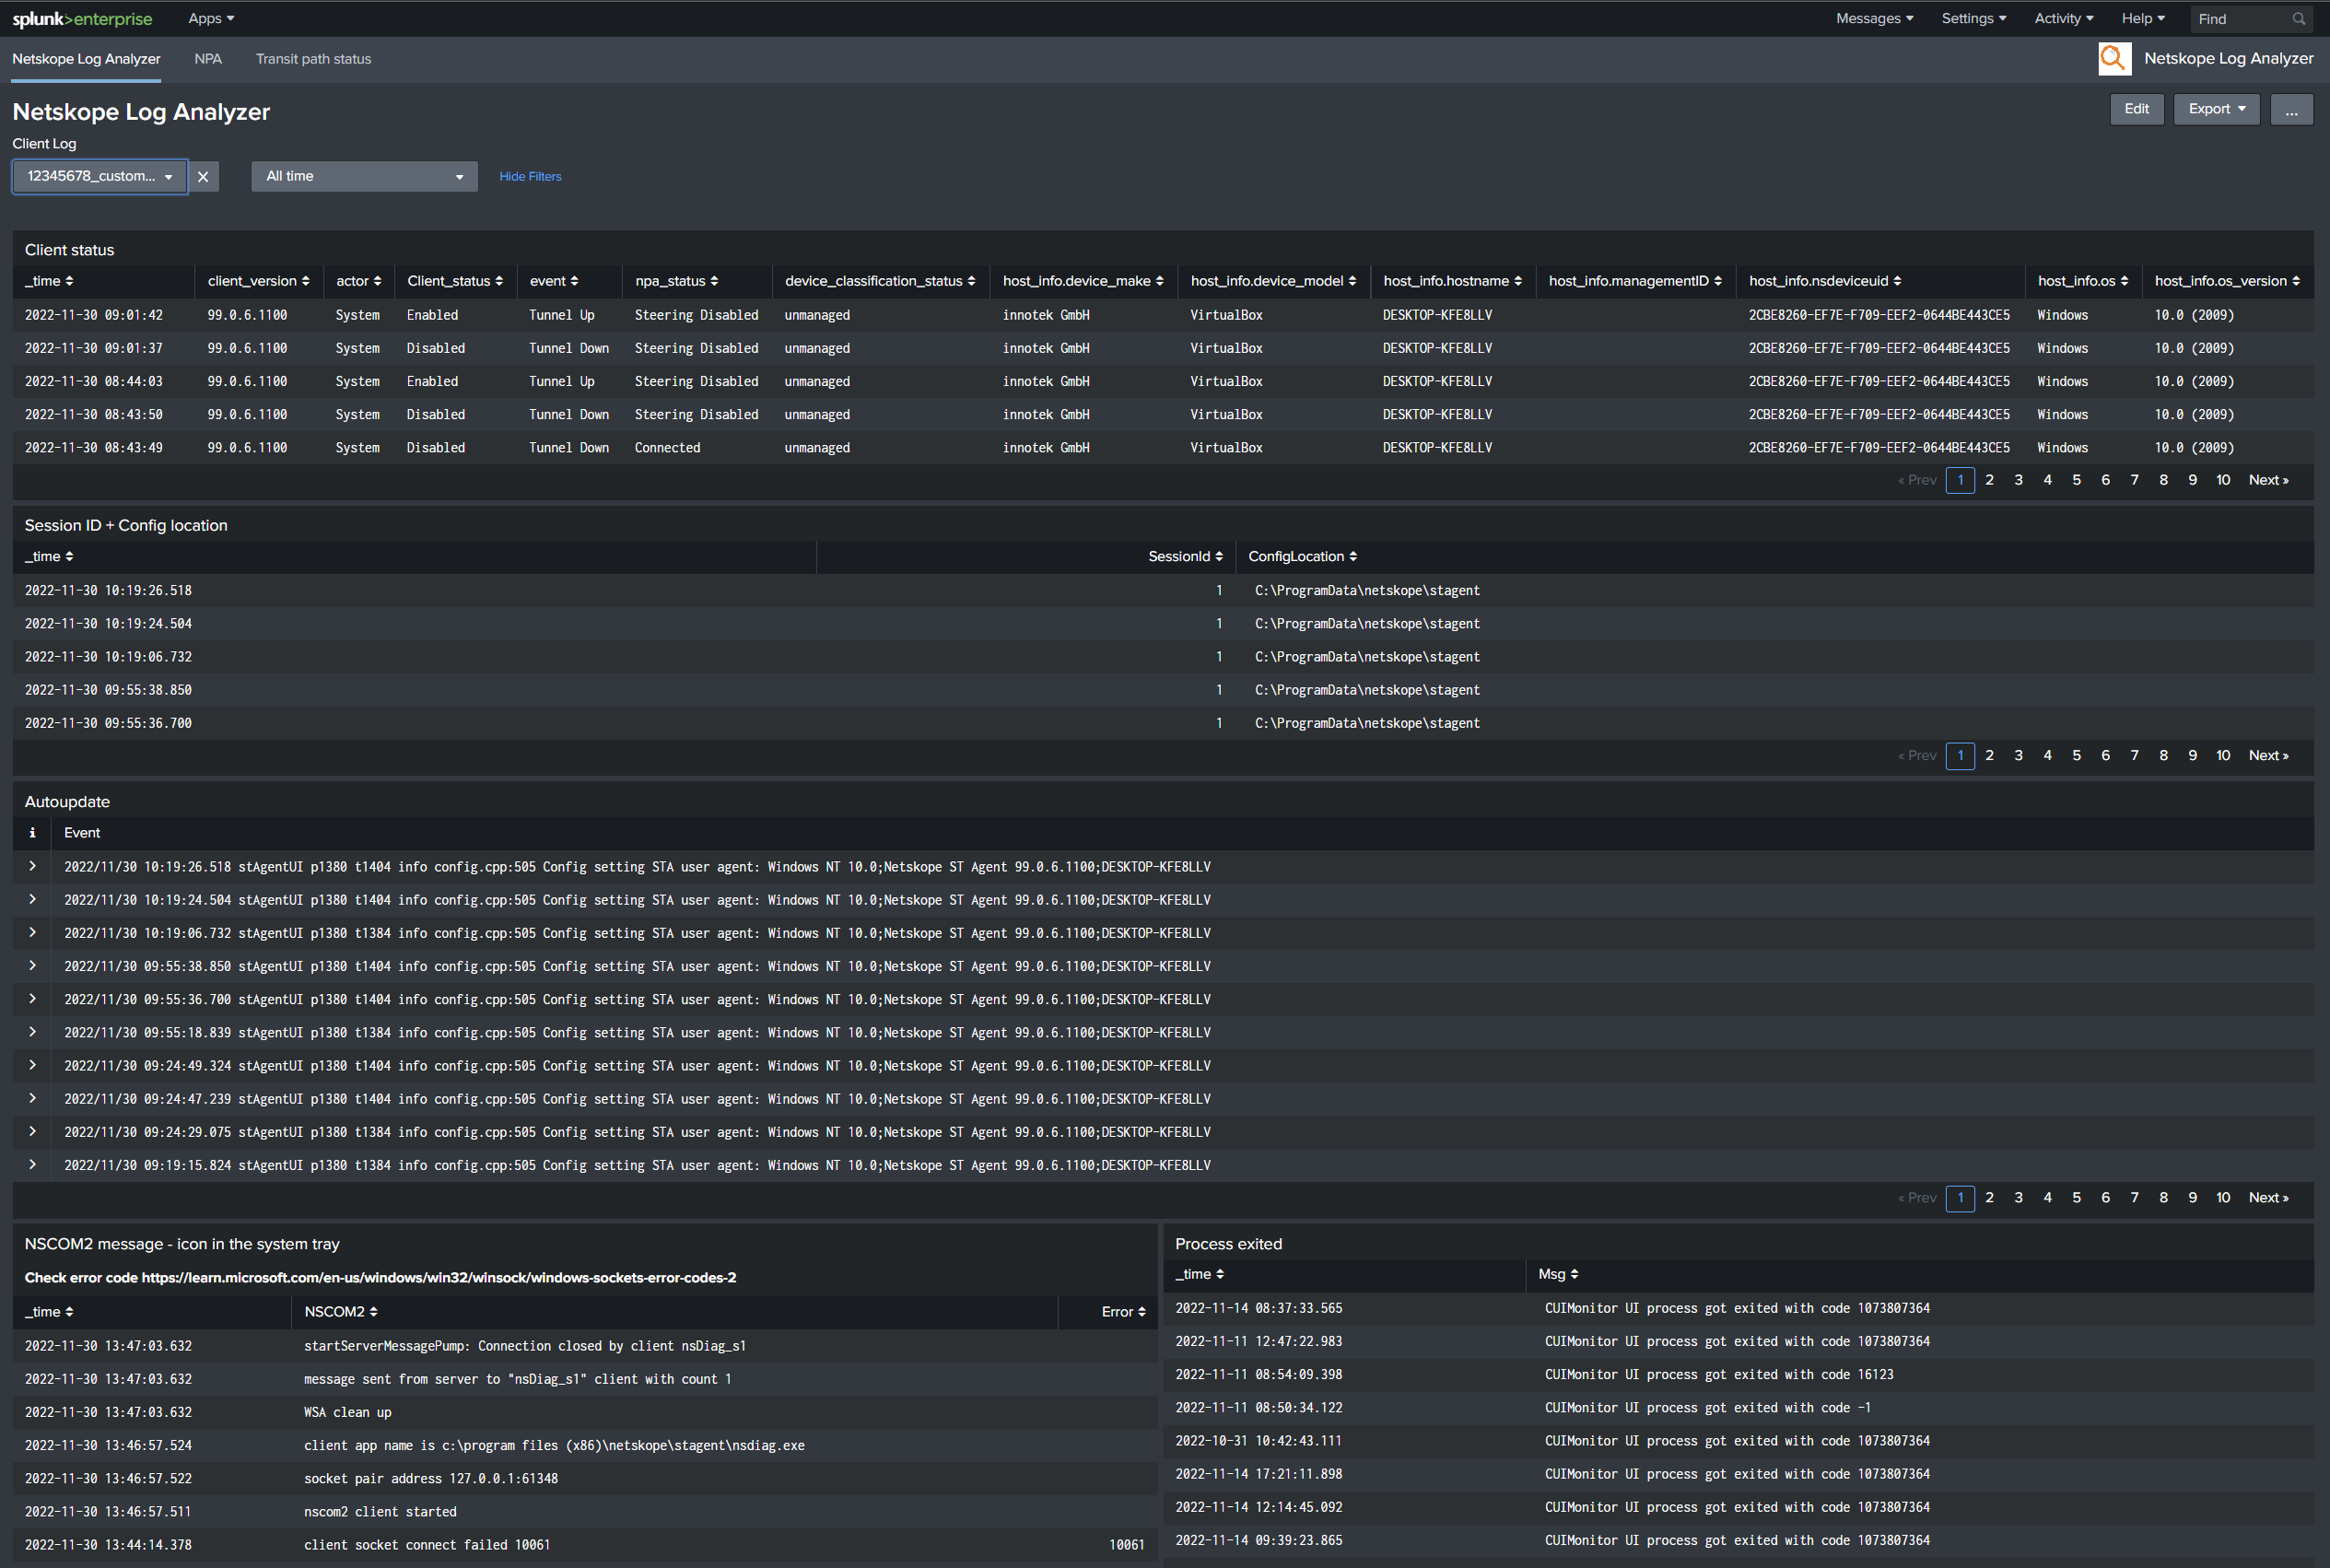
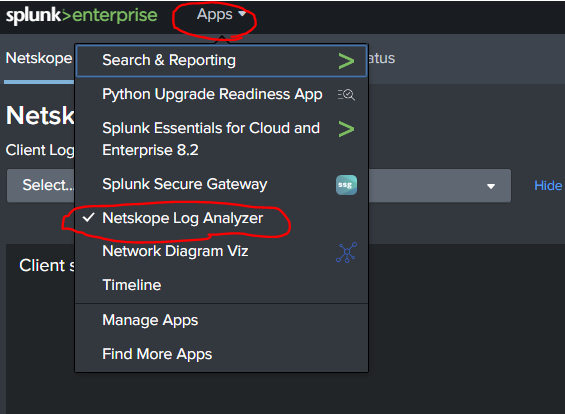
Select “Netskope Log Analyzer” from the Apps dropdown menu located on the left top.
- Select folder name you uploaded at the Client Log dropdown menu.
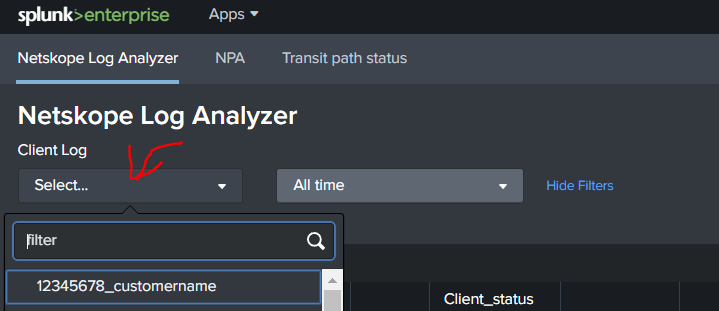
-
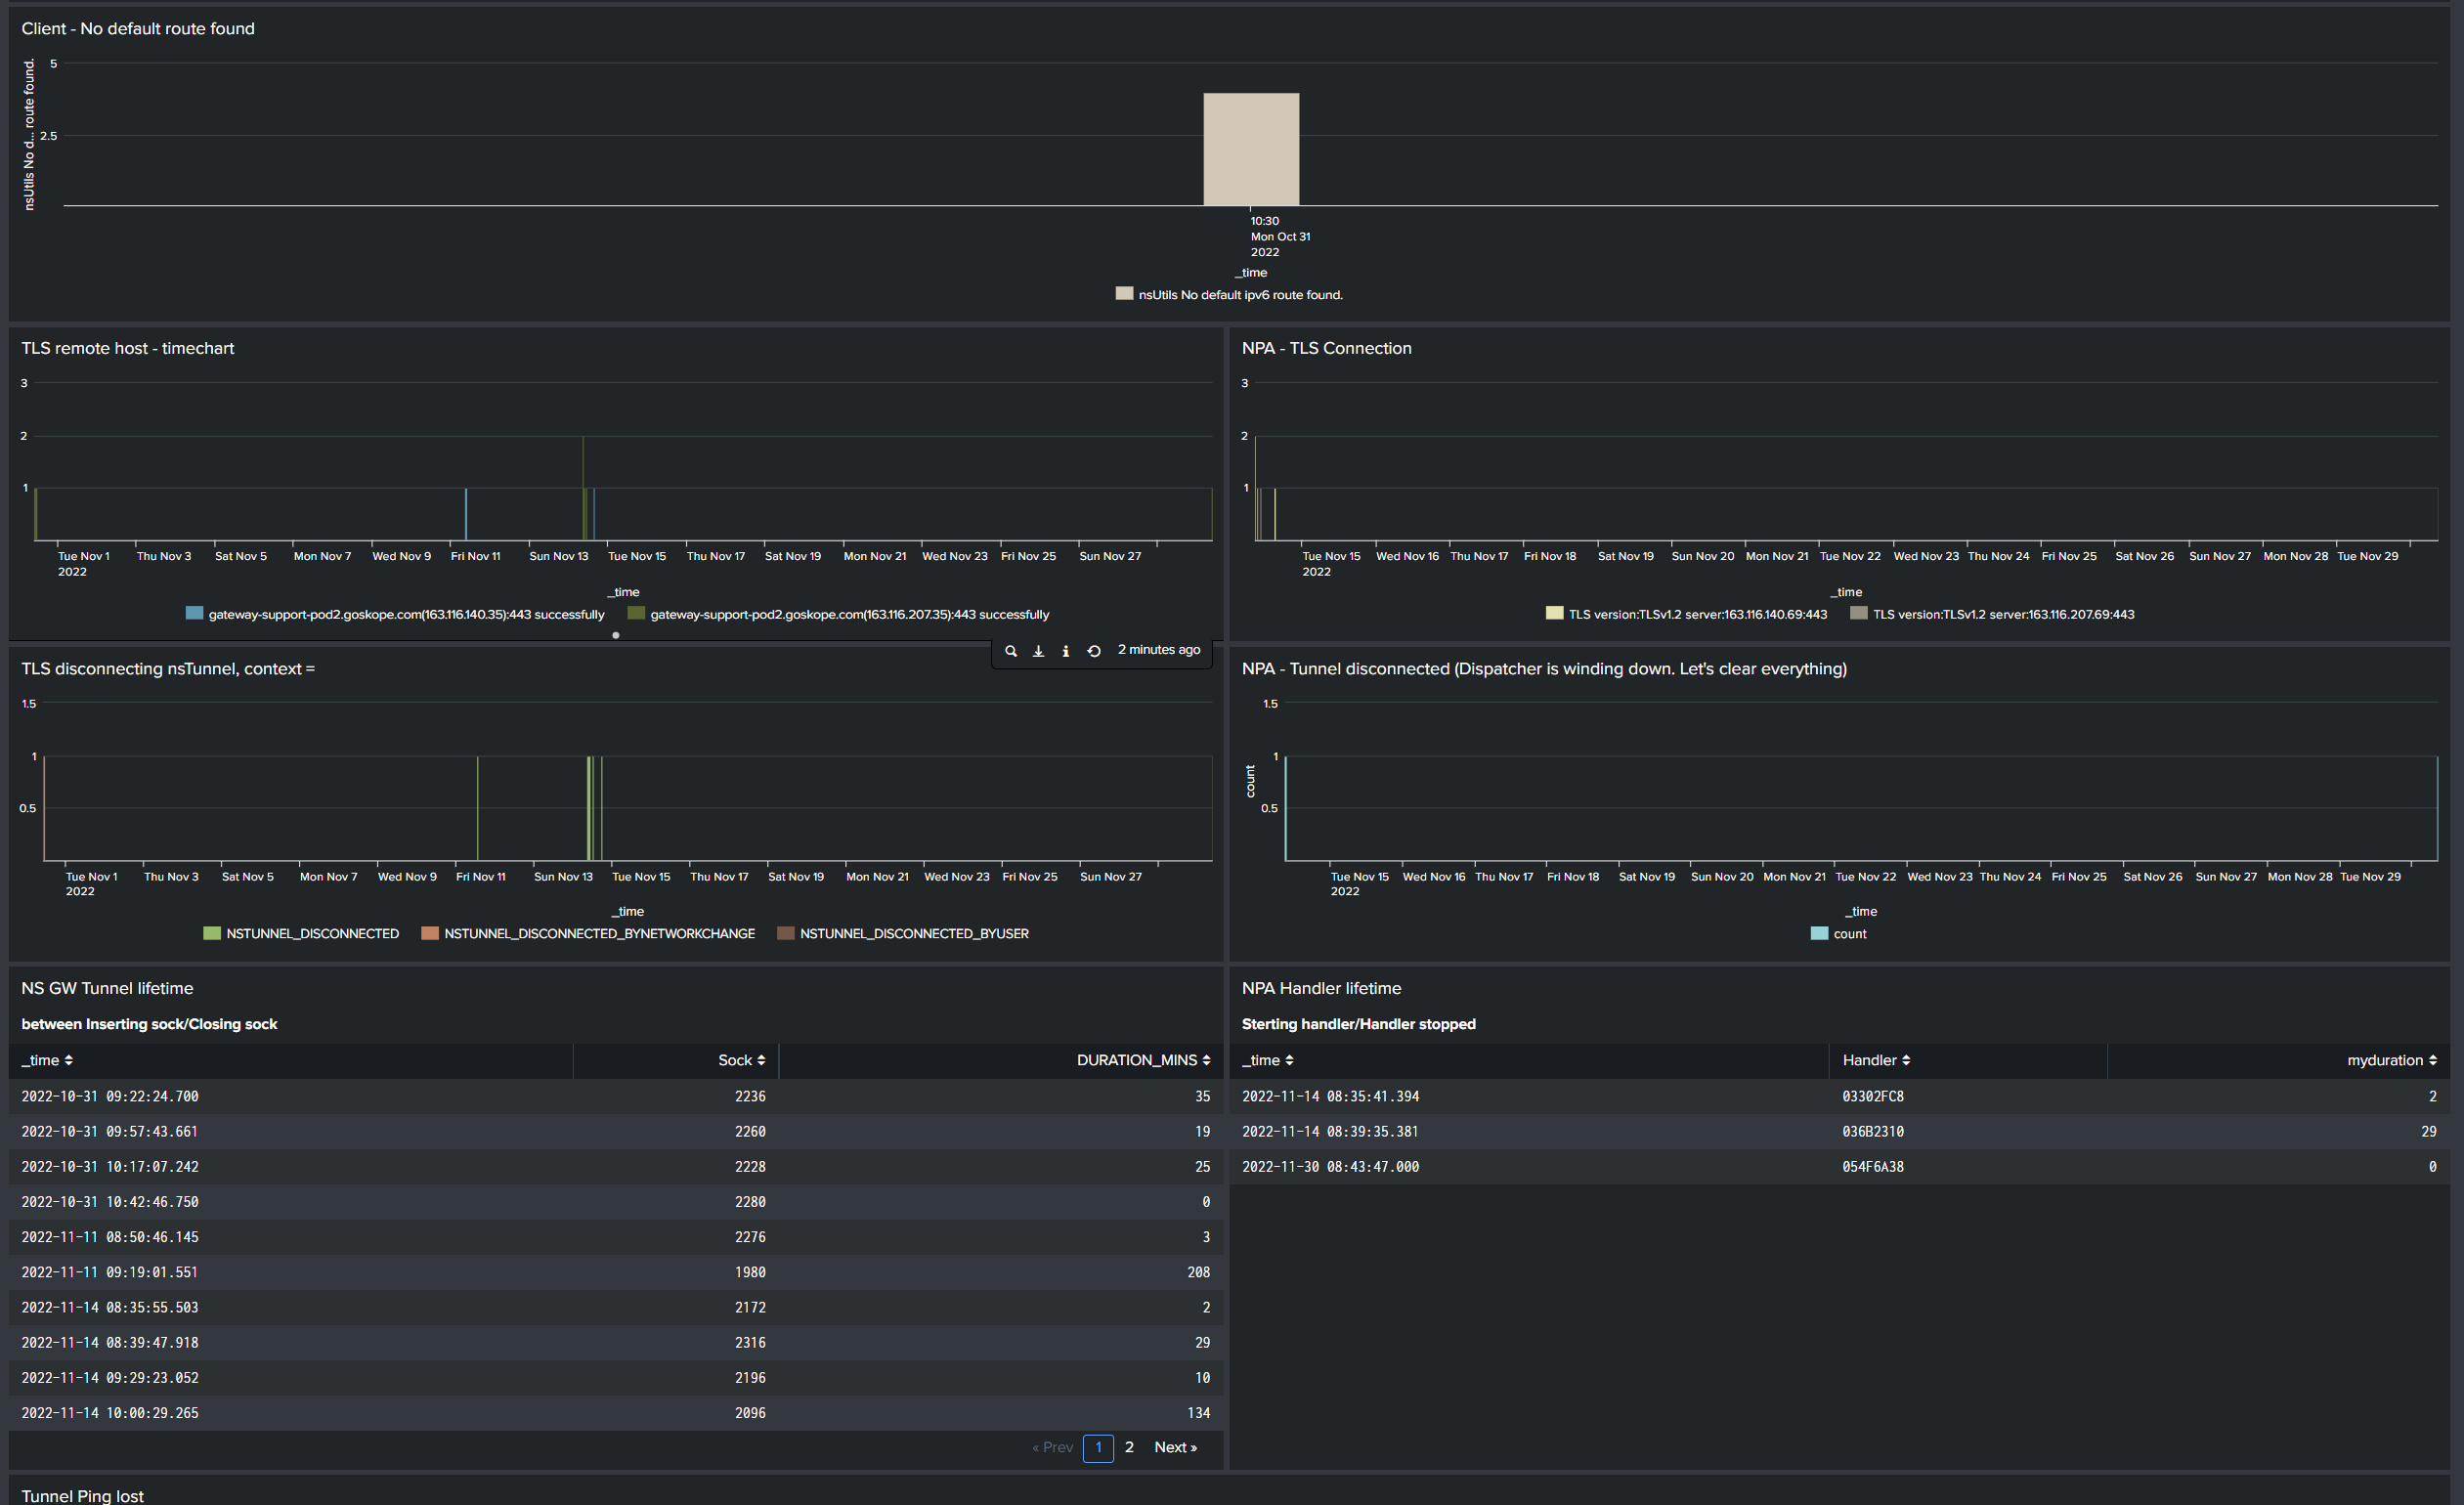
You will see the log analyse result in the dashoad.