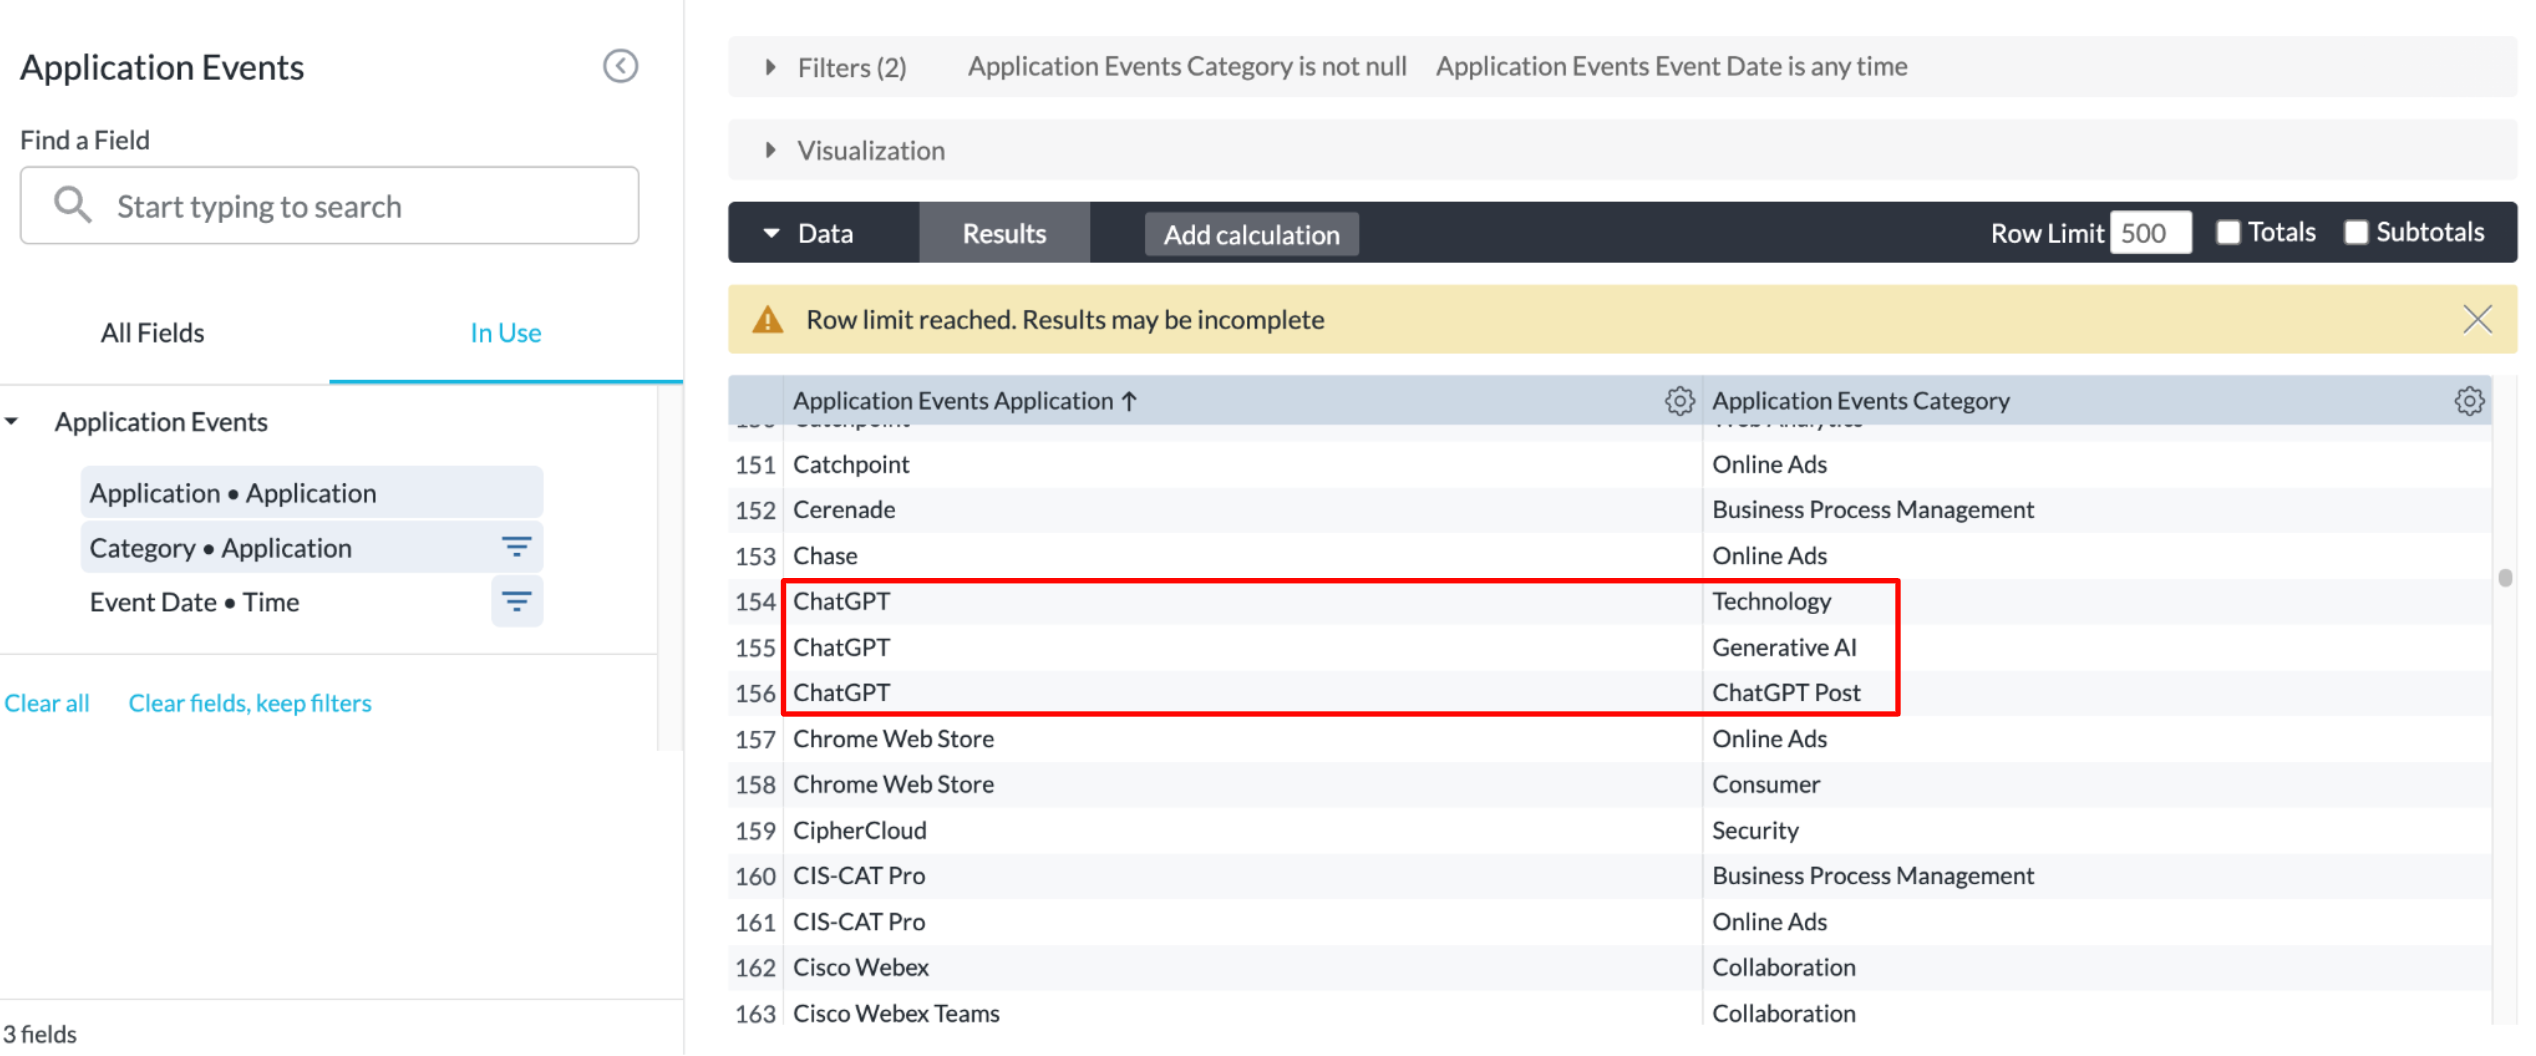
Duplicate data can sometimes blow up a visual. For example, Aaron is looking for a list of apps detected in his environment and the corresponding category of each app, so he created a table with "Application" and "Category" using Advanced Analytics.

The table works, but also brings a problem. Some apps (e.g. ChatGPT) have multiple categories, which generates many duplicate rows in the table. For each app displayed, Aaron wants to know if there are any methods to show all categories in a single cell of the table.
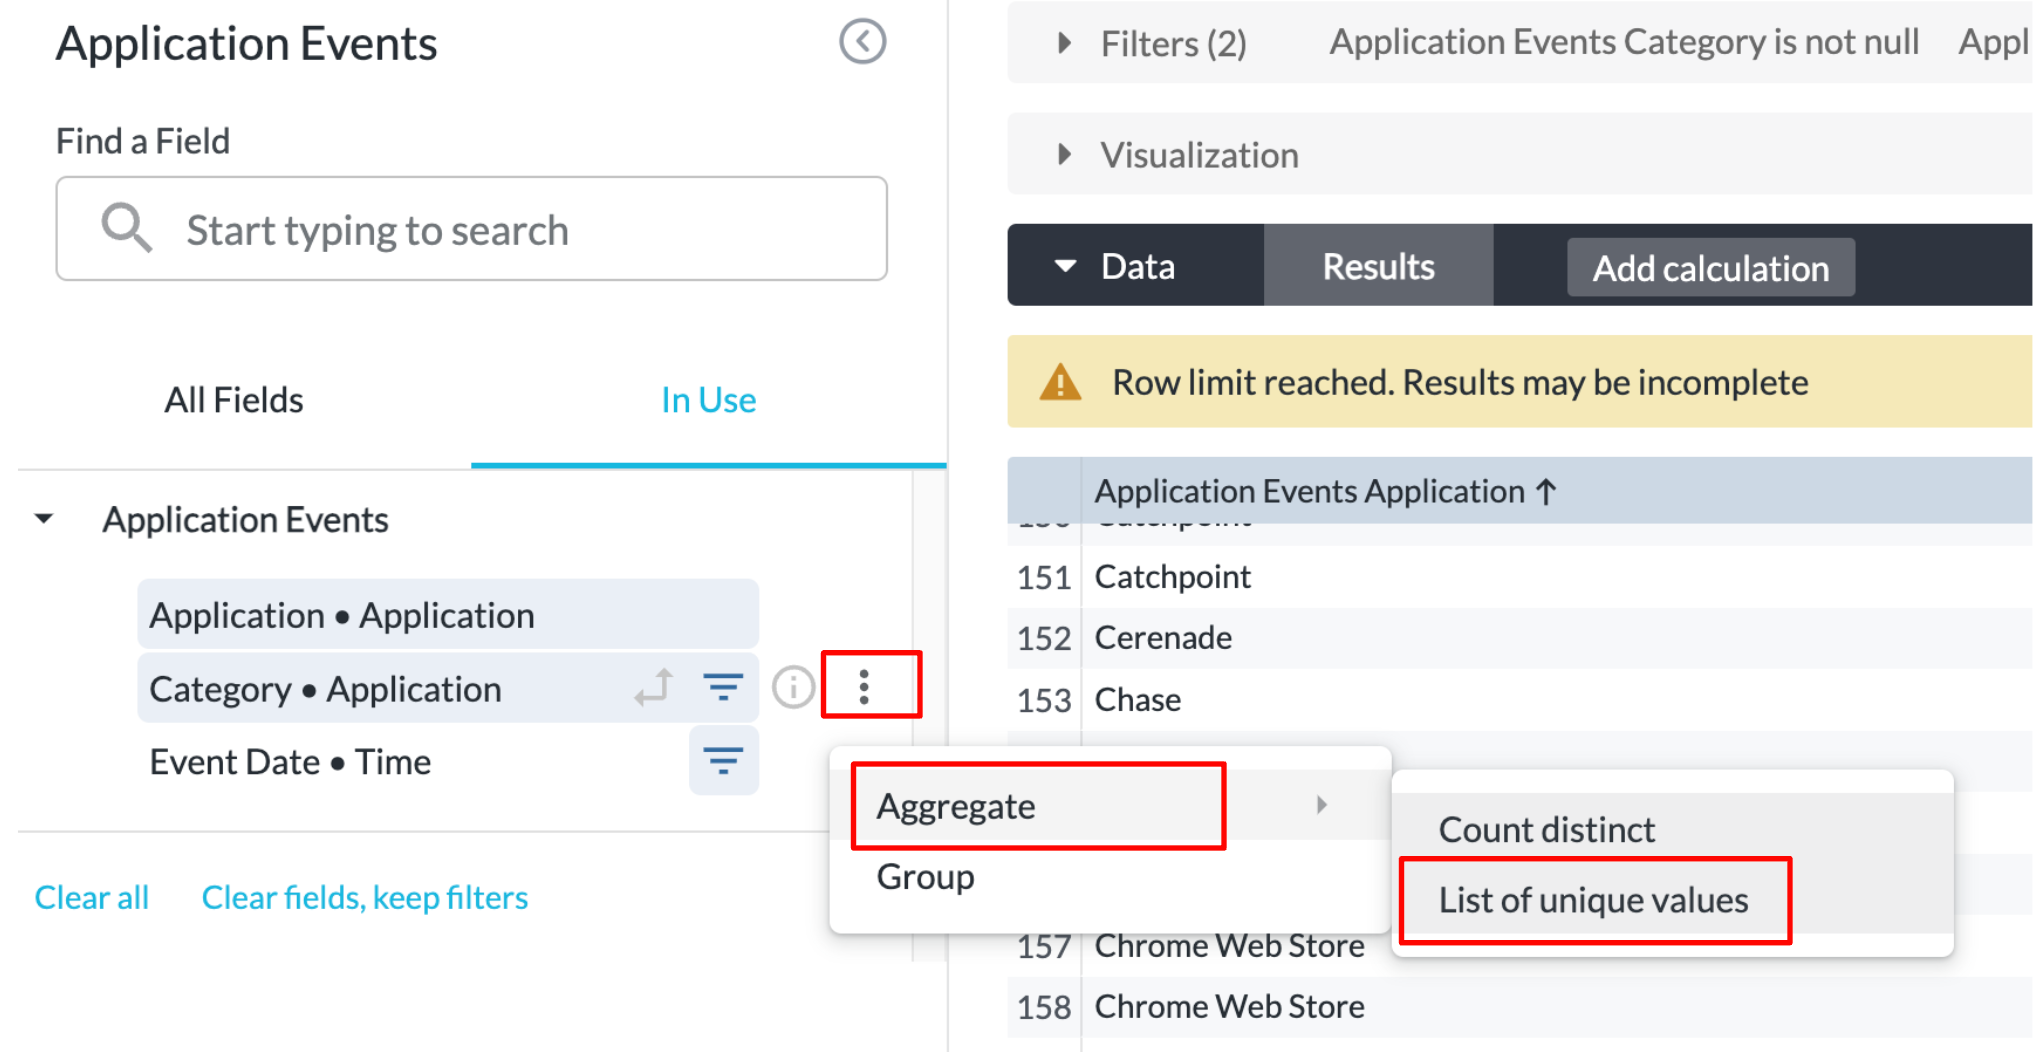
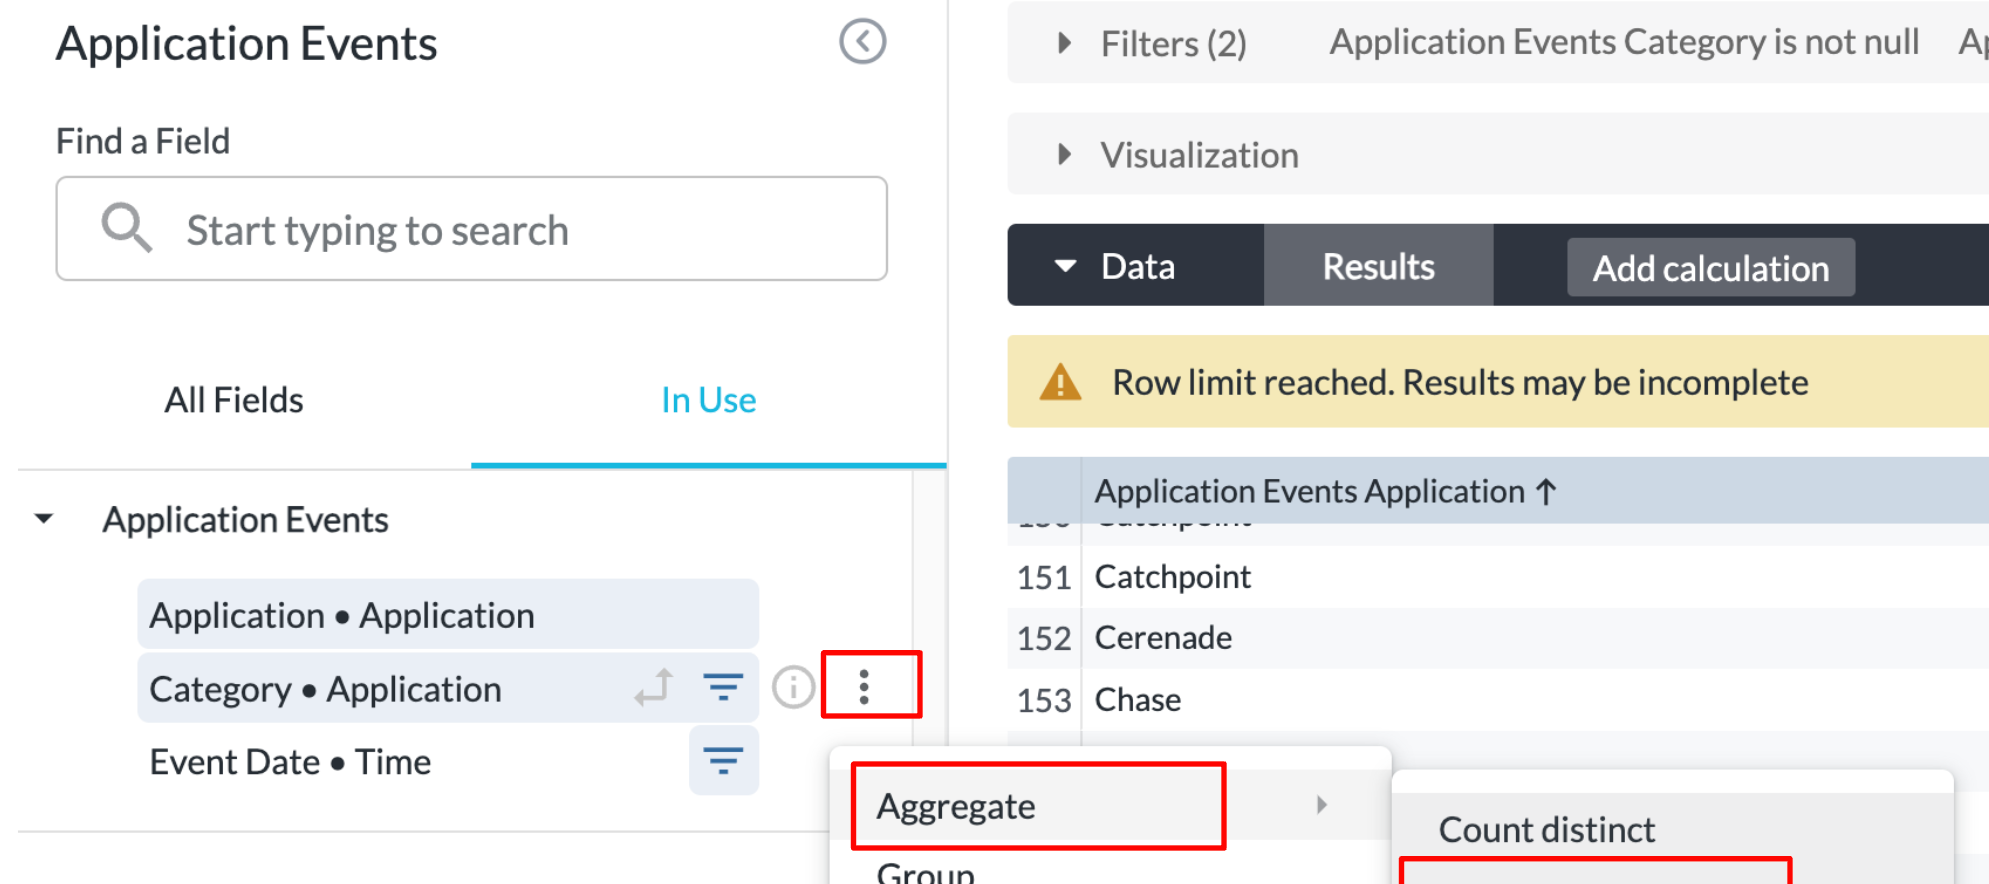
We can do this with the "List" feature. In the widget edit mode, click the 3-dot button next to "Category," select "Aggregate," and then hit "List of unique values."

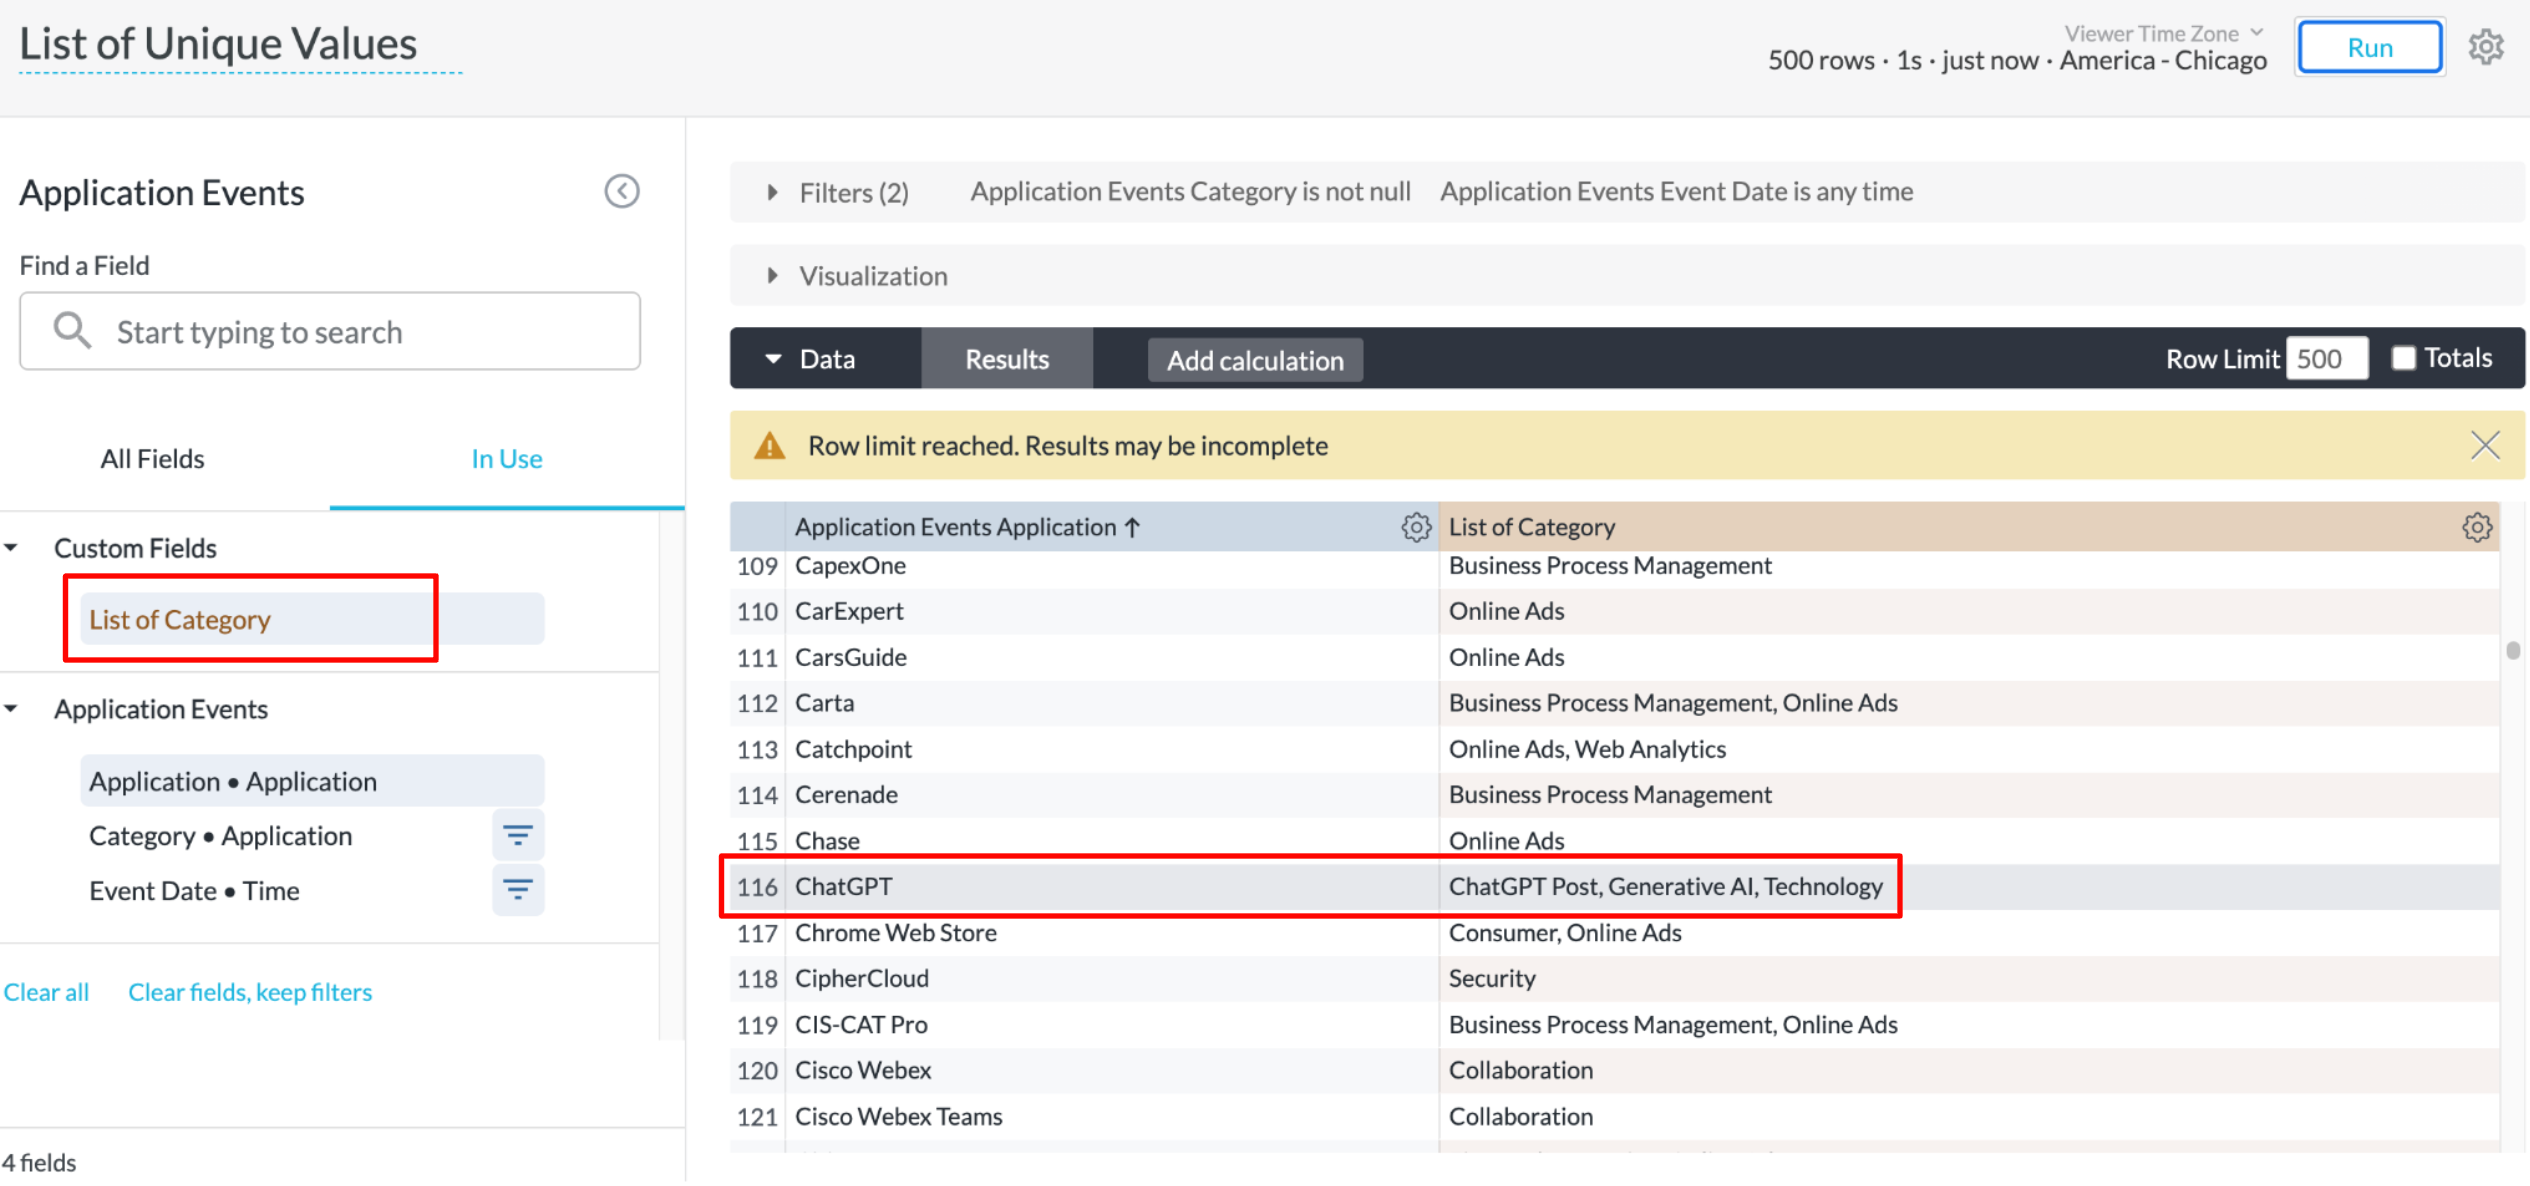
A custom field "List of Category" will be created automatically. By removing the original "Category" field and apply the new "List of Category," all categories for each app will be displayed in a single cell. Issue resolved! Duplicate rows are now removed.

This solution can also be applied to any other dimensions in your dashboards. A template is attached below. Feel free to further customize it in your own environment. Let us know if you have any questions!


