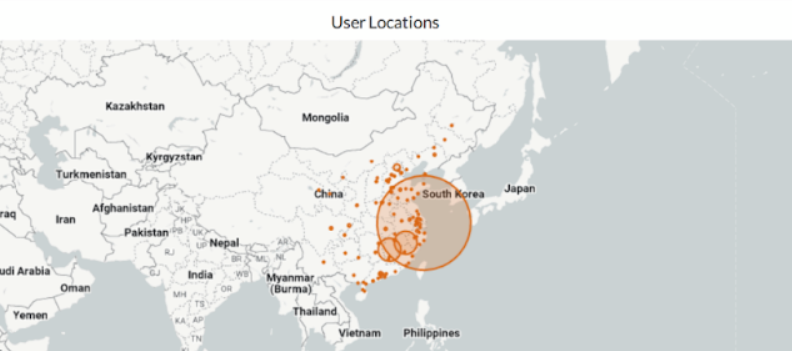
Netskope administrators often need visibility into user-level and app-level data transfer volumes within China in order to help them track utilization.

The objective of this dashboard, attached below, is to provide insights into data consumption volumes in China, assisting customers in optimizing their steering and security policies. Specifically, this report helps to identify the primary users and websites responsible for consuming the largest amount of data transferred in China within a specific time period.


AD_4nXd6PuKyNG9t8-QDvLEIWAVcguQNF9SX8edomQowitr_CHhJ4b1tyJAZK1CxJR7GyNl14Gir1eHiMKSY_QzUQMI4Wrxa4dteELaZ_K0lBOcOJlmcDLiEpcrmpTG4bkMJ0C2A9DLXE1yTNseZtlhfBxHE6erZ?key=gJTmzg0gcGV2kVuZvXJ8DQ


  • Is it possible to add functionality to drill down by object? This will allow us to see what files the user is working with, that are contributing to the traffic.
  • I believe multiple events are reported into the logs for the same download with the full file size in every log entry, if a download takes some time to complete. is the report simply adding the file size reported in each log entry (which would lead to double / triple / quadrupling /..the data) OR is there some deduplication done of the logs by user, object etc?

thanks!

-Ravi


Hi ​@ravis ,

Currently this dashboard does not support visibility into objects. 

The dashboard is based on Transaction Events which log web traffic, so the Sum - Total Bytes here reflects the volume of web traffic, e.g. total bytes of the web sessions in and out, which is not directly correlated to the files/objects. 

Your use case has been escalated by your TAM, and we are working on alternative solutions with your account team. Feel free to let me know if you have any additional questions!

Best,

Aaron


Reply