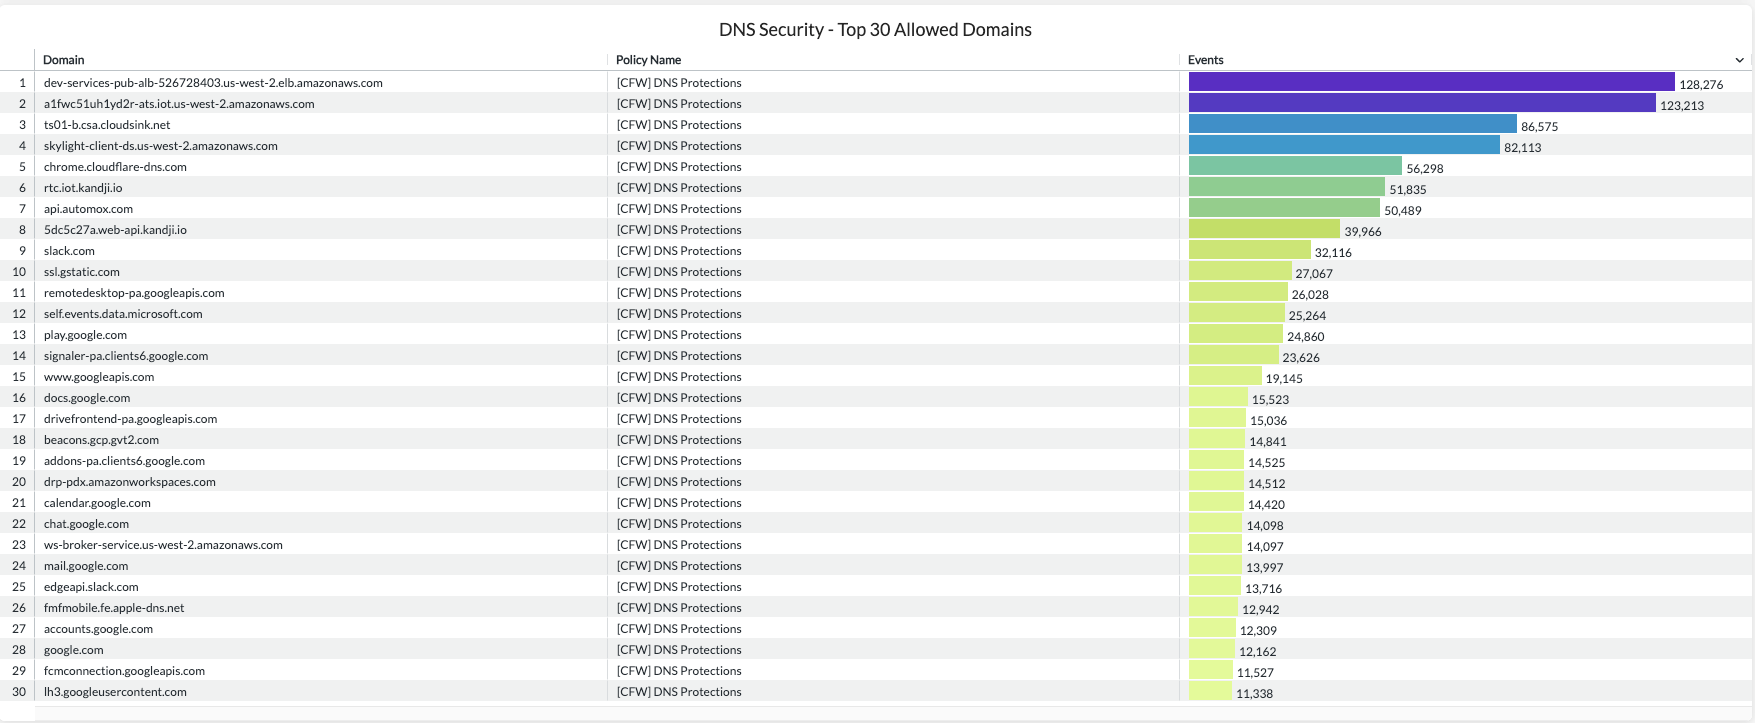
This is an update to the already improved Cloud Firewall Dashboard that was uploaded last year. I've made a few tweaks to improve the filtering for more efficient usage. This improves upon the Cloud Firewall Discovery dashboard in the Netskope Library by now having users, traffic, policies, top allowed protocols, top blocked protocols, top users and source IP for allowed and blocked traffic, top blocked DNS domains, top users with blocked DNS domains, top DNS allowed domains, etc.
You can now filter all of the data or different widgets independently depending on your needs:

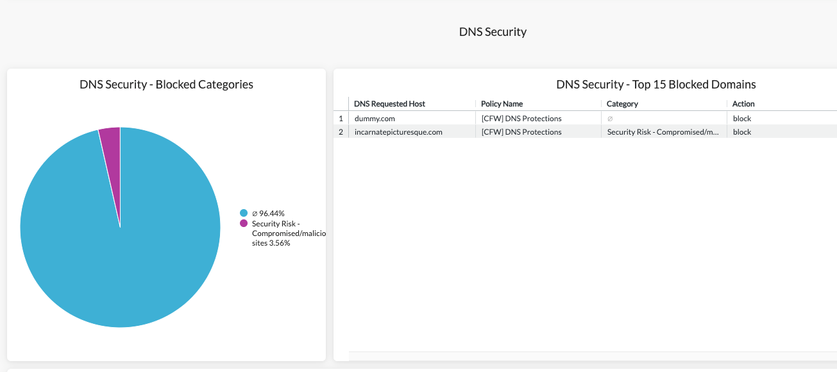
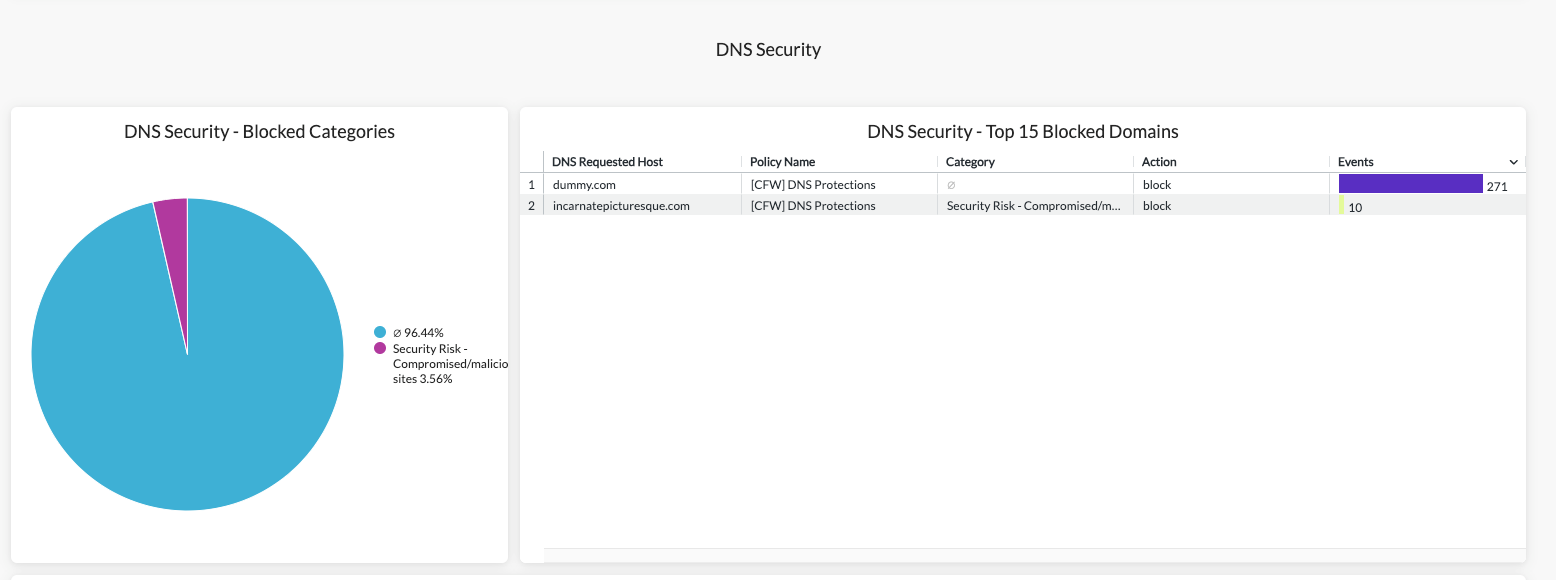
More visibility into DNS specific activities, especially if you're using Cloud Firewall's DNS Security:

Give it a try!


