Question

Dashboard to track trend of enabled vs disabled client

  • January 9, 2026
  • 2 replies
  • 50 views

jenhenry
Netskope Partner

Hello,

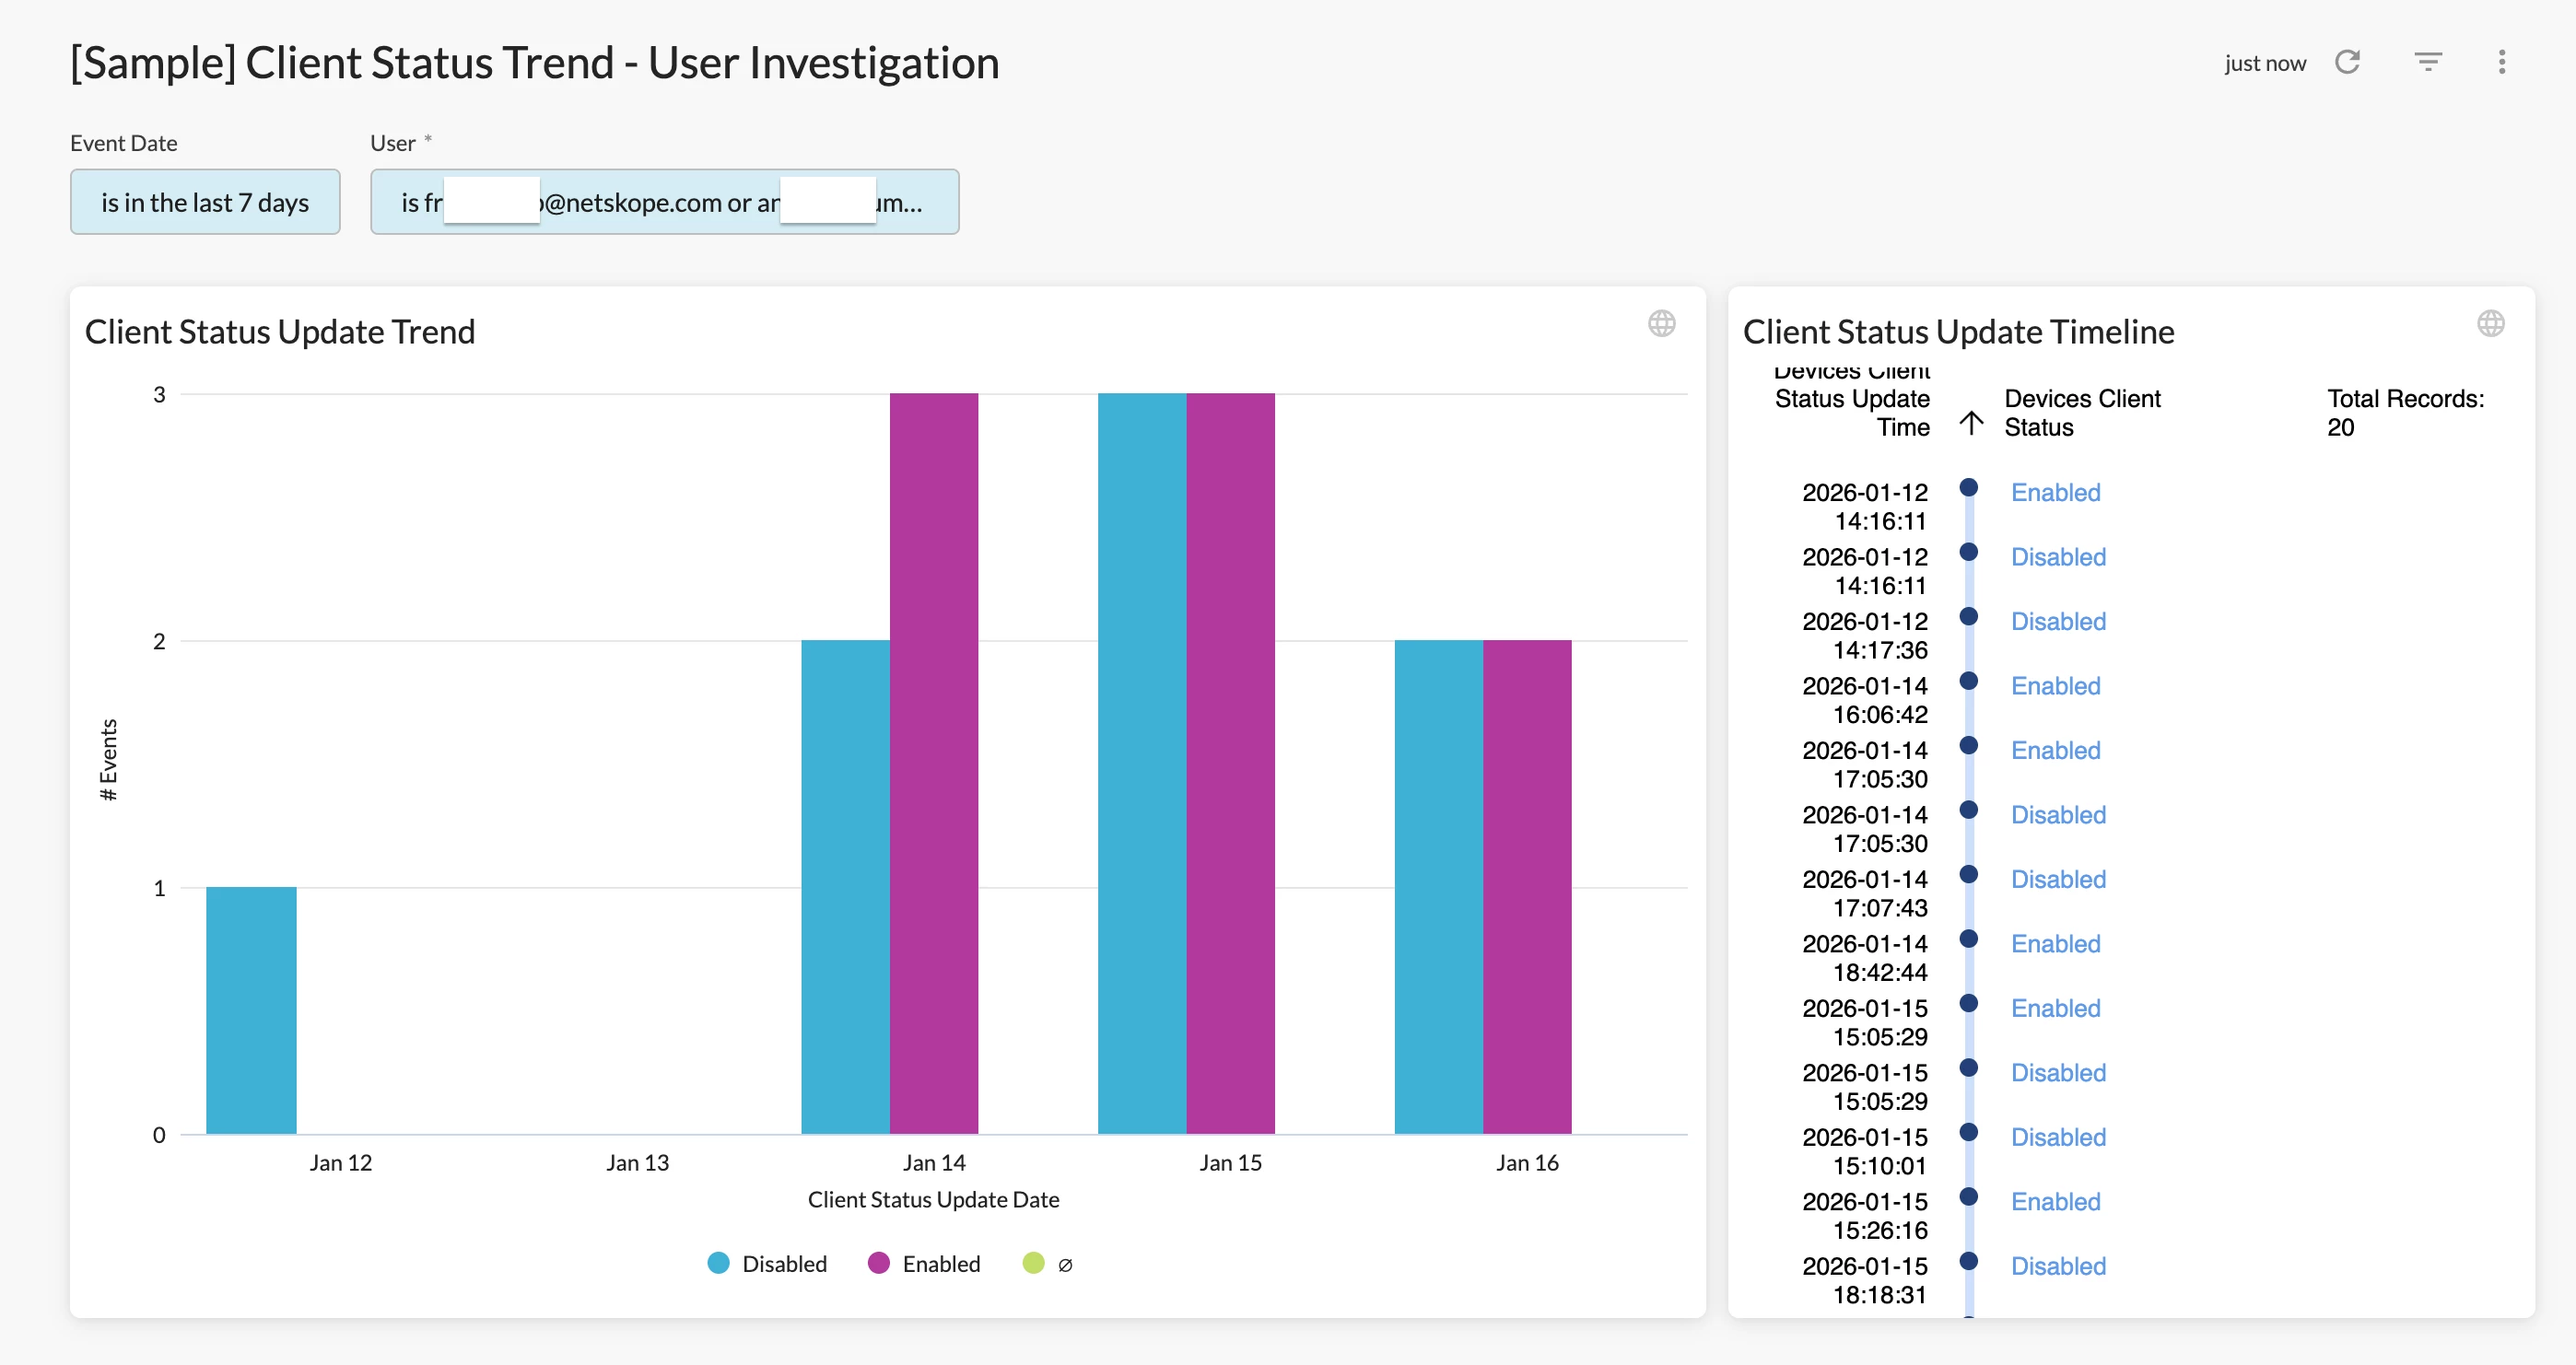
Is there a way we can create dashboard to track all the endpoints that are enabled vs disabled and the observed trend on how often does a user disable the client and enable it again (for example)?


Thank you,

Jennifer

2 replies

Aaron_Zhang
Netskope Employee
Forum|alt.badge.img+13
  • Netskope Employee
  • January 16, 2026

Hi ​@jenhenry ,

Thanks for reaching out.

We can leverage the “Historical Client Status” field in Advanced Analytics - Devices Data Collection to track the trend of client statuses from a particular user.

A sample dashboard has been attached. The dashboard provides a bar chart that shows how many times each client status was detected in the last 7 days and a timeline chart that shows all client statuses detected in chronological order.

Please note that this dashboard is developed for user investigation purposes, so at least one user needs to be selected in the “User” filter on top of the dashboard.

Feel free to let us know if you have any questions.


Best regards,

Aaron


jenhenry
Netskope Partner
  • Author
  • Netskope Partner
  • January 16, 2026

Hi Aaron, 

Thank you for your reply! This is useful for a single client investigation. 


I was looking more for-

  1. Client Status overall: Enabled = x, Disabled = x 
  2. Top users appearing with disabled status (timeline)
  3. Graphs showing “Disabled By Netskope Client Version”, “Count of Devices/Users By Service (Internet Security/Private Access)”, “Disabled By OS”, “Disabled by Client Status (Tunnel down/User disabled etc)”

If something like this doesn’t exist, would be a good idea to develop one for customers to track:) 


Thank you,

Jennifer