
Please note that this dashboard requires Endpoint DLP enablement in your environment.
Looking for a unified dashboard to monitor data movement in your environment? This Data Flow Investigation Dashboard V2 can help!
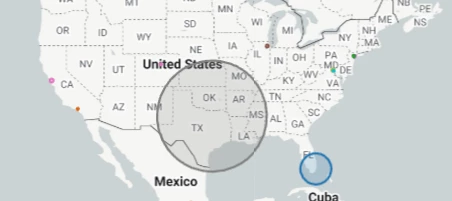
The dashboard provides both high-level and granular visibility into the data movement in your environment from 3 dimensions: geolocation data flow (web transaction), cloud application data flow (app events), and endpoint data flow (endpoint traffic).
Questions answered by this dashboard include:
- Which regions is my data moving from and to
- Which apps is my data moving from and which instances is the data moving through
- Which endpoint devices (e.g. USB drivers, printers, & bluetooth devices) is my data moving to
- How is the data movement volume trending over time
- What files/objects have been detected in the data movement, who are the users engaged, and what activities have been performed by the users


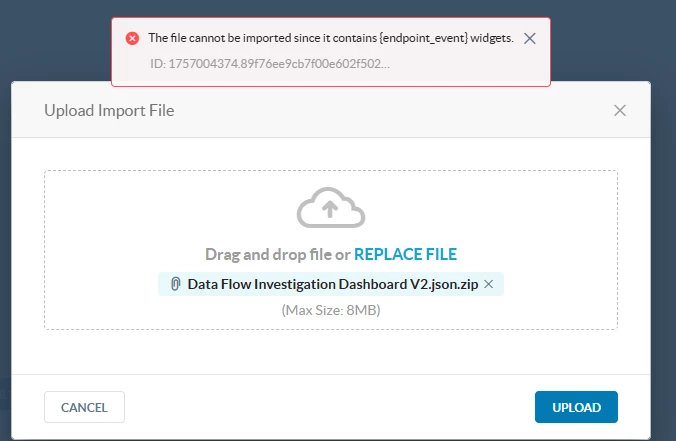
The dashboard template is attached below. Feel free to try it out in your own environment and share any feedback or questions.
If you are looking to better understand how the sensitive data movement is being controlled by Netskope DLP, check out Data Flow Investigation Dashboard V2 - Control & Monitor.