|
This dashboard gives an overview of user activities in non work-related categories (i.e. #hours spent on social apps). Use this dashboard to...
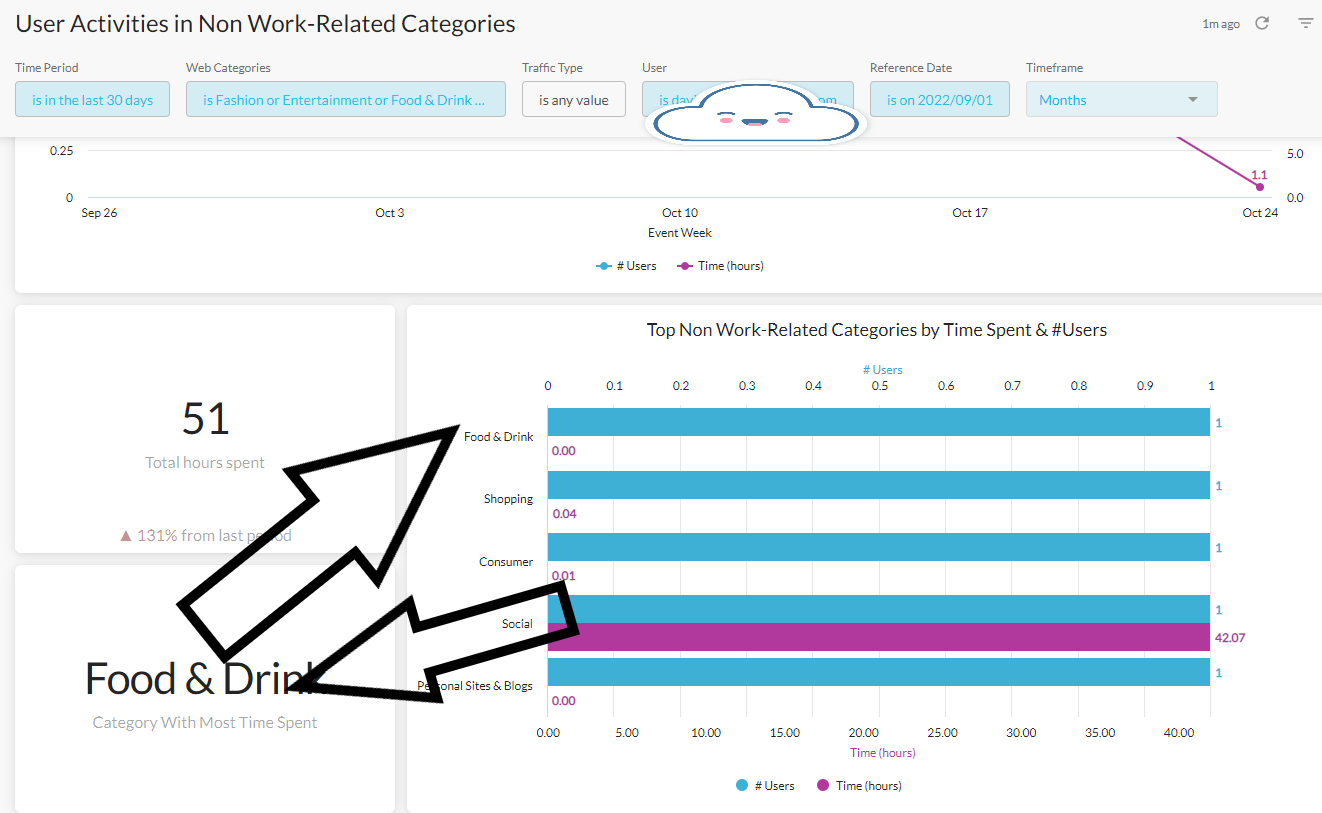
Understand trend of Users and Time spent in non-business categories: 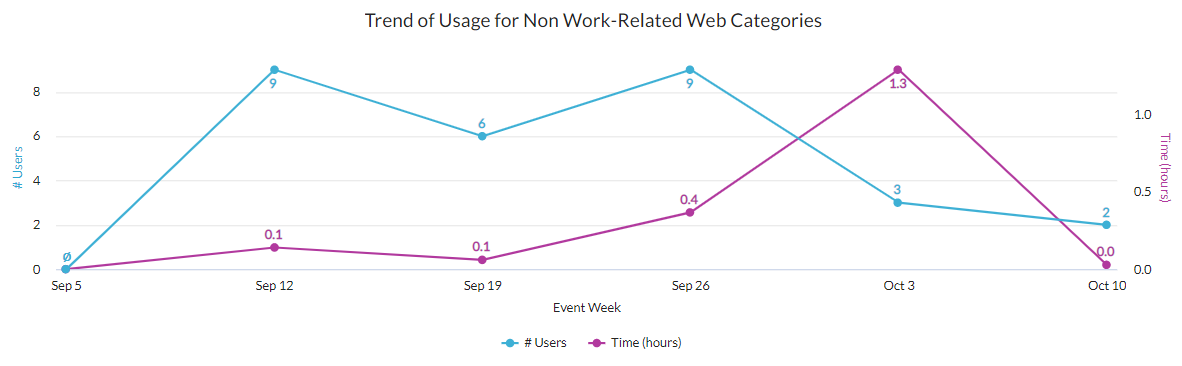
Analyze top categories where users are spending time: 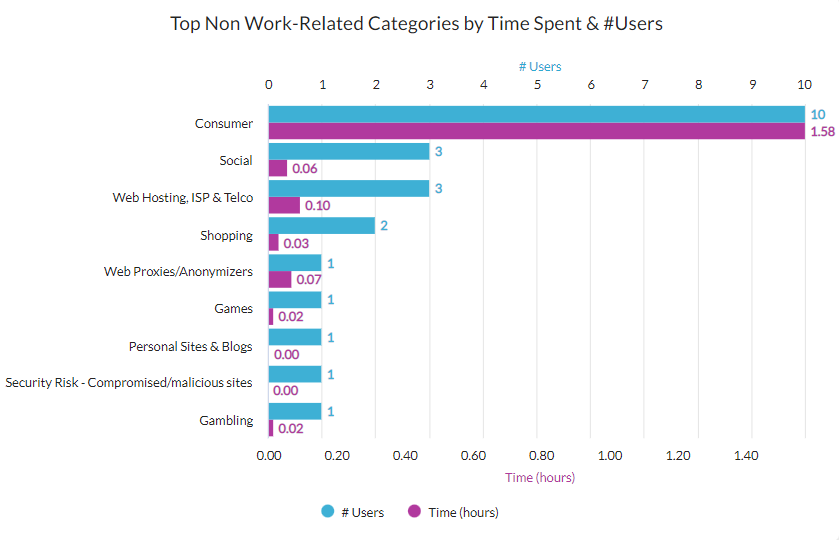
Visualize trend of business vs. non-business time spent in apps: 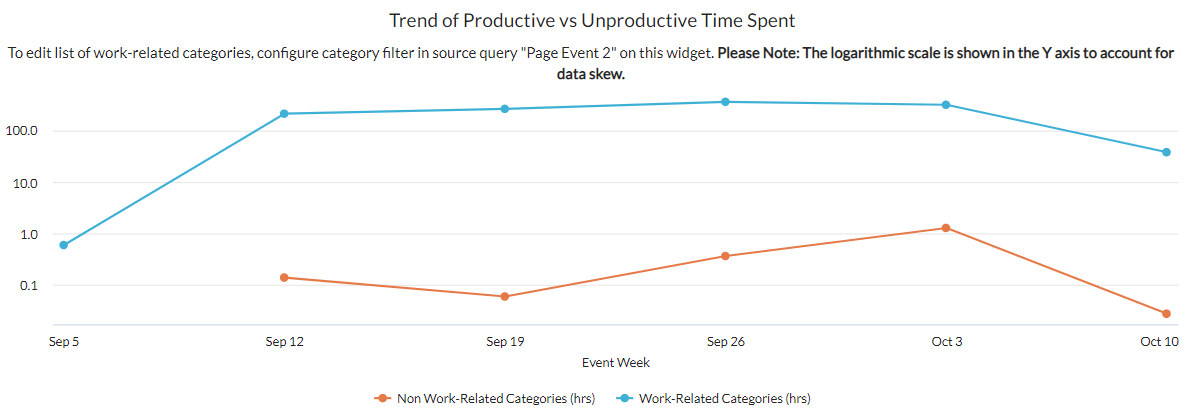
Filter on a particular user or set of users: 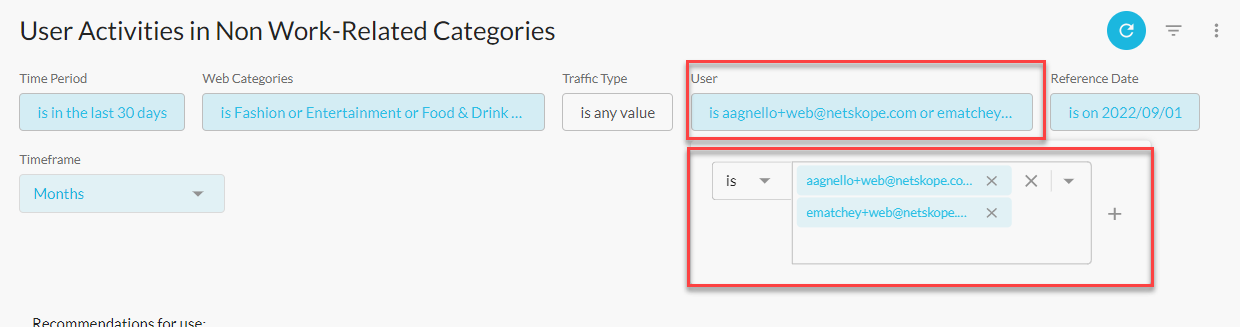
And More!
|

Non-work Activities by Users
 +16
+16This topic has been closed for replies.


Sign up
Already have an account? Login
Sign in or register securely using Single Sign-On (SSO)
Employee Continue as Customer / Partner (Login or Create Account)Login to the community
No account yet? Create an account
Sign in or register securely using Single Sign-On (SSO)
Employee Continue as Customer / Partner (Login or Create Account)Enter your E-mail address. We'll send you an e-mail with instructions to reset your password.