

Netskope Global Technical Success (GTS)
KB - How to create a dashboard for tracking Device Status Advanced Analytics
Netskope Cloud Version - 131
Objective
To create a dashboard in Netskope Advanced Analytics that provides daily visibility into enabled and disabled devices across the organization. This dashboard can also be scheduled and automatically shared with admins for monitoring purposes.
Prerequisites
Before configuring dashboard, ensure the following:
- License for Netskope Advanced Analytics.
- Admin role with permissions to create and share dashboards.
- Basic understanding of Netskope device page.
Understanding of the Working
Netskope Advanced Analytics allows admins to query device information and generate visual reports. By filtering device status (enabled/disabled), you can create a dashboard that provides:
- Total number of devices in the tenant.
- Count of enabled devices.
- Count of disabled devices.
- Trend analysis over a daily timeline.
This helps admins proactively monitor device health and identify users with disabled clients.
Use-case
- Security teams want daily visibility of users/devices with Netskope clients disabled.
- IT administrators want to track adoption and operational status of the Netskope client across the enterprise.
- Compliance teams need automated reports for audit purposes.
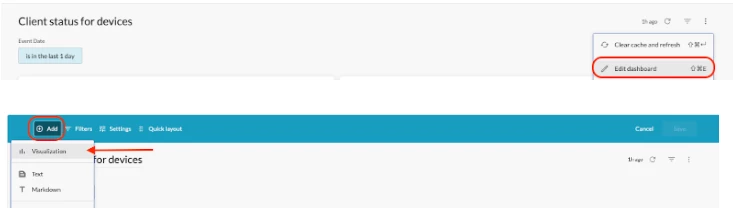
Steps to Configure:
Step #1:
Log in to your Netskope tenant >>> Advanced Analytics >>> Explore → Data Collection → Devices.
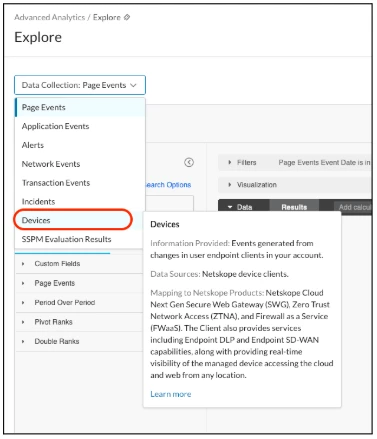
Step #2:
Create the first widget on your dashboard to identify the list of disabled devices.
Apply filters:
Use the search bar, type “Current Client Status” and click the the filter button to select the required field.
| ℹ️ E.g: 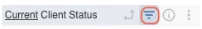
|
Add Visualisation
Use the search bar, find the below dimensions and select them:
- User
- Current Hostname
- Current Client Status
- Etc. (POP, OS, User Group..)
| ℹ️ E.g: 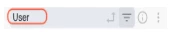
|
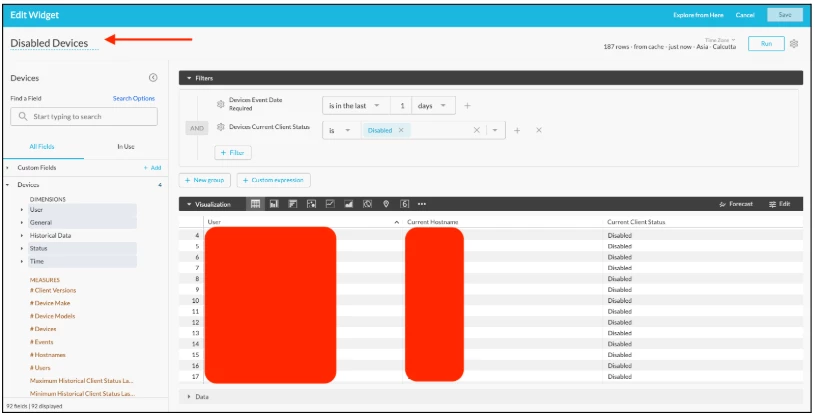
Save the widget (Name = “Disabled Devices”) as a new dashboard in either of the following locations:
- Personal Folder: Only you will be able to view the dashboard.
- Group Folder: All admins with access to Advanced Analytics will be able to view the dashboard.
Step #3:
Edit Your Dashboard: Open your created dashboard and add a new visualization.
- Set Data Collection = Devices when configuring the new visualization.
Step #4:
Create the second widget on your dashboard to display the list of enabled devices.
Apply filters:
Use the search bar, type “Current Client Status” and click the the filter button to select the required field.
| ℹ️ E.g:
|
Add Visualisation:
Use the search bar, find the below dimensions and select them:
- User
- Current Hostname
- Current Client Status
- Etc. (POP, OS, User Group..)
| ℹ️ E.g:
|
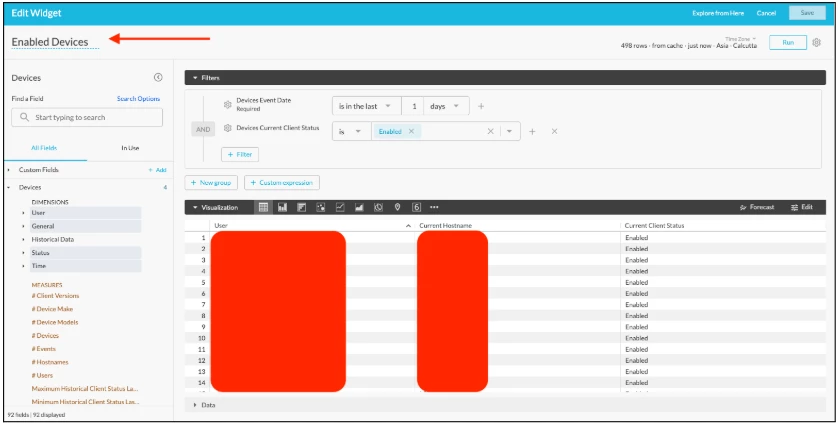
Save the widget (Name = “Enabled Devices”) it will automatically be created in the same dashboard.
Step #5:
Give a descriptive name to the entire Dashboard, e.g., Client Status For Devices
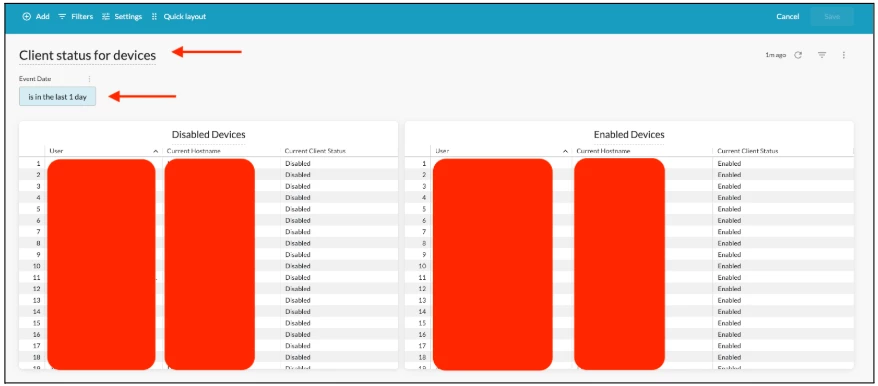
| ℹ️ Note: By tracking the date field, you can identify the device’s status on a specific day (for example, yesterday or any past date). |
How to Schedule the Dashboard
- Open the dashboard you created.
- Click on Schedule delivery, to schedule the dashboard.
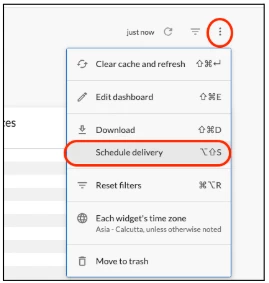
- Set the settings tab as required:
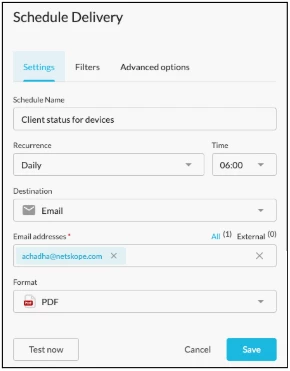
Fields:
- Schedule Name: A name for your scheduled report.
- Recurrence: How often the report will be delivered. Example: Daily, Weekly, Monthly, or custom intervals.
- Time: The time of day when the report will be sent.
- Destination: The method of delivery.
- Email addresses: List of recipients who will receive the report. Add internal or external email addresses.
- Format: The file type of the report. Example: PDF, CSV, etc.
Test now (button): Triggers an immediate test delivery to verify that the report is generated and delivered correctly before saving the schedule.
| ℹ️ Note: |
Terms and Conditions
- All documented information undergoes testing and verification to ensure accuracy.
- In the future, If any such platform changes are brought to our attention, we will promptly update the documentation to reflect them.
Notes
- This article is authored by Netskope Global Technical Success (GTS).
- For any further inquiries related to this article, please contact Netskope GTS by submitting a support case with 'Case Type – How To Questions'.
- ou can follow the same approach to create instances for other applications and manage access restrictions.


