

Hello Folks,
Below you can find a recap of questions asked at the December office hours session and those sent in that we were not able to cover during the session. Feel free to comment and continue the discussion, as well as attend future sessions that can be found on the Community Events Calendar!
Happy New Year!
Q: I’m confused about custom dimensions in Advanced Analytics. Are there any resources I can review to better understand this feature?
A: Yes. You can find a tutorial on custom fields (including custom dimensions) in this training video. This article from Netskope Knowledge Portal can also help.
Q: I’m looking for a tutorial on Netskope Data Loss Prevention (DLP).
A: This article provides a list of resources on Netskope DLP, which can be a great starting point. If you are interested in best practices and a deep dive into this topic, please watch this webinar.
Q: Can I view Chrome versions detected in my organization and how many people are using each of them? Old Chrome versions can bring significant security concerns to us.
A: Absolutely. The Chrome Version Dashboard can help with your use case. With a focus on Google Chrome, this dashboard helps you identify old Chrome versions being used in your environment and the corresponding user/usage details.
Q: I’m looking to understand what app categories are detected in my organization, and if there are any unmanaged apps in any of them. Are there any dashboards I can use?
A: Yes. The Application Category Dashboard can help you with this topic. This dashboard provides visibility into app categories detected in your environment and the corresponding app & instance details. Use this dashboard to better understand what categories are commonly accessed in your environment and if there are any unmanaged/risky apps included.
Q: How can I use Advanced Analytics to provide a list of connected users and the PoPs they are connected to?
A: To view connected users and the PoPs they are connected to, you can create a widget in Application Events with the fields: “Host PoP” and “# Users.” We also have a PoP Usage Dashboard which can directly address this use case.
Q: What are the most important dashboards for Executives?
A: The CASB & NG-SWG Operationalization Dashboard are very important for Executives. These two dashboards help your organization maximize the ROI of your Netskope investment by highlighting ways to ensure you are using Netskope products to their full potential.
We also recommend our Reduction of Risk Dashboard. This dashboard helps you understand how Netskope is protecting your environment by quantifying risk reduction in $ as an impact to revenue and profit margin.
Q: How can I consolidate information from numerous dashboards to get a baseline and complete security status posture?
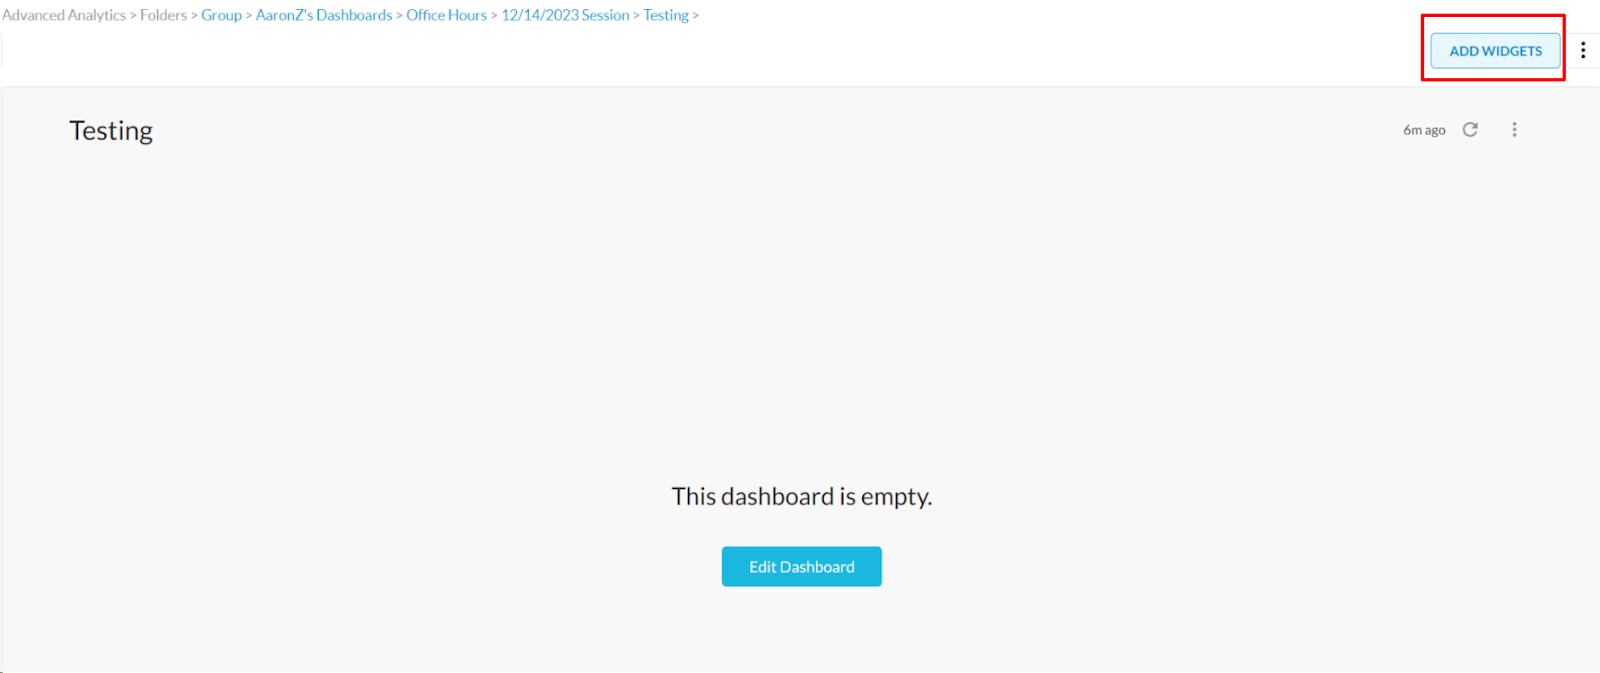
A: When building a dashboard, you don’t have to create everything from scratch. We provide many widgets which can directly be used in your dashboard. There are two ways to add widgets to your dashboard. If you want to add existing widgets to a dashboard, click the “ADD WIDGETS” button on the top right corner.
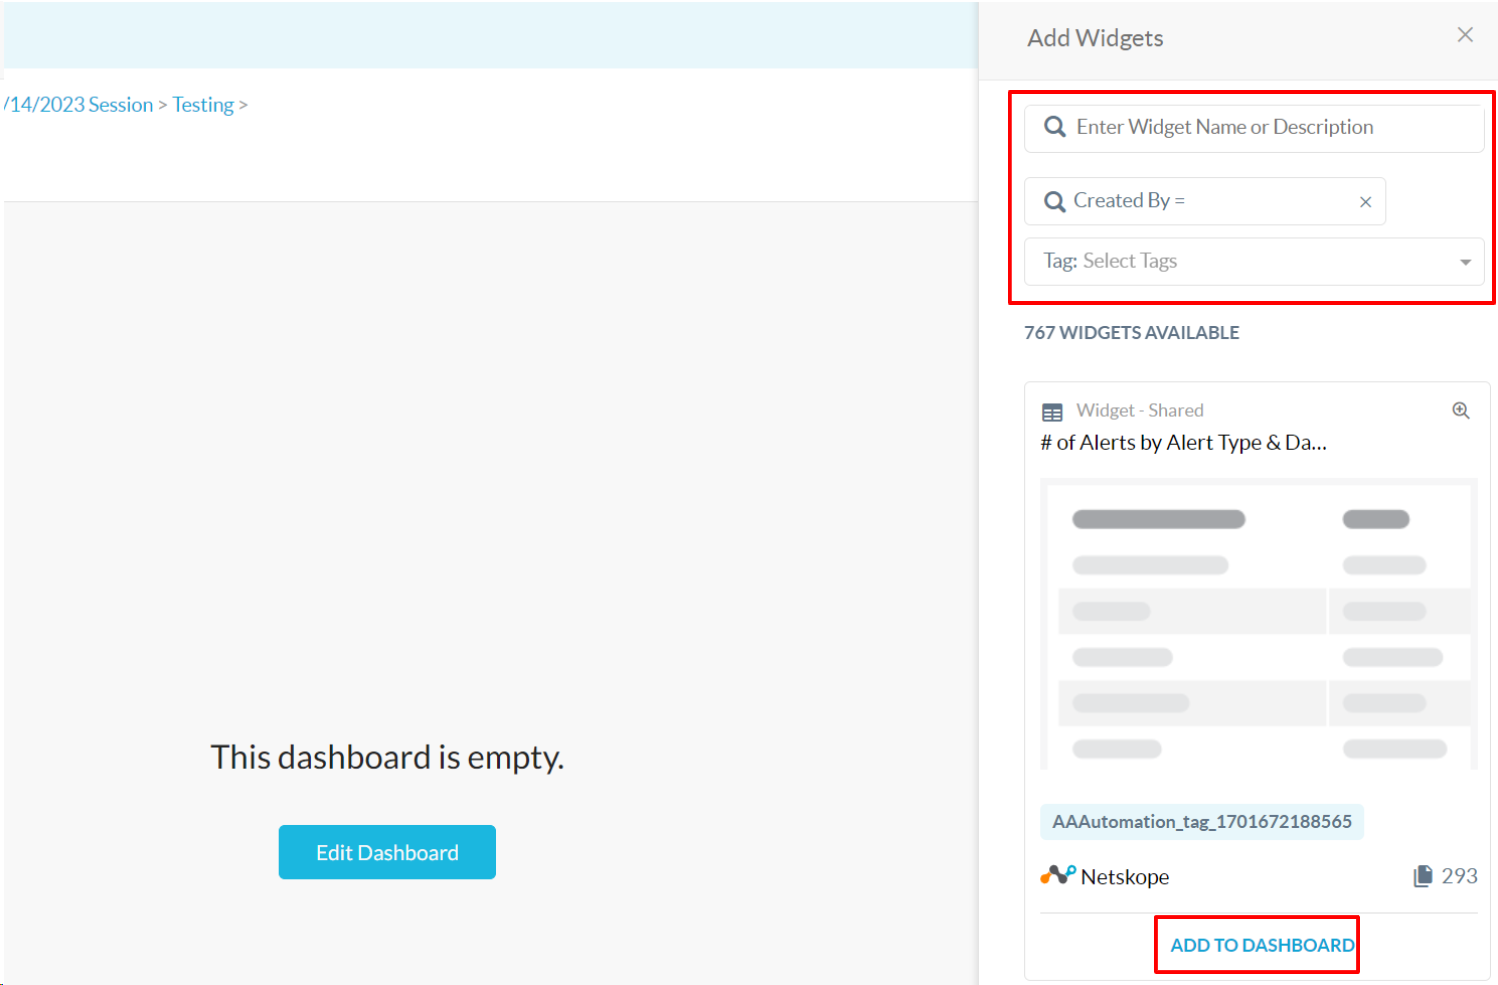
You will then be able to search your preferred widgets by widget name, creator, and tags. Hit “ADD TO DASHBOARD,” the widget will be added to the current dashboard.
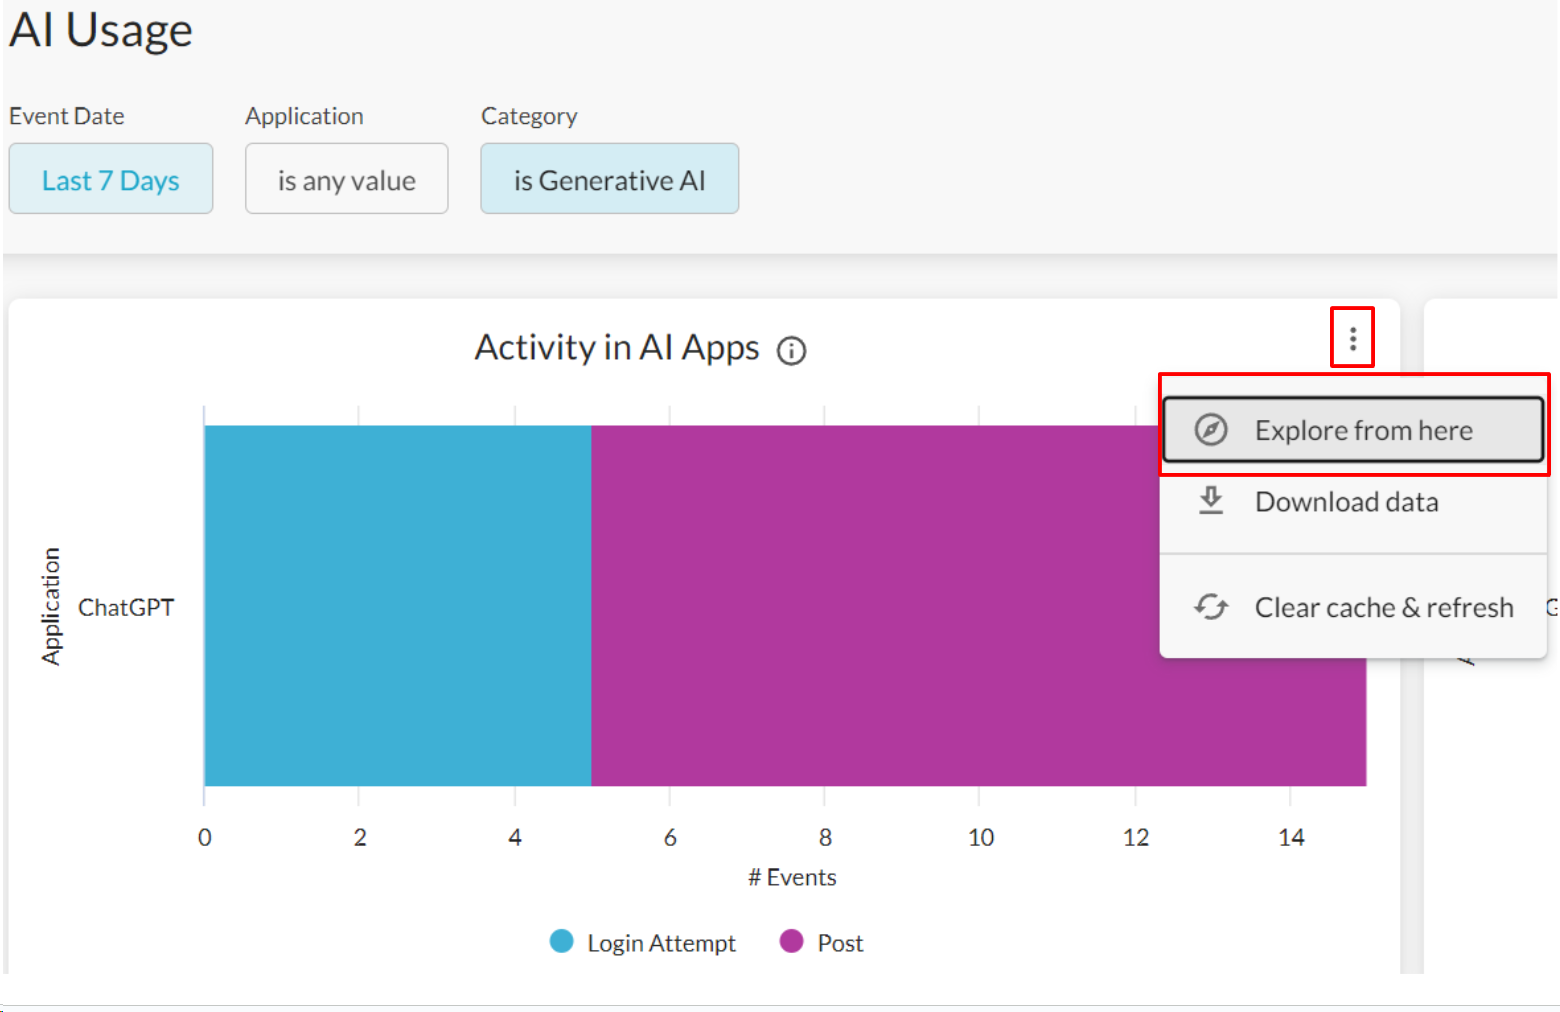
You can also copy a widget from a predefined dashboard to your own dashboard. To do this, navigate to your preferred widget, click the 3-dot button and hit “Explore from here.”
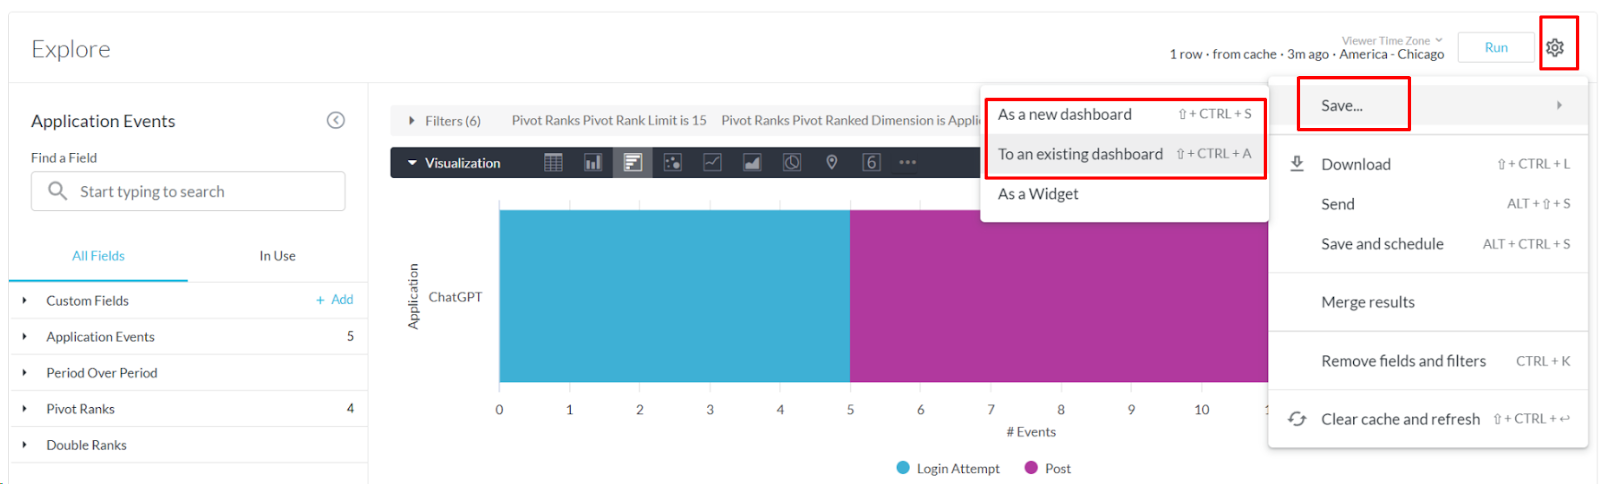
You will then be directed to the “Explore” window of this widget. Click the gear button and hit “Save,” you can now choose to save the widget “to an existing dashboard” or “as a new dashboard.”
Q: I want to create a widget of all users with 1000+ alerts and schedule it to be delivered on a daily basis. How can I do this in Advanced Analytics?
A: Once the widget is created, you can do this by “conditionally” scheduling it to be delivered. Detailed instructions can be found in this post.
Q: We have API Connector into One Drive and I’d like to see how Advanced Analytics can help with data exfiltration reports on targeted users. We need a report which provides evidence showing files/objects accessed or shared.
A: The “Suspicious Data Movement” widget from User Behavior Analytics (UBA) Dashboard in Netskope Library detects accidental or intentional data exfiltration, which can be a good starting point. The widget identifies suspicious data movement from corporate sanctioned application instances to personal or non-corporate applications/sites.
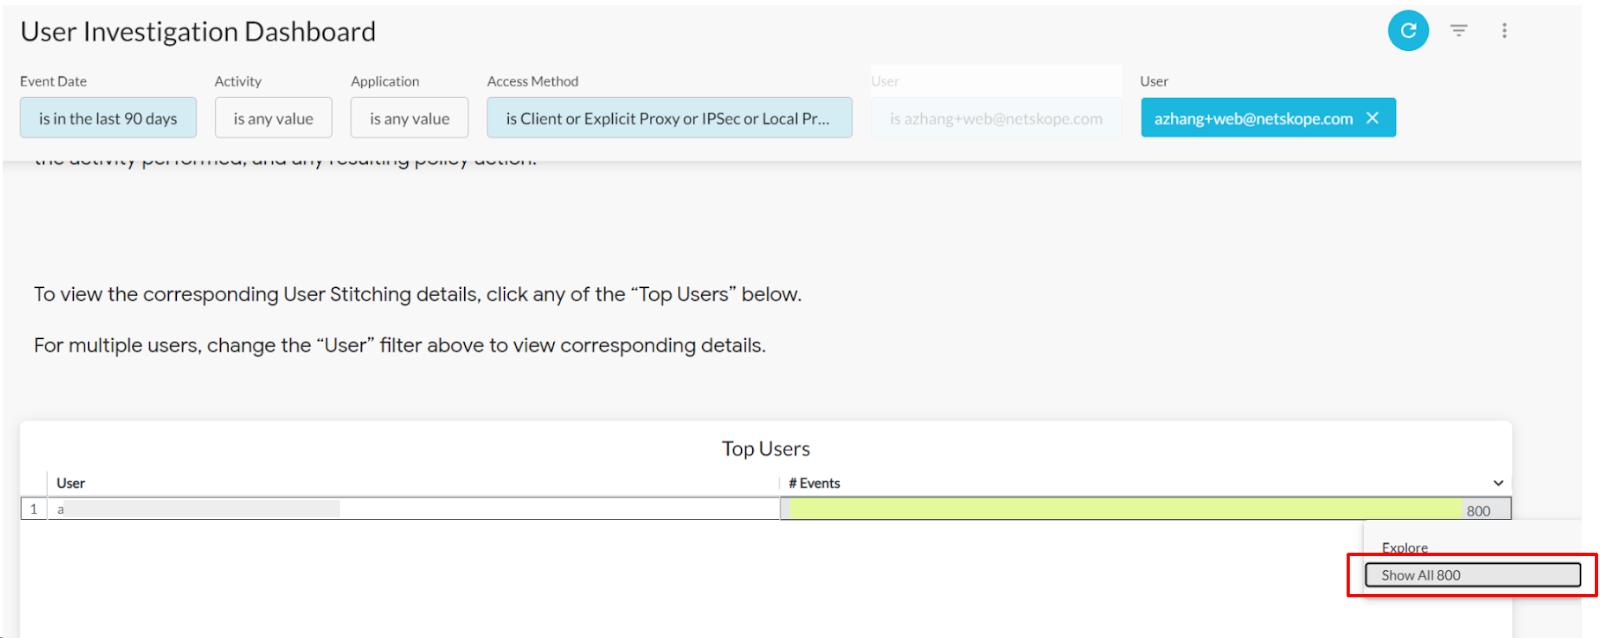
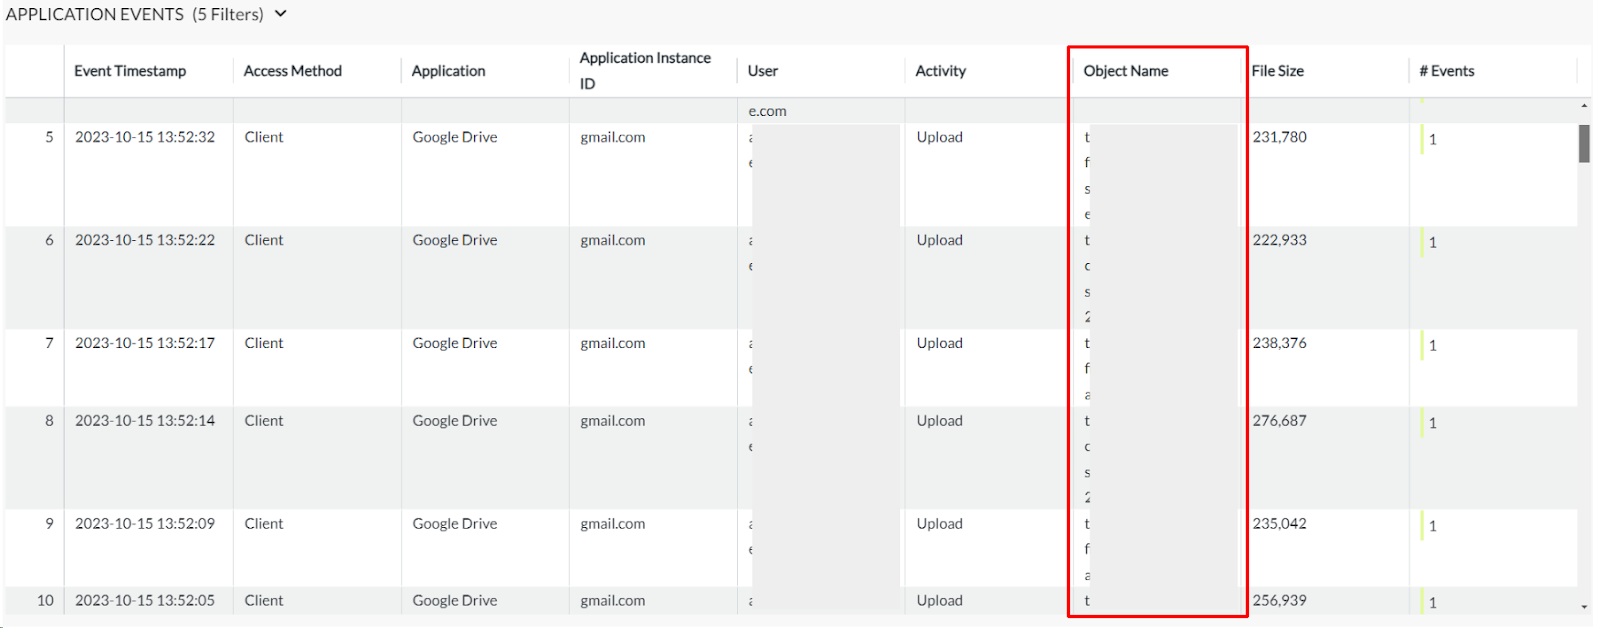
If you want detailed visibility into user activities, we recommend starting with the User Investigation Dashboard in Netskope Library. By drilling into the events, you will be able to view files/objects accessed or shared.
If you are interested in data movement to unmanaged applications and non-corporate instances, this Risky Data Movement Dashboard can help.


