

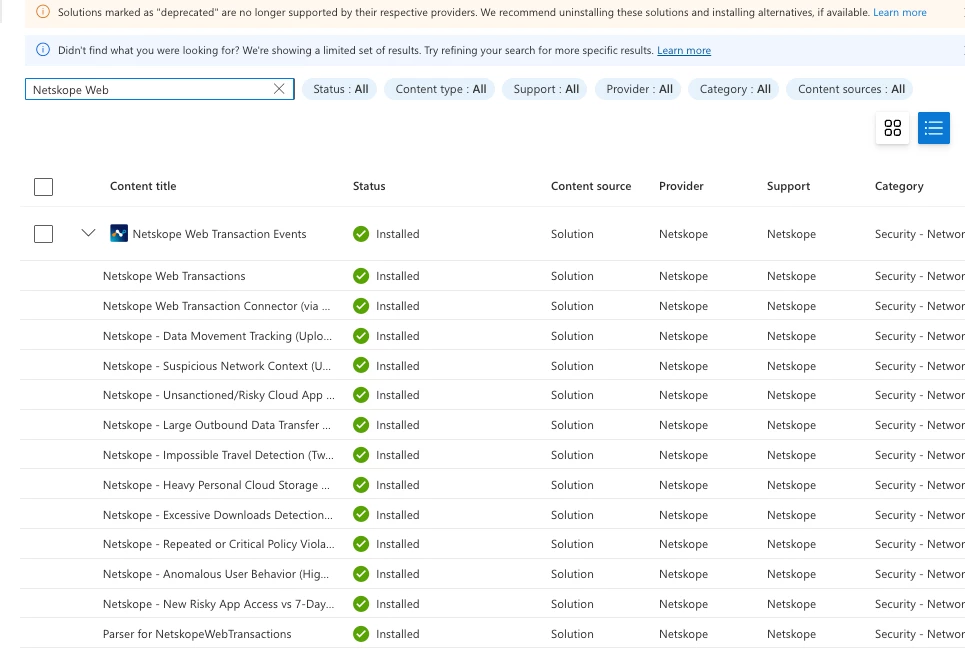
Netskope has officially published the Web Transaction connector on Azure Sentinel Content hub. You can avoid the template deployment steps.
⚠️ Important: You can't restrict network access to your Azure Blob Storage account as per the official guidance from Microsoft
This document outlines the seamless integration of Netskope Web Transaction Logs with Microsoft Sentinel using the Codeless Connector Framework (CCF). This native integration provides near real-time visibility for effective threat hunting and incident management. To configure Netskope Log Streaming to send logs to your Blob storage please go through the article: https://docs.netskope.com/en/stream-logs-to-azure-blob
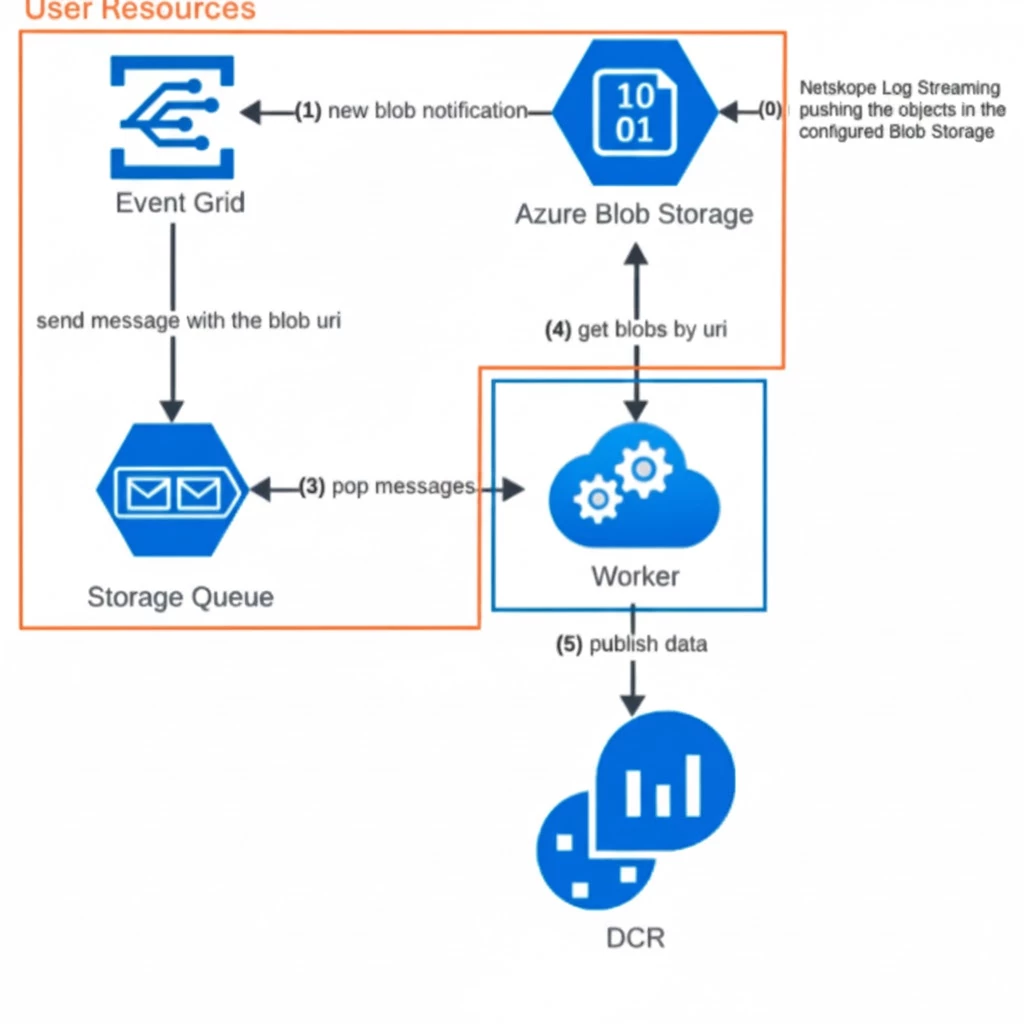
🏗️Integration Architecture Overview
The integration leverages several Azure services to ensure reliable and scalable log delivery:
-
Netskope to Azure Storage Blob: Netskope pushes Web Transaction Logs (and Alerts/Events) into a customer-owned Azure Storage Blob Container.
-
Event Grid Notification: Every time a new file (blob) is written, an automatic notification is sent to Azure Event Grid.
-
Storage Queue Messaging: Event Grid pushes the blob URI to a Storage Queue. This acts as a work queue for the connector.
-
Microsoft Sentinel CCF Connector (Scuba Workers): These connectors continuously pull (pop) messages from the Storage Queue.
-
Data Ingestion: The Scuba workers retrieve the data from the Blob Storage, process it, and ingest it into the Log Analytics Workspace via a Data Collection Rule (DCR).
-
Log Analytics: The Netskope Web Transactions and Events appear in the specified Log Analytics table within Microsoft Sentinel.
This blog explores how this new integration seamlessly pulls in near real time all of your organizations Web Transactions to a single Log Analytics table.
🔒 Prerequisites
To successfully deploy the custom template and configure the Netskope Data Connector, the user or Service Principal performing the steps must have the following minimum permissions assigned:
1. Configure Netskope Log Streaming to Azure
Follow the documentation: Stream Logs to Azure Blob - Netskope Knowledge Portal for the Netskope Log Streaming configuration to Azure
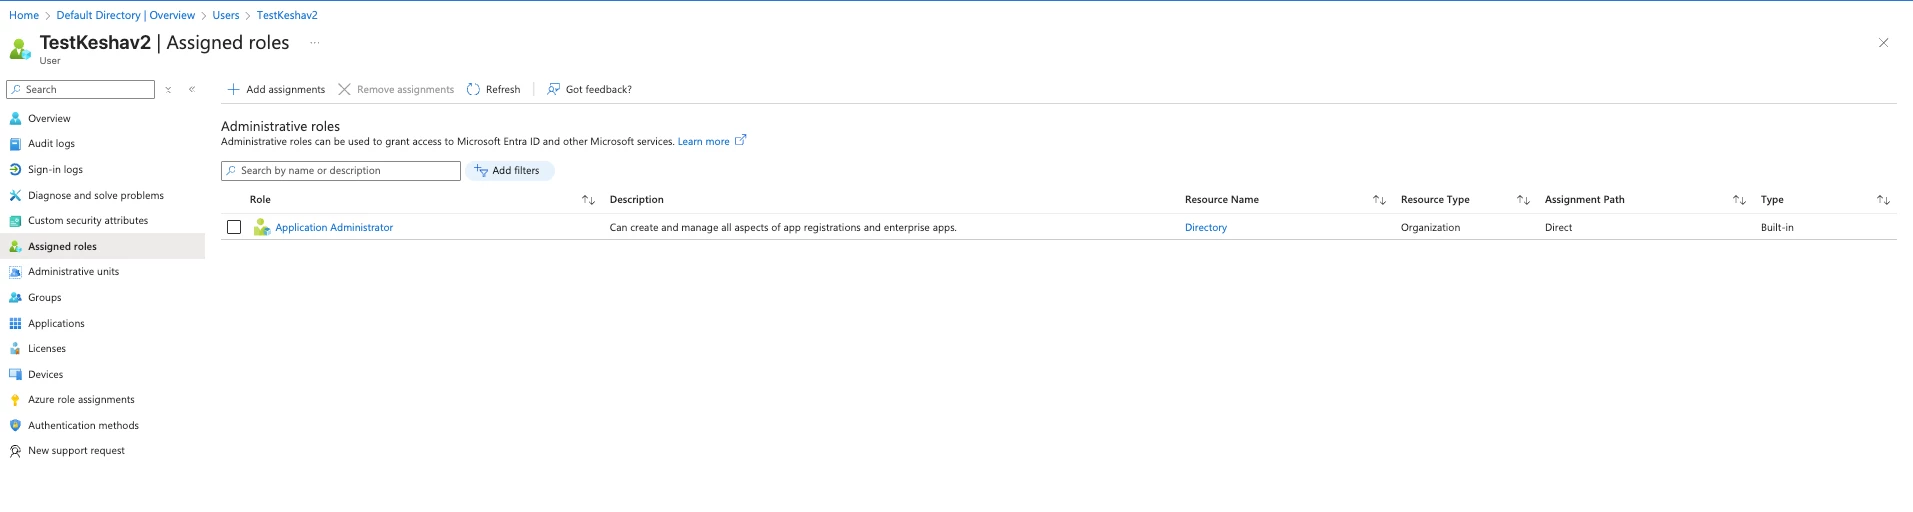
2. Microsoft Entra ID (Tenant-Level Role)
The deployment process involves working with Enterprise Applications (Service Principals) to set up the connector.
| Role | Scope | Required Action | Minimum Prerequisite Role for Assignment |
| Application Administrator | Microsoft Entra ID (Tenant) | Required to create, manage, and configure all aspects of application registrations and Enterprise Applications (Service Principals). | Privileged Role Administrator |
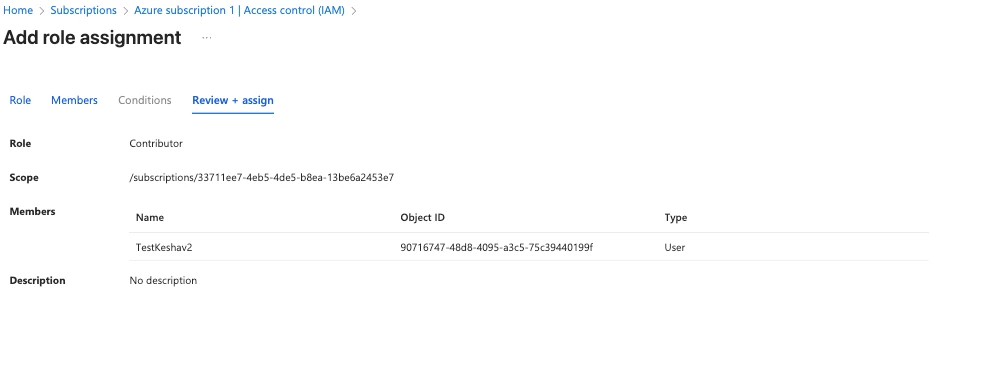
3. Azure Role-Based Access Control (Subscription-Level Role)
The connector deployment uses an ARM template that creates several Azure resources (Data Collection Rule, Event Subscription, etc.) and requires the ability to deploy resources.
| Role | Scope | Required Action | Minimum Prerequisite Role for Assignment |
| Contributor | Azure Subscription | Grants full access to manage all resources (including deploying the ARM template and creating required resources), excluding the ability to assign roles (like Owner/User Access Administrator) to others. | Owner or User Access Administrator (at the same scope) |
4. Microsoft Sentinel-Enabled Log Analytics Workspace
You must have a Log Analytics workspace with Microsoft Sentinel enabled. If you don't have one, create it first: Onboard to Microsoft Sentinel | Microsoft Learn
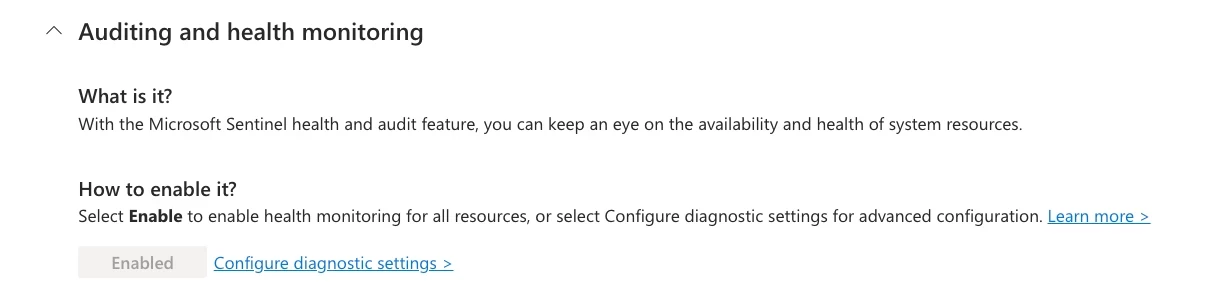
5. Enable Auditing & Health Monitoring
Make sure to turn on Auditing & Health Monitoring for the Azure Sentinel: https://learn.microsoft.com/en-us/azure/sentinel/enable-monitoring?tabs=defender-portal. This will help us to get to the root cause of the issue.
🚀 How to Enable the Integration
Netskope’s native integration simplifies log shipping with minimal deployment overhead. Follow these steps to enable the connector:
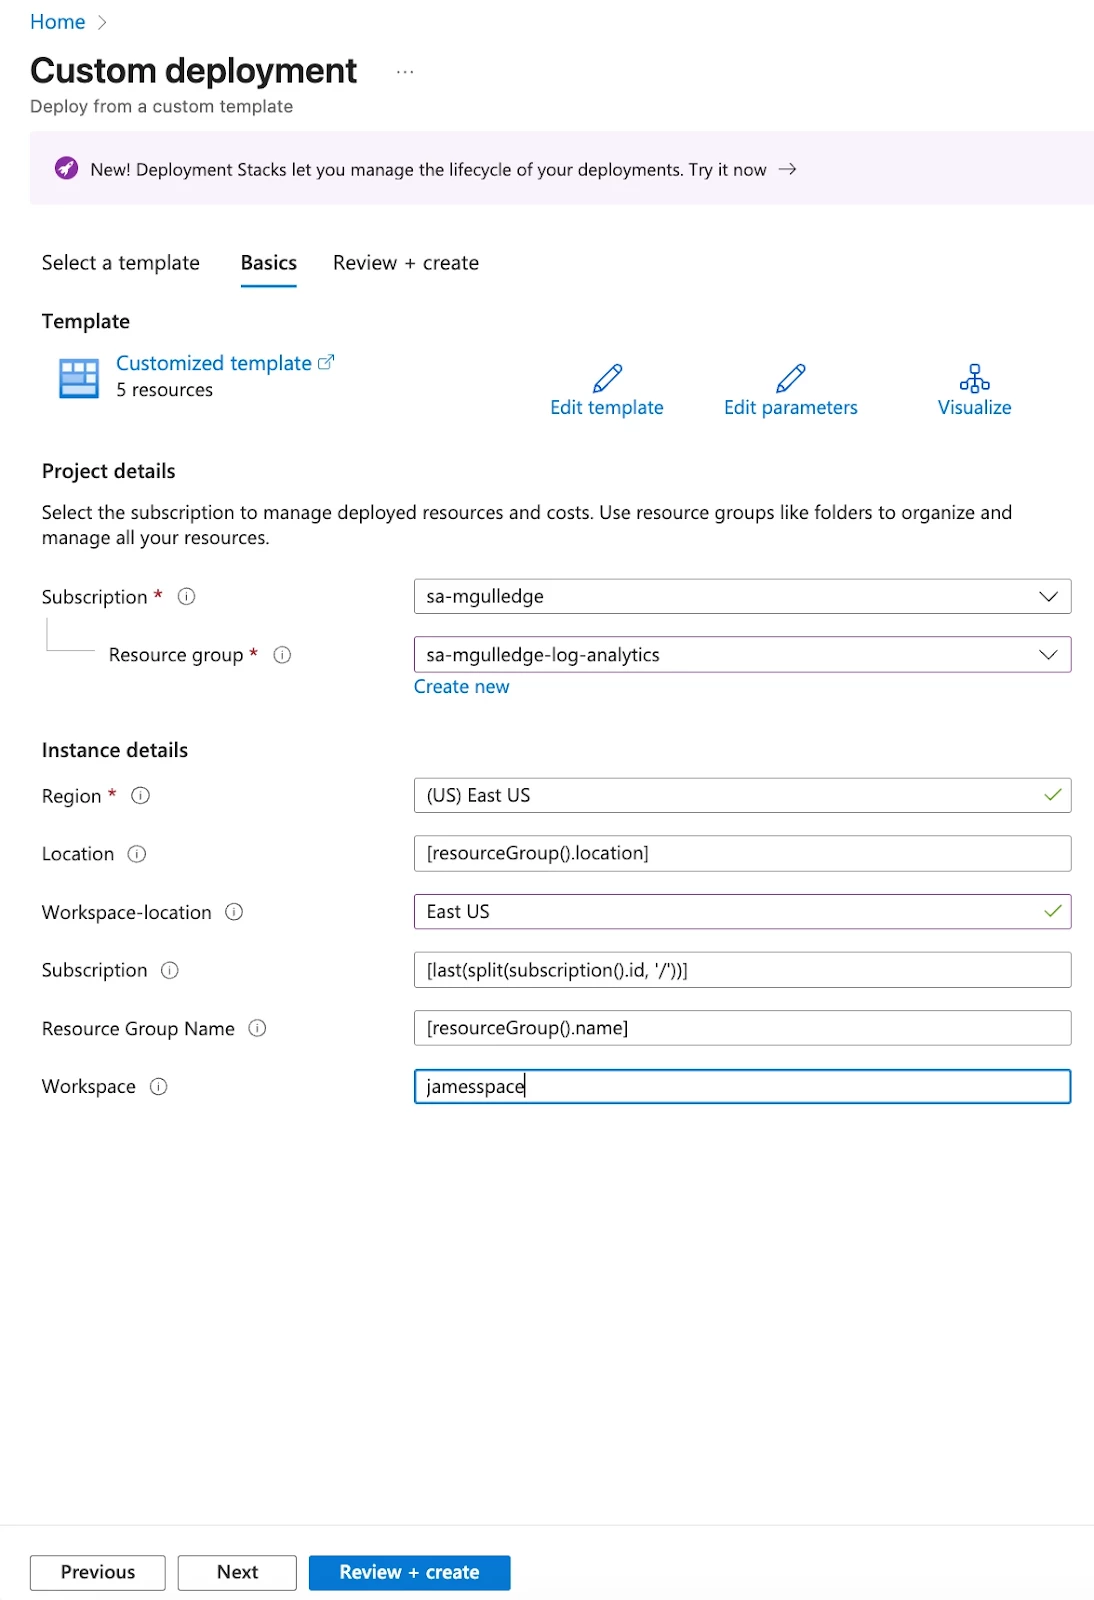
1. Deploy the Azure Sentinel Connector Template
-
Navigate to the Azure Portal.
-
Search for and select Deploy a Custom Template.
-
Select Build your own template in the editor.
-
Paste the following JSON file URL into the editor:
-
Click Next.
-
Fill in the required deployment parameters (Workspace Location, Region, and Resource Group where your Sentinel instance is located).
-
Click Review + Create and then Create to deploy the necessary Azure resources (Event Subscription, Storage Queues, Data Collection Rule, etc.).
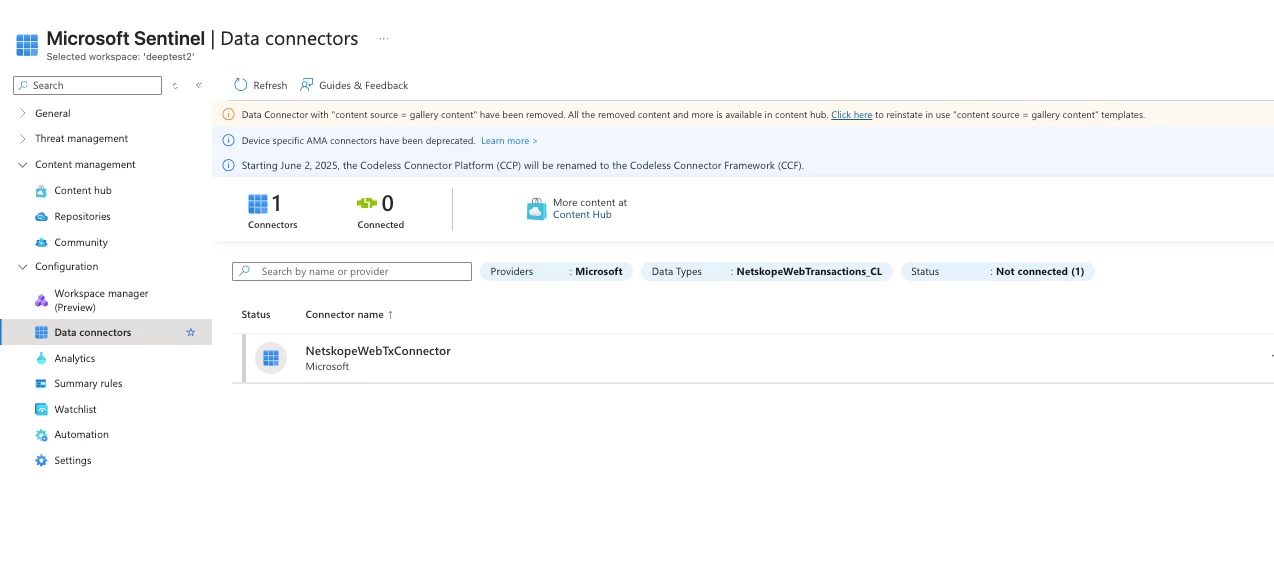
2. Configure the Data Connector in Sentinel
-
Navigate to your Microsoft Sentinel Instance.
-
Under Content management, select Data Connectors.
-
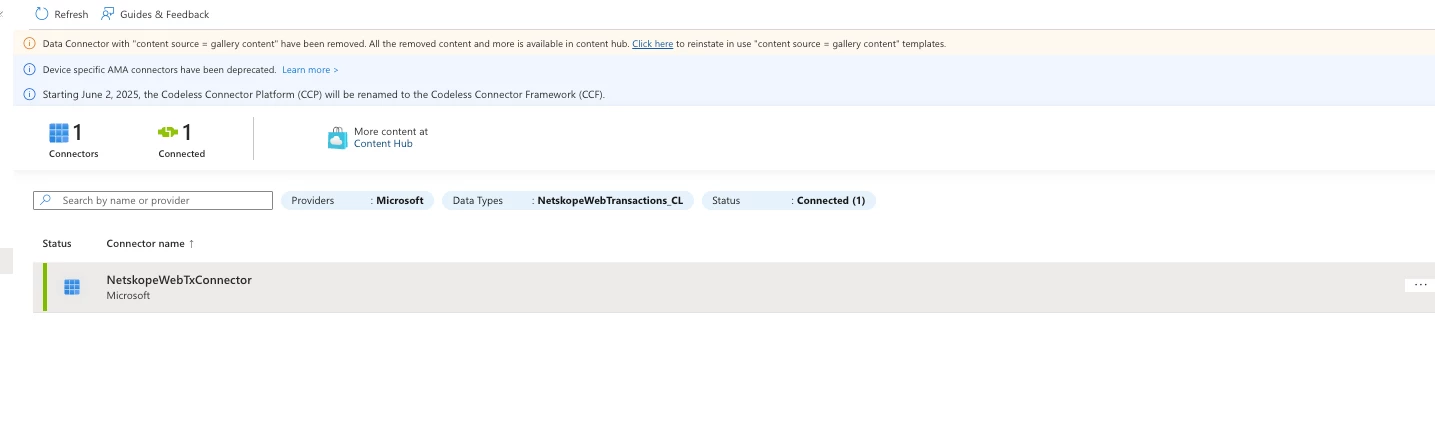
Locate the new connector named NetskopeWebTxConnector.
-
Select Open connector page.
-
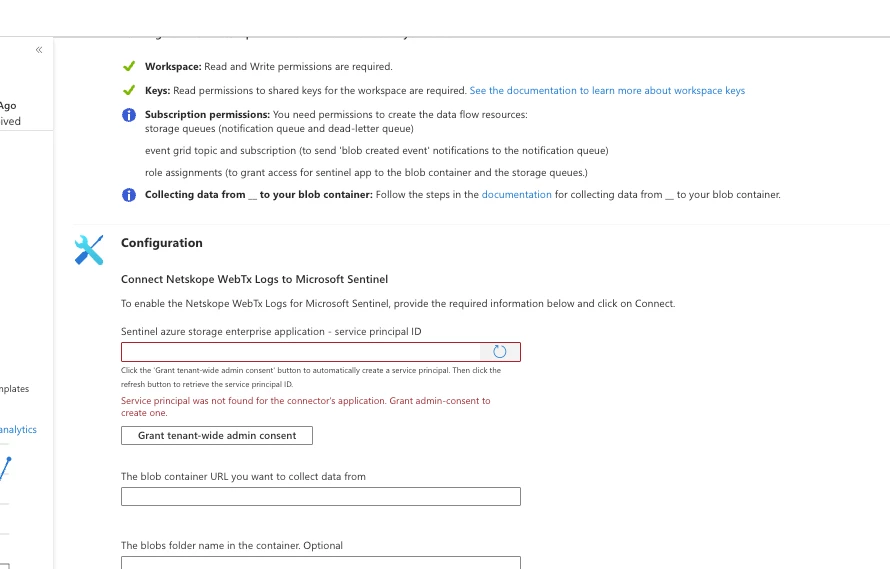
Fill out the required parameters:
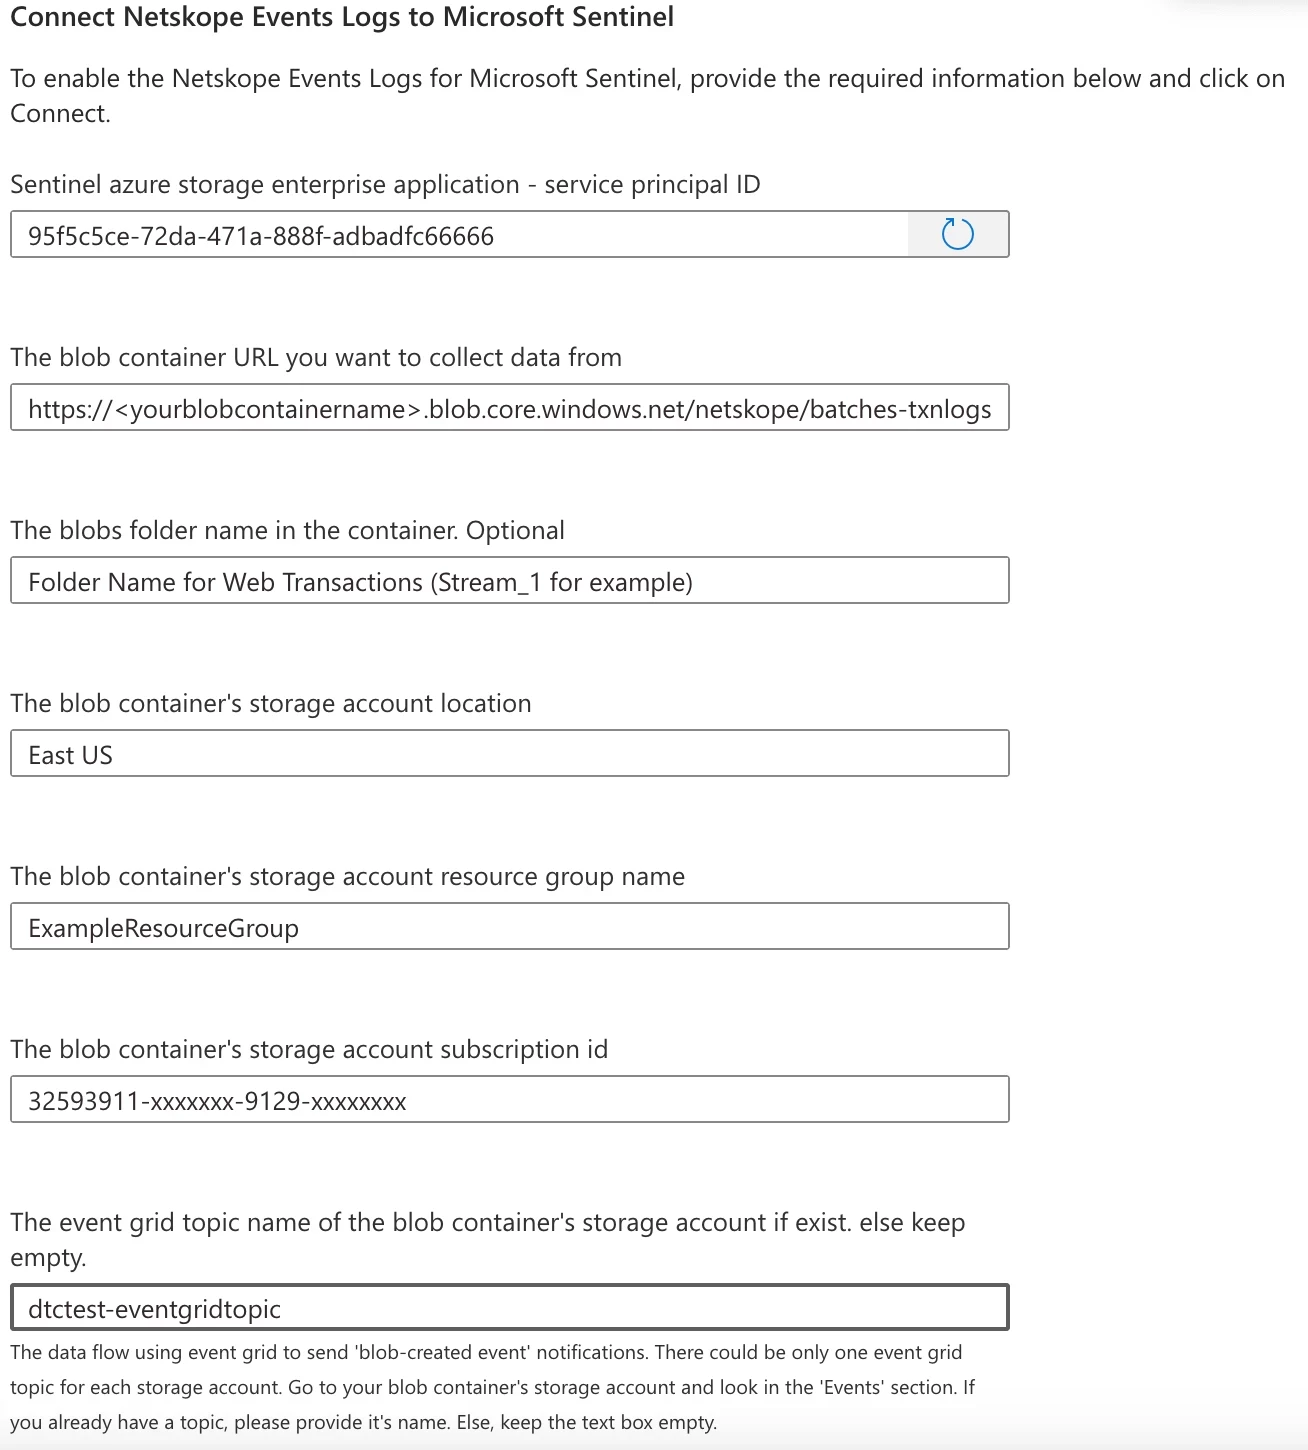
| Parameter | Description |
| Sentinel azure storage enterprise application - service principal ID | Grant the tenant Admin access to the Service Principal for the creation of Service Principal. If the ServicePrincpal already existing it will be auto populated with values. |
| The blob container URL you want to collect data from | The full URL of the Netskope container (e.g., https://[storageaccountname].blob.core.windows.net/[containername]). |
| The blob container's storage account location | The Azure region of the Storage Account. |
| The blob container's storage account resource group name | The Resource Group name of the Storage Account. |
| The blob container's storage account subscription id | The Azure Subscription ID of the Storage Account. |
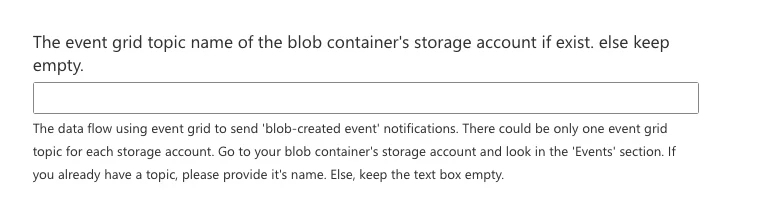
| The event grid topic name of the blob container's storage account | If an Event Grid Topic exists for the Storage Account, enter its System Topic name. If not, keep this empty. You can find the existing System Topic Name under Events in the particular Blob Storage. |
If the ServicePrincipal doesn’t exist. It will show something like below and grant the tenant admin consent.
It will create the ServicePrincipal something like below. The details related to ServicePrincipal will be auto populated as shown in other screesnshot.


-
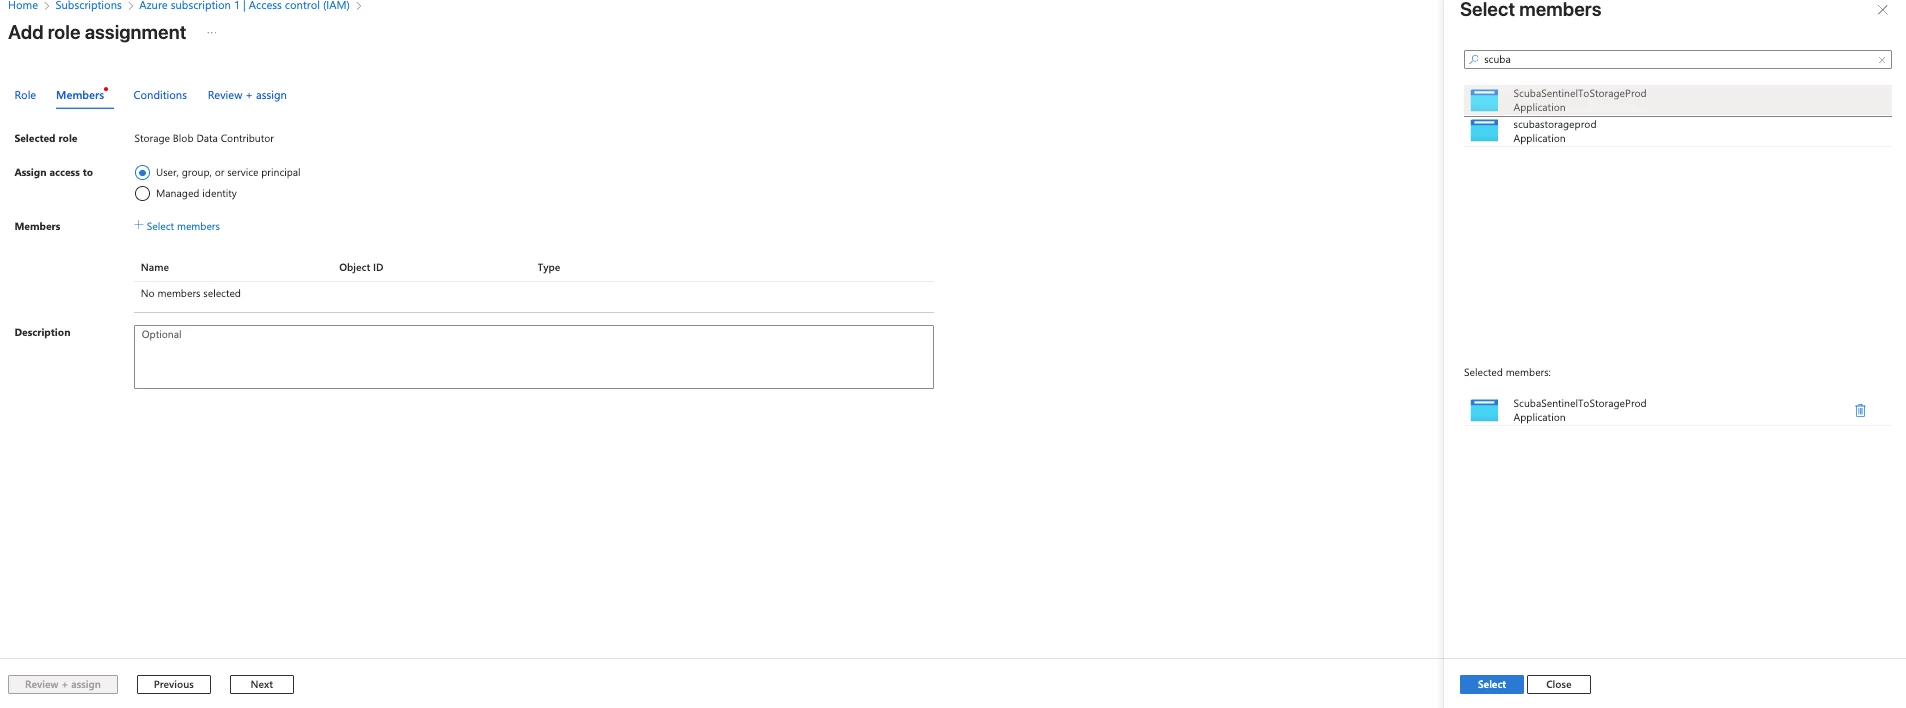
Before clicking on connect assign the Storage Blob Data Contributor and Storage Queue Data Contributor at the ServicePrincipal Level.
-
Click Connect to finalize the integration.
📝 Note: Data will typically begin appearing in your Log Analytics workspace within 20 minutes after successful connection.
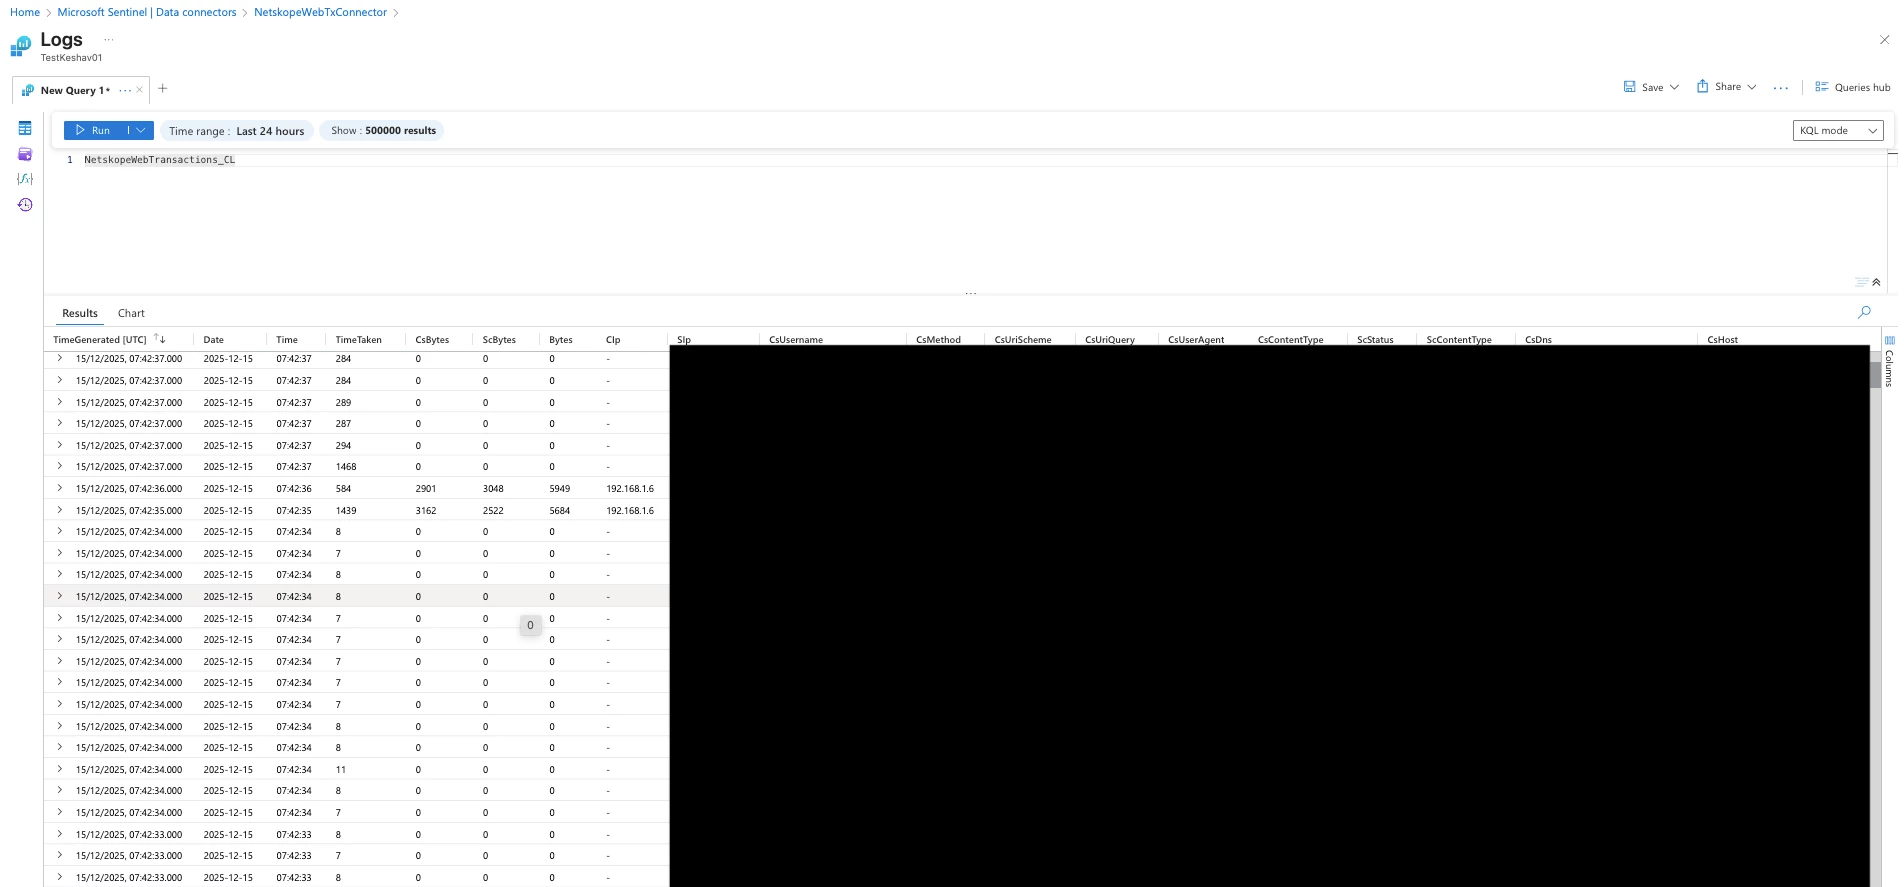
- After connection you can check out the data in the Table: NetskopeWebTransaction_CL
Workbook & Analytics Rules
For Workbook and Analytics Rules creation. Please follow the article:
Troubleshooting:
- Perform all the steps below first in a "clean room" environment. That is, create a new resource group which contains only the minimal # of resources: Sentinel-enabled Log Analytics workspace, a Storage Account, and a Blob Container with expected name.
- Ensure diagnostics logs are enabled on the Sentinel Workspace. Do this before anything else.
- Deploy ONLY ONE Netskope Log Streaming Blob solution template into this workspace. Check resource group deployments to ensure that it deployed without error. After deploying, if you make any changes to the solution template, start over from step 1 in a new clean resource group.
- Connect the connector. Use the storage account in the same resource group as the Sentinel Workspace. In case of Netskope connector, leave event grid topic blank, and be sure to set a folder name.
- Check resource group deployments to ensure that it deployed without error.
- Check that the storage account has an "Microsoft.Storage.BlobCreated" Event Subscription, with expected prefix folder.
- Click into the Event Subscription details. Ensure the "Endpoint" is {name}-notification
- Check that the Storage account has two queues, {name}-dlq and {name}-notification.
- Check the role assignments on each queue. Ensure expected App Registration (e.g. "ScubaSentinelToStorageProd" has Storage Queue Data Contributor role. You can verify it's the correct app by clicking on its name, and comparing Object ID on the "Enterprise Application Overview" page with the Service Principal ID in the connector deployment page.
- Manually add a piece of test data to the blob container. Be sure the data is formatted correctly, as the DCR will expect it, is in correct format (e.g. .csv.gz), and is in expected folder.
- Ensure the blob was added in the correct folder, with the expected name.
- Check the metrics on Events page for Storage Account. Look for Published Events and Delivered Events to jump up to 1. Refresh as needed.
- Check the {name}-notification queue quickly. Look for a message to arrive in that queue with folder and file name matching the file you just added. Refresh regularly for a few minutes, could be up to 10. The event should disappear from the queue because it has been picked up by the connector.
- Check the metrics for the DCR. Look for "Log Ingestion Requests per minute" to come up.
- Check the Sentinel Logs, run a simple KQL query for just the table name. Look for matching data to come up.
- Visit the connector page. Look for green status, and indication that "last log received" was recently.
- Repeat steps 10-15 a few more times.
- Now turn on your blob data source, and repeat steps 11-15.
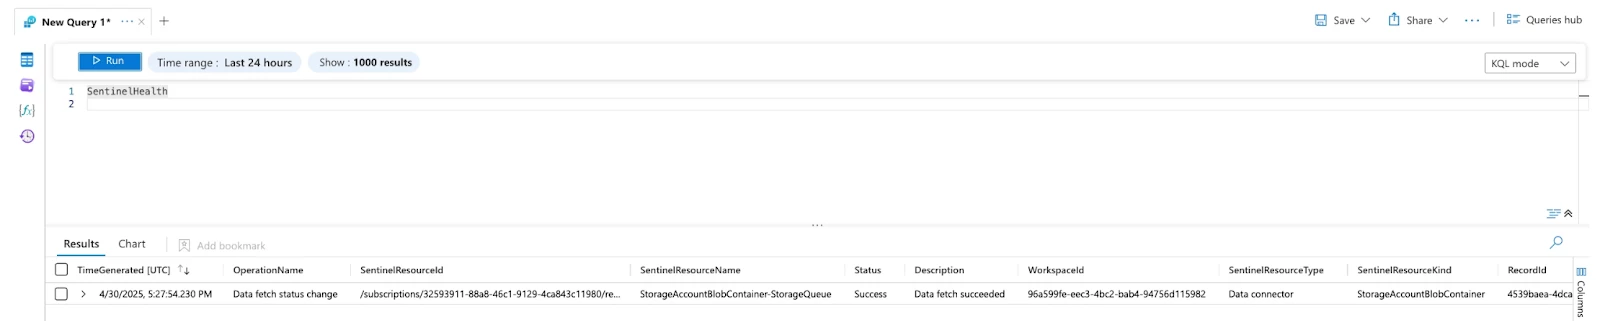
- Problems? Check the SentinelHealth table for clues.
Common Errors:
-
If you see the error: Deployment Failed At least one resource deployment operation failed. Please list deployment operations for details. Please see https://aka.ms/arm-deployment-operations for usage details.
{ "error": { "code": "BadRequest", "message": "Connectivity check failed. ConnectorId: NetskopeWebTransactions, Status code:S3B40010, Message:An unknown exception occurred." } } - The issue is mainly due to missing role assignment to the ServicePrincipal or ServicePrincipal not created properly or Blob storage is enabled from selected network and Scuba IPs are not whitelisted. All the above steps are already covered in the above documentation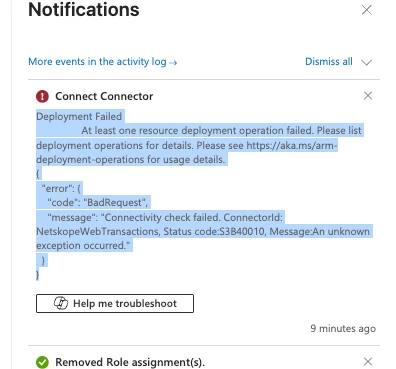
- Failed to create required resources for data connector Invalid output table schema {0}: The following columns which exist in the current schema do not exist in the new schema or have different types : {1} - This kind of error are seen when you have done some changes in the template schema or directly in your environment which can lead to the above error.
- If you see the errror: { "code": "BadRequest", "message": "{\r\n \"error\": {\r\n \"code\": \"InvalidRequest\",\r\n \"message\": \"System topic source cannot be modified.\"\r\n }\r\n}" - Your system topic is already existing. Copy the existing system topic name from the Blob Storage > Events.
Change Logs:
- Updated the template to only deploy the connector. Now all the role assignment need to be done manually as the role assignment needs owner level access and delay steps which were earlier being used for the role assignment have been removed as this was causing issue in some of the customer environment while deploying.
- Above documentation has been fully updated to the new flow and capture some new update with the same.
- Additionally if the customer have firewall enabled from their particular blob storage they can use scuba IPs whitelisting step with the script for whitelisting 100s of Microsoft Scuba IPs. The Same Script has been uploaded to the same github repo and link for the same has been attached to the above docs.
- Recently a lot of errors were seen related to the Bad request during performing connection. The error didn’t have any details but we have captured what could have been missing which have caused the issue. Also captured the other kind of errors seen while deploying or after deploying the template
- Added the link to Workbook and Analytics Rules Article. Additionally updated the warning related to the Network restriction


