

Hello Folks,
Below you can find a recap of questions asked at the January office hours session and those sent in that we were not able to cover during the session. Feel free to comment and continue the discussion, as well as attend future sessions that can be found on the Community Events Calendar!
Q: I’d like to know which recommended training we should take in a structured manner to get started with Advanced Analytics.
A: We highly recommend starting with the NAA Training Resources post in our community. The post points you to a list of resources which can help you quickly get started with Advanced Analytics. If you are looking for some recommended dashboards to start with, the NAA Top Dashboards post will be a good choice.
Q: I want to make sure we are using Netskope products effectively. Can I leverage Advanced Analytics on this?
A: Yes. The CASB & NG-SWG Operationalization Dashboard are two good starting points. With focus on CASB & NG-SWG, these two dashboards help your organization maximize the ROI of your Netskope investment by highlighting ways to ensure you are using Netskope products to their full potential.
Q: Can I get actionable insights on Netskope agent device management (i.e. disabled agents) using Advanced Analytics?
A: The upcoming Device/Client Data can help you with this by providing visibility into Netskope Client Installation Time, Client Status, Client Version, and Device/User Info, etc. More details can be found here. Currently, the Device/Client Data is still being tested. Please reach out to your account team if you want the data to be enabled for your organization.
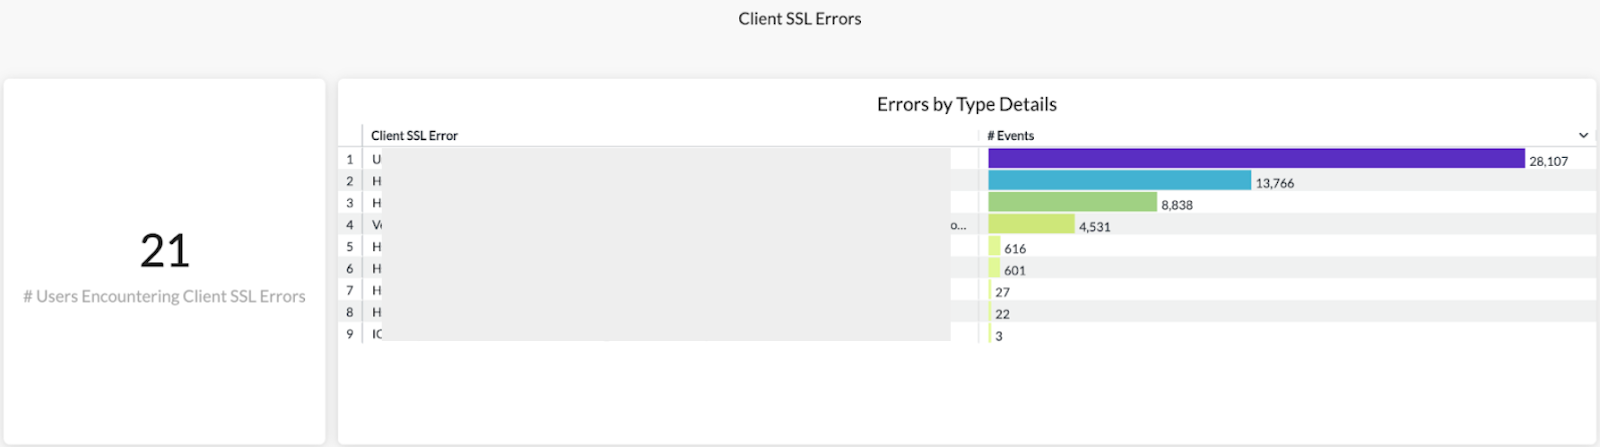
Q: How can we identify Netskope Client error status within Netskope console or Advanced Analytics?
A: If you are looking for visibility into Netskope Client SSL errors, please check out the Web Transaction SSL Errors Dashboard in Netskope Library. The Client SSL Errors section of the dashboard will help you with this topic.
If you are looking for a general overview of Client event history, in your Netskope UI, please go to Settings -> Security Cloud Platform -> Devices, and then select a device for event history.
Q: I’m looking to understand what app categories are detected in my organization, and if there are any unmanaged apps in any of them. Are there any dashboards I can use?
A: Yes. The Application Category Dashboard can help you with this topic. This dashboard provides visibility into app categories detected in your environment and the corresponding app & instance details. Use this dashboard to better understand what categories are commonly accessed in your environment and if there are any unmanaged/risky apps included.
Q: Can Netskope integrate with Darktrace?
A: Yes. The integration allows Netskope to share its data with Darktrace, including information about user activity, cloud applications, and network traffic. This information can be used by Darktrace to detect threats that may not be visible to Netskope alone. Please reach out to your account team if you need help in technology integrations. More information can be found here.
Q: What should a CXO Dashboard look like?
A: To build up a CXO Dashboard, the CISO Dashboard in Netskope Library can be a good starting point. It helps your organization, especially upper management, digest the key performance indicators of your organization's security program. The CASB & NG-SWG Operationalization Dashboard can also help.
Q: How to take advantage of Advanced Analytics in threat mitigation?
A: We recommend starting with the Threat Protection Dashboard in Netskope Library. The dashboard provides visibility into Inline Malware Blocks, Malicious Site Detection, and Threats Detected by IPS.
Q: How can I start analysis of my environment using Advanced Analytics to create the risk management plan?
A: To perform general analysis of your environment, you can start with the Cloud Risk Assessment - QBR Dashboard in Netskope Library. This dashboard provides a high-level overview of your environment, including visibility into cloud traffic, high risk user activities, and cloud threats, etc.
Q: What is the difference between Application Events and Page Events?
A: Application Events provide information about a user’s interaction with an application, like Login, Logout, Upload, Download, Share, and so on. Page Events capture the view of a user accessing the Web. The bytes information in the Page Events may or may not reflect the application activity details.
Q: Are there any dashboards that can help with Zero Trust Architecture?
A: If you are using Private Access for Zero Trust Network Access (ZTNA), the Private Application Overview Dashboard in Netskope Library can be a good starting point. This dashboard helps you better understand how users in your environment are using ZTNA.


