

Introduction
Once you have deployed the Netskope Web Transactions connector and data is flowing into Microsoft Sentinel, the next step is to unlock the full value of your security data through visualization and automated threat detection.
This guide covers the deployment of two essential components:
- Netskope Web Transactions Workbook — A comprehensive dashboard providing visibility into user activity, application usage, traffic patterns, and security insights
- Netskope Analytics Rules — 10 pre-built detection rules covering impossible travel, data exfiltration, Shadow IT, policy violations, and more
Prerequisites
Before proceeding, ensure you have:
| Requirement | Description |
| Netskope Connector | Data connector deployed and showing "Connected" status |
| Data Flowing | Logs appearing in NetskopeWebTransactions_CL table |
| Permissions | Microsoft Sentinel Contributor role (minimum) |
| Historical Data | Some rules require 7 days of baseline data |
💡 Verify Data Flow: Run this query before proceeding to confirm data is available:
NetskopeWebTransactions_CL | where TimeGenerated > ago(1h) | count
Part 1: Netskope Web Transactions Workbook
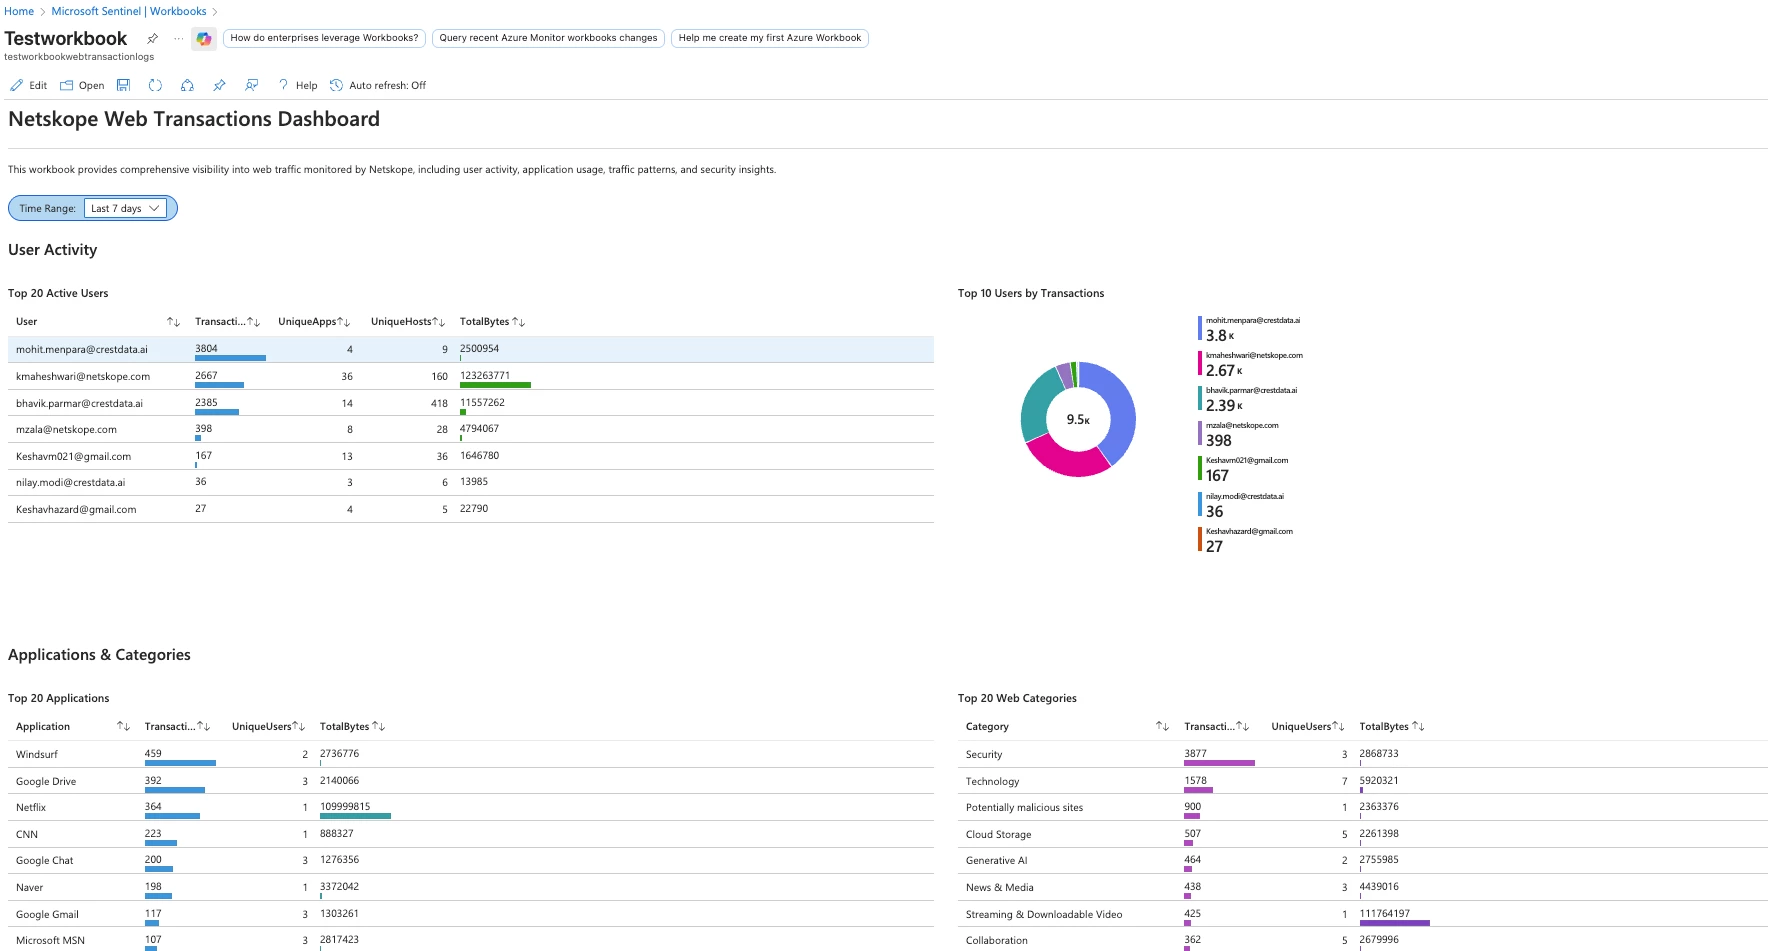
The workbook provides a comprehensive dashboard for analyzing web traffic monitored by Netskope. It transforms raw log data into actionable insights through interactive visualizations.
Workbook Features
| Section | Visualizations | Use Cases |
| User Activity | Top 20 active users, transaction counts, pie charts | Identify high-activity users, investigate behavior |
| Applications & Categories | Top 20 apps, web categories, distribution charts | Shadow IT discovery, app usage analysis |
| Geographic Analysis | Traffic by source/destination country | Geo-anomaly detection, compliance monitoring |
| Traffic Trends | Time-series charts, hourly patterns | Baseline establishment, anomaly identification |
| Security Insights | Policy actions, risky apps, blocked traffic | Policy effectiveness, risk assessment |
| Data Transfer | Upload/download volumes, top hosts | Data exfiltration monitoring, bandwidth analysis |
| SSL Analysis | SSL errors, bypass events, certificate issues | TLS inspection troubleshooting, security gaps |
| Transaction Logs | Detailed log table with filtering | Investigation, forensic analysis |
| Data Quality | Duplicate transaction analysis | Data integrity monitoring |
Deploy the Workbook
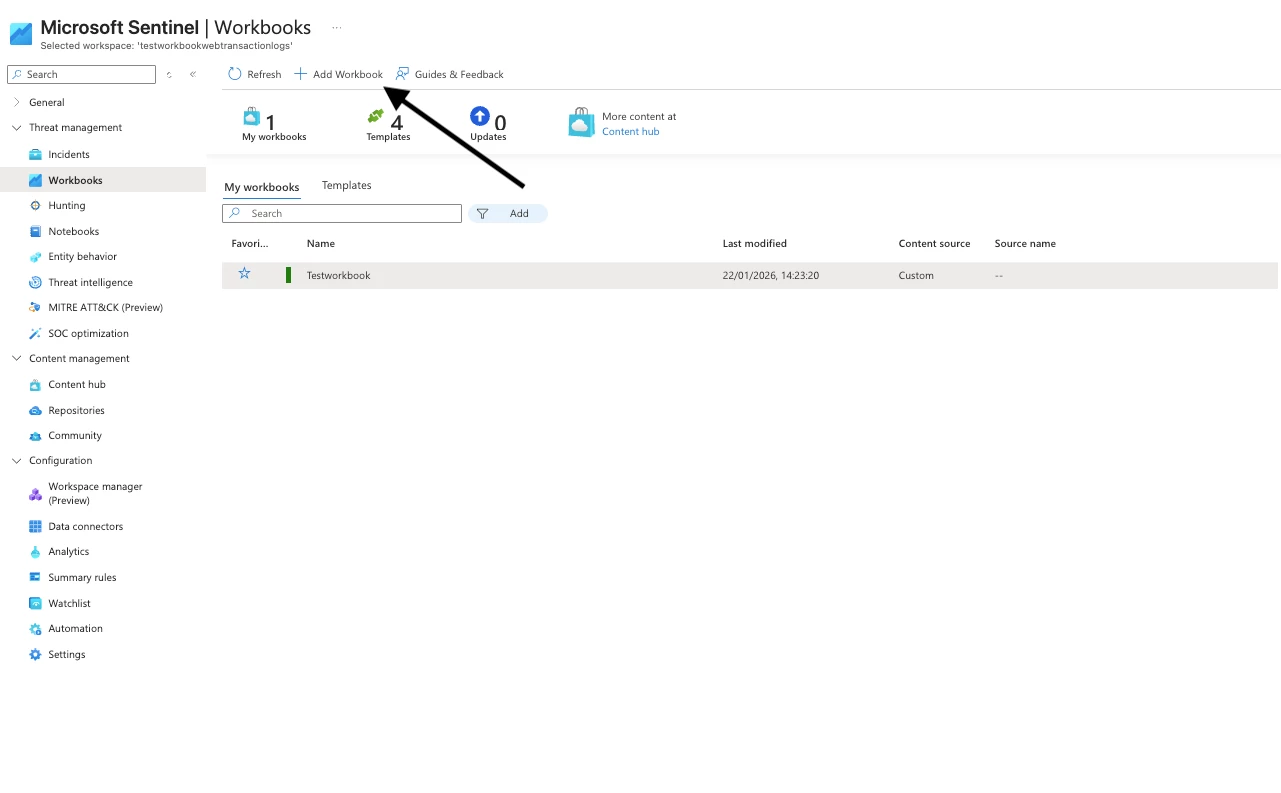
Step 1: Access Workbooks
- Navigate to Microsoft Sentinel in the Azure Portal
- Select your workspace
- Go to Workbooks under Threat Management
- Click + Add workbook
Step 2: Import the Template
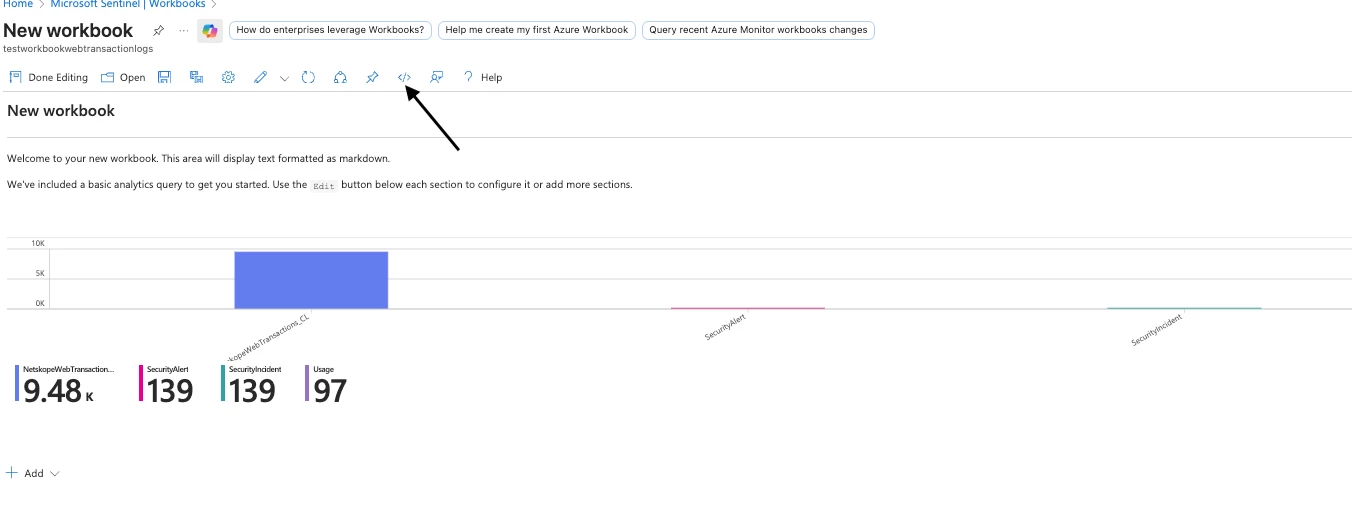
- Click Edit in the new workbook
- Click the Advanced Editor button (</> icon)
- Delete all existing content in the editor
- Copy the entire contents of NetskopeWebTx_Workbook.json
- Paste into the Advanced Editor
- Click Apply
Step 3: Save the Workbook
- Click Done Editing
- Click the Save icon
- Configure save options:
- Title: Netskope Web Transactions Dashboard
- Subscription: Your subscription
- Resource Group: Your Sentinel resource group
- Location: Same as your workspace
- Click Save
✅ Success! Your workbook is now available under My workbooks in the Workbooks gallery.
Using the Workbook
Time Range Selection
Use the Time Range picker at the top to filter all visualizations:
| Option | Use Case |
| Last 1 hour | Real-time monitoring, active incidents |
| Last 4 hours | Recent activity investigation |
| Last 24 hours | Daily review, shift handoff |
| Last 7 days | Weekly trends, pattern analysis |
| Last 30 days | Monthly reporting, baseline comparison |
Sample Workbook Queries
The workbook uses KQL queries like these. You can customize or extend them:
Top Active Users:
NetskopeWebTransactions_CL | where TimeGenerated {TimeRange} | where isnotempty(CsUsername) and CsUsername != "-" | summarize Transactions = count(), UniqueApps = dcount(XCsApp), TotalBytes = sum(Bytes) by User = CsUsername | order by Transactions desc | take 20
Part 2: Netskope Analytics Rules
The analytics rules template deploys 10 pre-configured detection rules that automatically identify security threats and create incidents in Microsoft Sentinel.
Rules Overview
| # | Rule Name | Severity | Detection Focus |
| 1 | Impossible Travel Detection | High | Access from 2+ countries within 1 hour |
| 2 | Excessive Downloads | Medium | Download volume exceeds 3x baseline |
| 3 | Unsanctioned/Risky Apps | Medium | Access to Shadow IT applications |
| 4 | New Risky App vs Baseline | Medium | First-time access to risky applications |
| 5 | Large Data Upload (DLP) | High | Uploads exceeding 100MB threshold |
| 6 | Policy Violations | High | Repeated policy blocks or alerts |
| 7 | Anomalous User Behavior | Medium | High volume from unmanaged devices |
| 8 | Personal Cloud Storage | Medium | Heavy usage of personal cloud apps |
| 9 | Network Context Anomaly | Medium | Suspicious IPs, ports, or geo locations |
| 10 | Data Movement Tracking | Informational | Upload/download pattern monitoring |
Detailed Rule Descriptions
Rule 1: Impossible Travel Detection
🌍 Impossible Travel Detection (Two Countries in Less Than 1 Hour)
Severity: High
Description: Detects when a user accesses resources from two distinct countries within less than 1 hour, indicating potential credential compromise or VPN abuse.
MITRE Tactics: Initial Access Credential Access
Technique: T1078 - Valid Accounts
Trigger Conditions:
- User accesses from 2+ different countries
- Time difference is less than 60 minutes
Rule 2: Excessive Downloads Detection
📥 Excessive Downloads Detection (Spike vs Baseline)
Severity: Medium
Description: Detects users with excessive download activity compared to their 7-day baseline. Triggers when current download volume exceeds 3x the average.
MITRE Tactics: Exfiltration Collection
Techniques: T1530 - Data from Cloud Storage, T1074 - Data Staged
Trigger Conditions:
- Current hour downloads > 3x daily average
- Requires 7 days of baseline data
Rule 3: Unsanctioned/Risky Cloud App Access
☁️ Unsanctioned/Risky Cloud App Access (Shadow IT)
Severity: Medium
Description: Alerts when users access unsanctioned or risky cloud applications based on Cloud Confidence Level (CCL) and app tags.
MITRE Tactics: Initial Access Exfiltration
Techniques: T1199 - Trusted Relationship, T1567 - Exfiltration Over Web Service
Trigger Conditions:
- App tagged as "Unsanctioned"
- CCL = "poor" or "low"
- CCI score < 50
Rule 4: New Risky App Access vs 7-Day Baseline
🆕 New Risky App Access vs 7-Day Baseline
Severity: Medium
Description: Compares today's accessed applications against a 7-day baseline and triggers alerts when users access new risky applications not seen before.
MITRE Tactics: Initial Access Discovery
Techniques: T1199 - Trusted Relationship, T1526 - Cloud Service Discovery
Trigger Conditions:
- Application not in user's 7-day history
- CCI < 70 or CCL = "poor"/"low"
Rule 5: Large Outbound Data Transfer / Sensitive Upload (DLP)
📤 Large Outbound Data Transfer / Sensitive Upload (DLP)
Severity: High
Description: Detects large outbound data transfers and sensitive file uploads. Monitors for potential data exfiltration via cloud applications.
MITRE Tactics: Exfiltration
Techniques: T1567 - Exfiltration Over Web Service, T1048 - Exfiltration Over Alternative Protocol
Trigger Conditions:
- Upload volume > 100MB in 1 hour
- Activities: Upload, Post, Share, PUT, POST methods
Dynamic Severity:
- > 1GB = Critical
- > 500MB = High
- > 100MB = Medium
Rule 6: Repeated or Critical Policy Violations
🚫 Repeated or Critical Policy Violations
Severity: High
Description: Detects users with repeated policy violations or critical policy blocks. Monitors policy enforcement effectiveness and compliance.
MITRE Tactics: Defense Evasion Exfiltration
Techniques: T1562 - Impair Defenses, T1048 - Exfiltration Over Alternative Protocol
Trigger Conditions:
- 5+ violations in 1 hour, OR
- Any "block" action
Rule 7: Anomalous User Behavior (Unmanaged Device)
💻 Anomalous User Behavior (High Volume from Unmanaged Device)
Severity: Medium
Description: Detects anomalous user behavior including high data volume transfers from unmanaged devices, unusual access patterns, and suspicious application usage.
MITRE Tactics: Exfiltration Collection
Techniques: T1567 - Exfiltration Over Web Service, T1074 - Data Staged
Trigger Conditions:
- Data volume > 1GB, AND
- Device = unmanaged/BYOD/Personal, OR
- Data volume > 5GB, OR
- 20+ unique apps accessed
Rule 8: Heavy Personal Cloud Storage Usage
📁 Heavy Personal Cloud Storage Usage (Shadow IT)
Severity: Medium
Description: Detects heavy usage of personal cloud storage applications like personal Dropbox, Google Drive, OneDrive personal, etc.
MITRE Tactics: Exfiltration Collection
Techniques: T1567 - Exfiltration Over Web Service, T1530 - Data from Cloud Storage
Monitored Apps: Dropbox, Google Drive, OneDrive, Box, iCloud, pCloud, MEGA, MediaFire, WeTransfer
Trigger Conditions:
- Data transfer > 500MB, OR
- 50+ files transferred
- Instance tagged as "Personal" or "Unsanctioned"
Rule 9: Suspicious Network Context
🌐 Suspicious Network Context (Unusual IPs/Geo/Ports)
Severity: Medium
Description: Detects suspicious network activity based on unusual source/destination IPs, geographic anomalies, uncommon ports, and high traffic volumes.
MITRE Tactics: Command and Control Exfiltration Discovery
Techniques: T1071 - Application Layer Protocol, T1048 - Exfiltration Over Alternative Protocol, T1046 - Network Service Discovery
Trigger Conditions:
- Access to suspicious ports (FTP, SSH, Telnet, SMB, RDP, etc.)
- Traffic to high-risk countries (RU, CN, KP, IR, SY)
- 50+ unique destination IPs
- Data volume > 1GB
Rule 10: Data Movement Tracking
📊 Data Movement Tracking (Upload/Download Monitoring)
Severity: Informational
Description: Tracks file uploads and downloads, monitoring data movement direction, size, and destination. Provides visibility into data flow patterns.
MITRE Tactics: Exfiltration Collection
Techniques: T1567 - Exfiltration Over Web Service, T1074 - Data Staged
Trigger Conditions:
- Total transfer > 50MB in 1 hour
- Tracks upload/download breakdown
- Informational alerts for visibility (not necessarily threats)
Deploy the Analytics Rules
Step 1: Access Custom Deployment
- Navigate to the Azure Portal
- Search for "Deploy a custom template"
- Click "Build your own template in the editor"
Step 2: Load the Template
- Copy the entire contents of Netskope_Analytics_Rules_WebTx.json
- Paste into the template editor
- Click Save
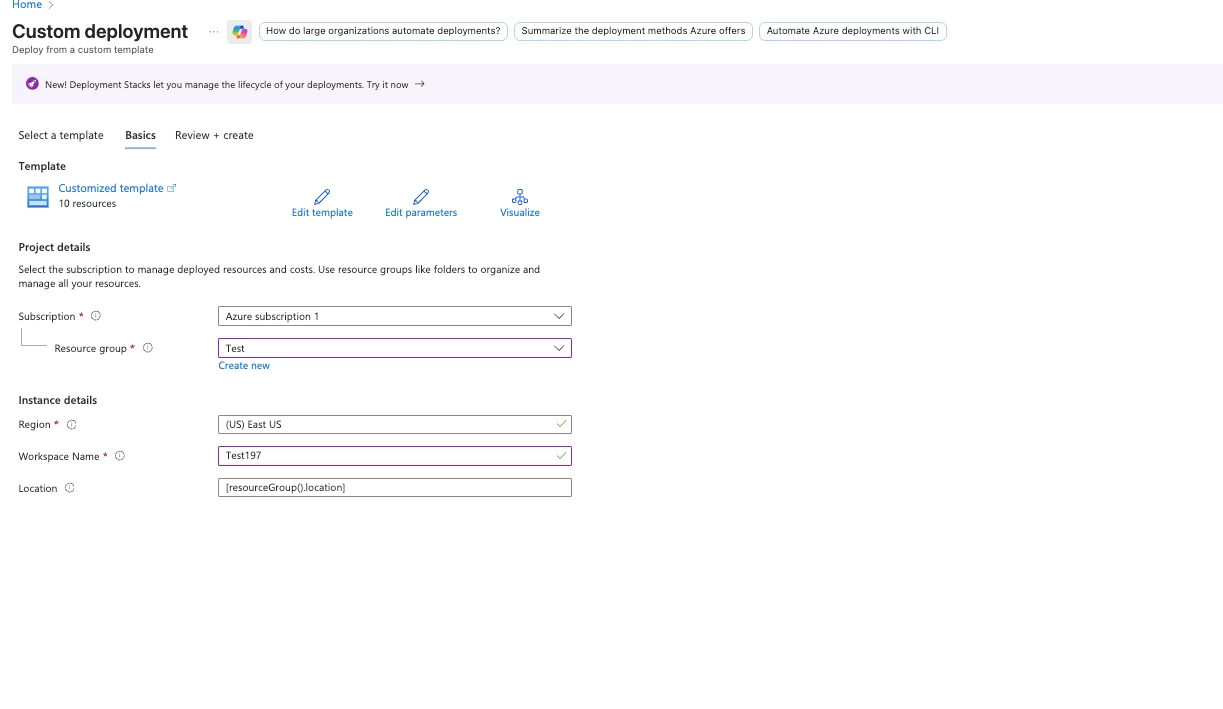
Step 3: Configure Parameters
| Parameter | Value | Description |
| Subscription | Your subscription | Azure subscription with Sentinel |
| Resource Group | Your RG | Resource group containing Sentinel workspace |
| Workspace Name | Your workspace | Log Analytics workspace name |
| Location | Region | Same region as your workspace |
Step 4: Deploy
- Click Review + Create
- Verify the configuration
- Click Create
- Wait for deployment to complete (2-5 minutes)
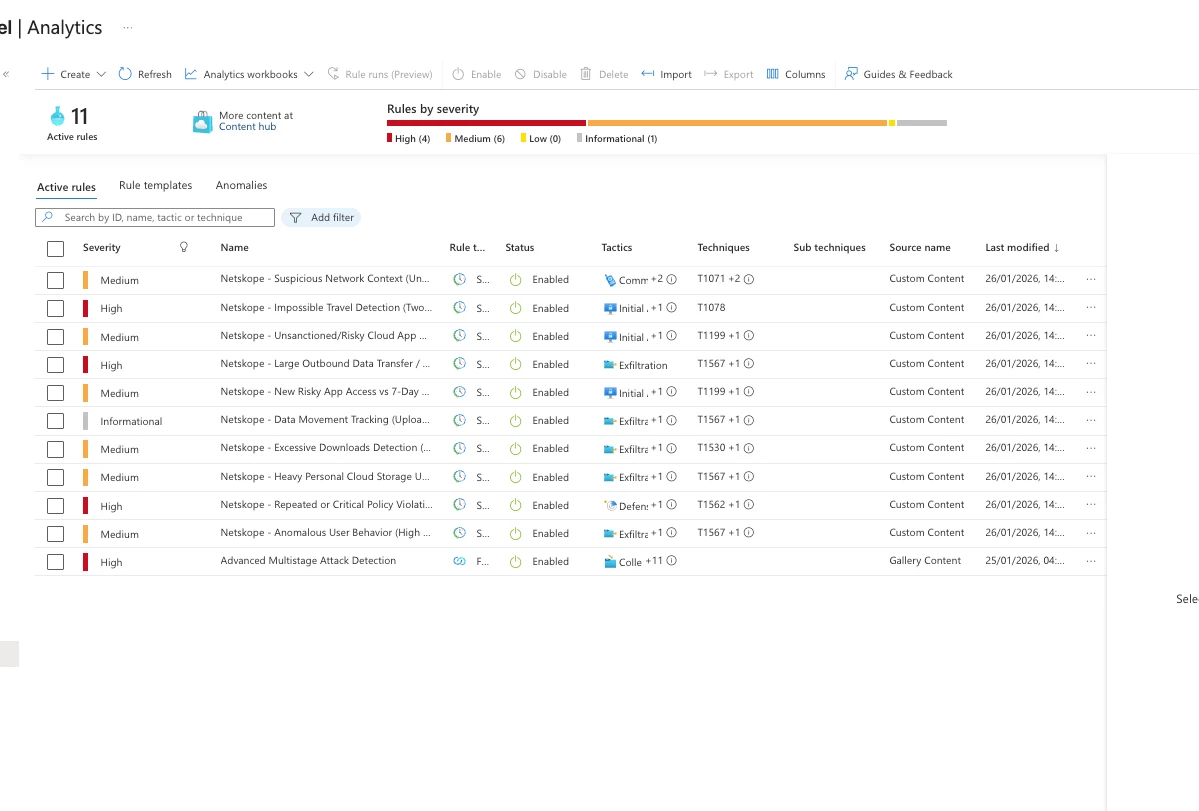
Step 5: Verify Deployment
- Navigate to Microsoft Sentinel → Analytics
- Click Rule templates tab
- Filter by source or search for "Netskope"
- Verify all 10 rules appear
✅ Success! All 10 analytics rules are now active and will create incidents when triggered.
Managing Analytics Rules
View Active Rules
- Go to Microsoft Sentinel → Analytics → Active rules
- Filter by "Netskope" to see all deployed rules
- Review status, last run time, and incident count
Customize Rule Thresholds
You can modify rules to match your organization's requirements:
- Click on a rule to open it
- Click Edit
- Modify the KQL query thresholds:
- Change uploadThresholdMB = 100 to your preferred value
- Adjust violationThreshold = 5 as needed
- Modify time windows (e.g., ago(1h) to ago(4h))
- Click Save
⚠️ Important: Test modified rules in a non-production environment first. Lower thresholds may generate excessive alerts.
Disable/Enable Rules
To temporarily disable a rule without deleting it:
- Select the rule in Active rules
- Click Disable in the toolbar
- To re-enable, select and click Enable
Incident Response Workflow
When analytics rules trigger, incidents are created in Microsoft Sentinel. Here's how to respond:
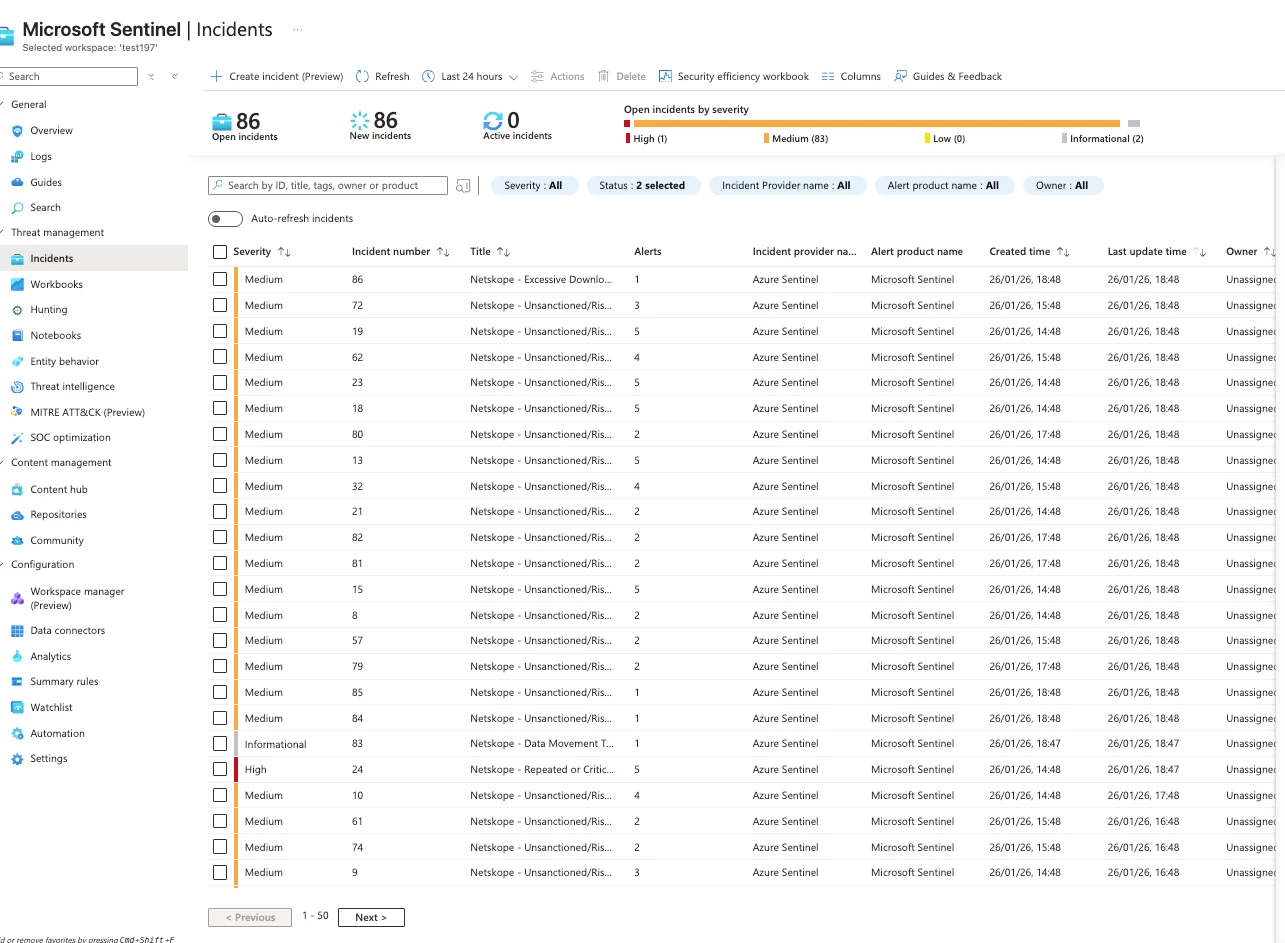
Viewing Incidents
- Navigate to Microsoft Sentinel → Incidents
- Filter by:
- Status: New, Active
- Severity: High, Medium
- Product name: Azure Sentinel
- Click an incident to view details
Incident Details
Each incident includes:
| Field | Description |
| Affected User | The user who triggered the alert |
| Source IPs | IP addresses involved |
| Applications | Cloud apps accessed |
| Countries | Geographic locations |
| Data Volume | Amount of data transferred |
| MITRE Tactics | Mapped attack techniques |
Investigation Queries
Use these queries to investigate incidents:
User Activity Timeline:
NetskopeWebTransactions_CL | where TimeGenerated > ago(24h) | where CsUsername == "user@company.com" | project TimeGenerated, XCsApp, XCsAppActivity, CsHost, XCCountry, Bytes | order by TimeGenerated desc
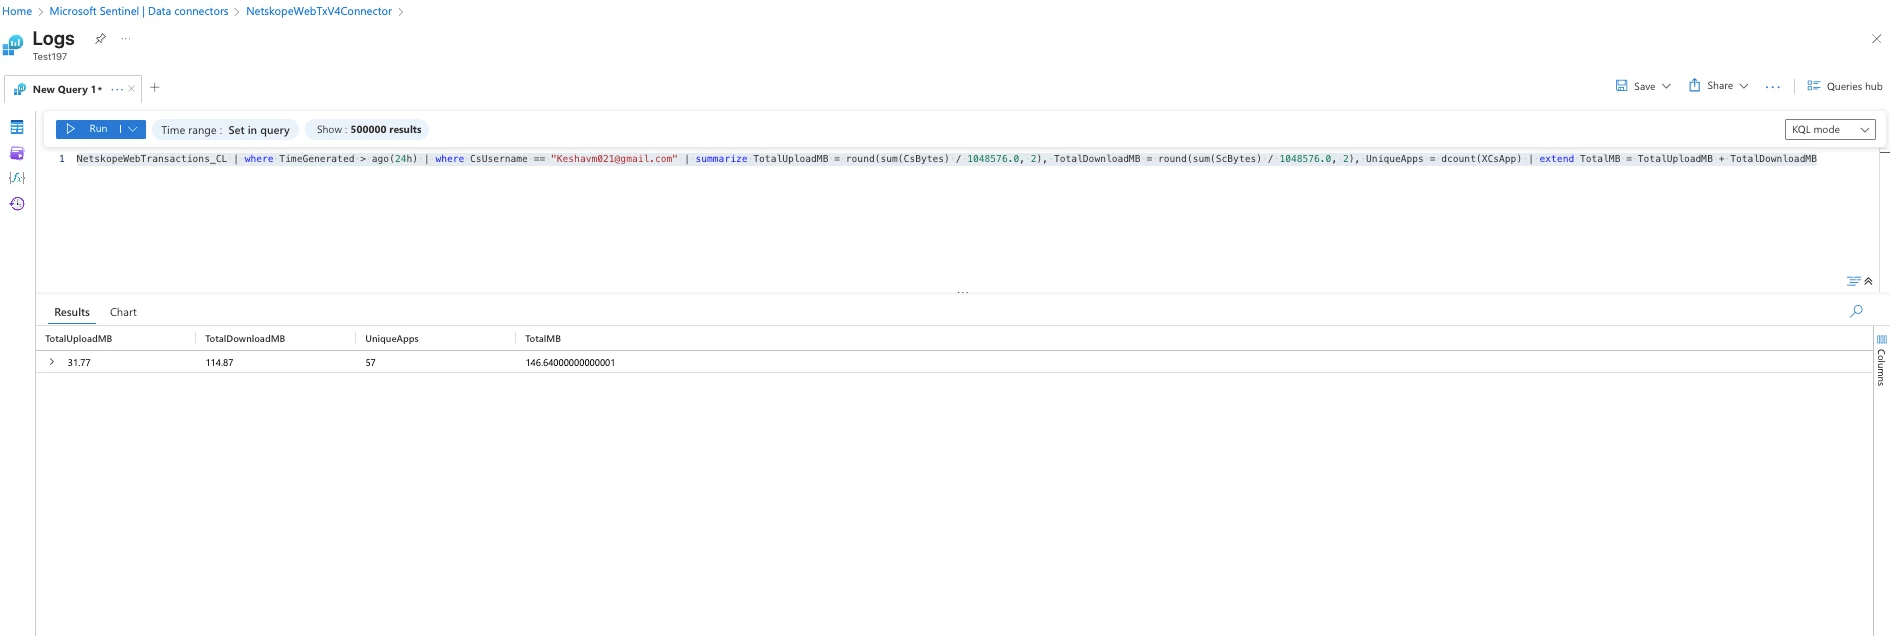
Data Transfer by User:
NetskopeWebTransactions_CL | where TimeGenerated > ago(24h) | where CsUsername == "user@company.com" | summarize TotalUploadMB = round(sum(CsBytes) / 1048576.0, 2), TotalDownloadMB = round(sum(ScBytes) / 1048576.0, 2), UniqueApps = dcount(XCsApp) | extend TotalMB = TotalUploadMB + TotalDownloadMB
Geographic Access Pattern:
NetskopeWebTransactions_CL | where TimeGenerated > ago(7d) | where CsUsername == "user@company.com" | summarize AccessCount = count(), FirstSeen = min(TimeGenerated), LastSeen = max(TimeGenerated) by XCCountry, XCLocation | order by AccessCount desc
Best Practices
Workbook Usage
- Daily Review: Check the workbook dashboard at the start of each shift
- Baseline Establishment: Use 30-day views to establish normal patterns
- Custom Queries: Add organization-specific visualizations as needed
Analytics Rules
- Tuning Period: Allow 2-4 weeks for baseline rules to stabilize
- False Positive Management: Create exceptions for known legitimate activity
- Threshold Adjustment: Start with default thresholds, adjust based on alert volume
- Regular Review: Review rule effectiveness monthly
Data Requirements
| Rule Type | Data Requirement |
| Real-time rules (1-6, 8-10) | 1+ hours of data |
| Baseline rules (2, 4) | 7+ days of historical data |
| Trend analysis | 30+ days recommended |
Troubleshooting
Workbook Issues
| Issue | Solution |
| No data in visualizations | Verify data exists in NetskopeWebTransactions_CL table |
| Slow loading | Reduce time range or add filters |
| Import errors | Ensure JSON is complete and valid |
| Permission denied | Verify Sentinel Reader role minimum |
Analytics Rule Issues
| Issue | Solution |
| Rules not triggering | Check if data meets trigger conditions |
| Too many alerts | Increase thresholds or add exclusions |
| Baseline rules failing | Wait for 7 days of data accumulation |
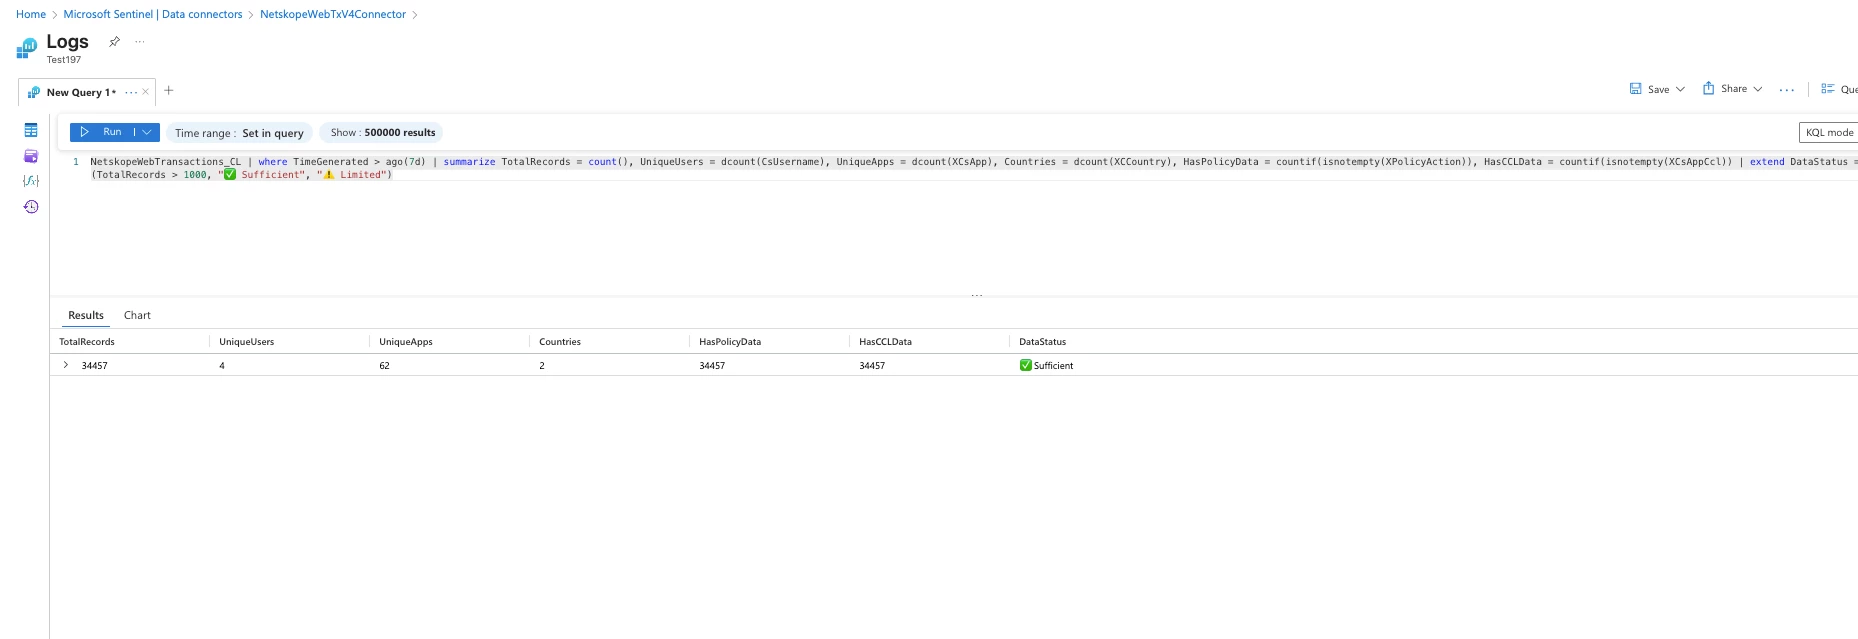
Validation Query
Run this query to verify data availability for rules:
NetskopeWebTransactions_CL | where TimeGenerated > ago(7d) | summarize TotalRecords = count(), UniqueUsers = dcount(CsUsername), UniqueApps = dcount(XCsApp), Countries = dcount(XCCountry), HasPolicyData = countif(isnotempty(XPolicyAction)), HasCCLData = countif(isnotempty(XCsAppCcl)) | extend DataStatus = iff(TotalRecords > 1000, "✅ Sufficient", "⚠️ Limited")
Resources
GitHub Repository
Download the templates:
https://github.com/netskopeoss/Netskope_Web_Transactions_Azure_Sentinel
Files:
- NetskopeWebTx_Workbook.json — Workbook template
- Netskope_Analytics_Rules_WebTx.json — Analytics rules (10 rules)
Summary
You have successfully deployed:
- ✅ Netskope Web Transactions Workbook — Comprehensive visibility dashboard
- ✅ 10 Analytics Rules — Automated threat detection covering:
- Credential compromise (Impossible Travel)
- Data exfiltration (Excessive Downloads, Large Uploads)
- Shadow IT (Unsanctioned Apps, Personal Cloud Storage)
- Policy violations and compliance
- Network anomalies and suspicious behavior
Your security team can now proactively monitor, detect, and respond to threats in your Netskope-protected environment directly within Microsoft Sentinel.
Next Steps
- Configure Automation Rules — Auto-assign incidents to analysts
- Create Playbooks — Automate response actions
- Build Custom Rules — Address organization-specific threats
- Schedule Reports — Generate weekly security summaries
If you have new dashboard and Analytics rules in your mind. Please feel free to contribute to https://github.com/netskopeoss/Netskope_Web_Transactions_Azure_Sentinel or drop an email to Kmaheshwari@netskope.com


