

Hello Folks,
Below you can find a recap of questions asked at the Nov office hours session and those sent in that we were not able to cover during the session. Feel free to comment and continue the discussion, as well as attend future sessions that can be found on the Community Events Calendar!
Q: Where can I get some resources to quickly get started with Advanced Analytics?
A: We highly recommend starting with the NAA Training Resources post in our community. The post points you to a list of resources which can help you quickly get started with Advanced Analytics. If you are looking for some recommended dashboards to start with, the NAA Top Dashboards post will be a good choice.
Q: We are looking for insights for Board & Executives reporting, including AI. Can I leverage Advanced Analytics on this?
A: Sure. For AI-related topics, we recommend starting with the AI Usage Dashboard in Netskope Library, which helps you understand how AI apps & sites are being used in your organization. You can also find an updated version of the AI Usage Dashboard in Netskope Community. This version provides additional visibility into App Instances, which helps you identify if your Corporate Instances are exposed with AI usage.
If you need to present insights to your leadership, our CASB & NG-SWG Operationalization Dashboard are also good choices. These two dashboards help you maximize the ROI of your Netskope investment by highlighting ways to ensure you are using Netskope products to their full potential.
Q: When is the Netskope Client Agent Report going to be available?
A: Netskope Client info will be available in our upcoming Device data collection, including fields like Client installation time, Client status, and Client version. We will let you know once the Device data is available in Advanced Analytics.
Q: Are there works toward risk based scoring when it comes to alerts?
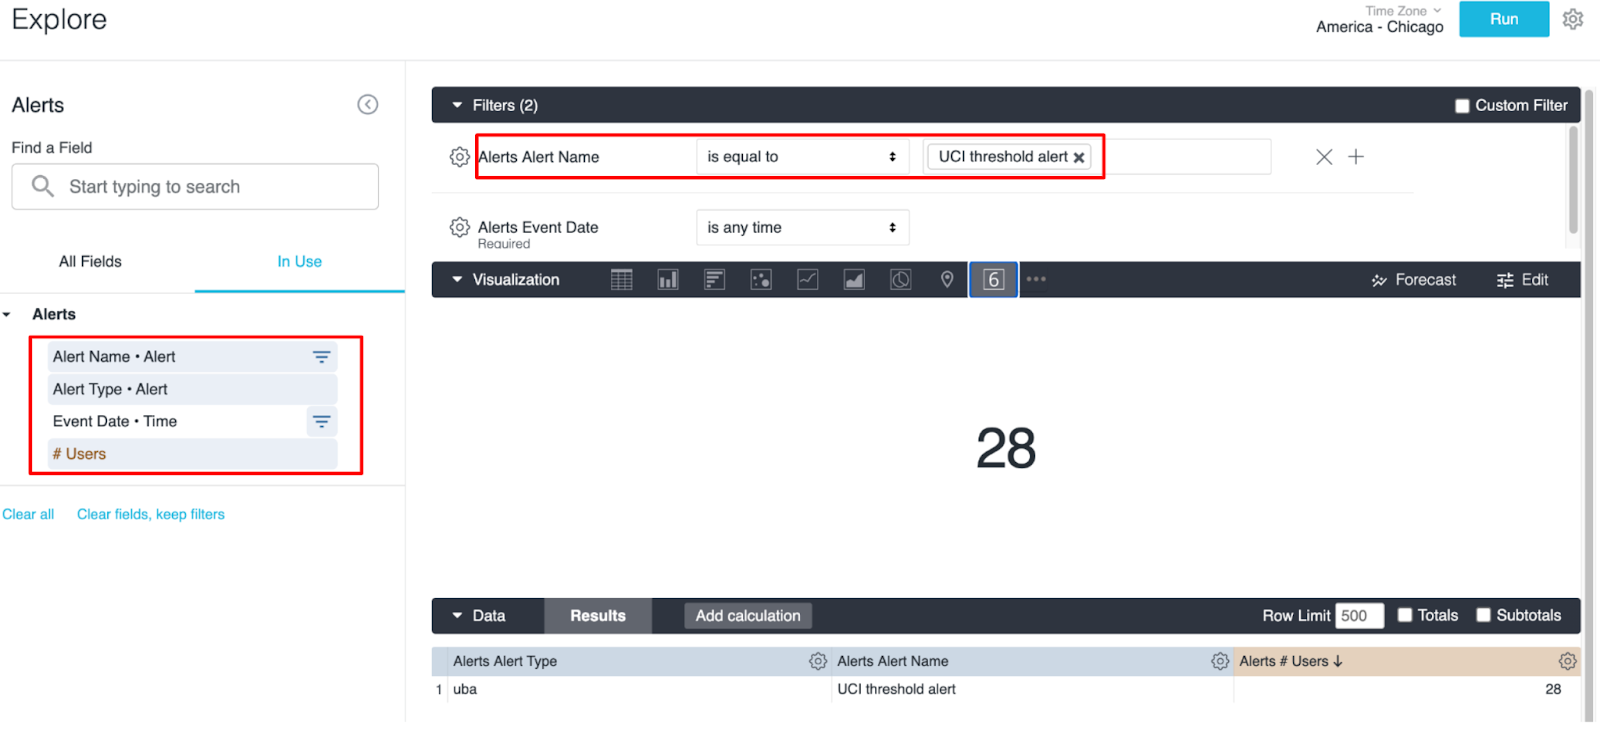
A: Yes. The User Confidence Index (UCI) in Netskope Advanced UEBA is analyzing and correlating user activity to present a holistic view of which users present the most risk through a scoring system that goes from 0-1000. If a user’s User Confidence Index (UCI) is lower than the predefined threshold, a “UCI threshold alert” will be triggered. More details can be found here.
Advanced Analytics also provides visibility into “UCI threshold alerts” triggered in your environment. Simply by applying the field “# Users” and the filter “Alert Name is equal to UCI threshold alert” in Alerts data collection, you will get the total number of users who triggered this alert. By adding additional fields like “User” and “Event Timestamp,” you will get more granularity into this topic.
Q: What is the correct data/format to put in the CISO Dashboard?
A: The CISO Dashboard in Netskope Library is using the “Period over Period” feature which allows you to compare data from one period to another. E.g. view the change in total alert count from the previous month to the current month. To correctly use this feature, two filters need to be configured: Timeframe & Reference Date.
In the example below, the “Timeframe” is set to “Months” while the “Reference Date” is “2023/10/11.” In this case, we will get data in Oct, 2023, and the change in data from the previous month (Sep, 2023). Similarly, if we change the “Timeframe” to “Weeks” but keep the “Reference Date,” we will then get data in the week of 2023/10/11, and the change in data from the previous week.
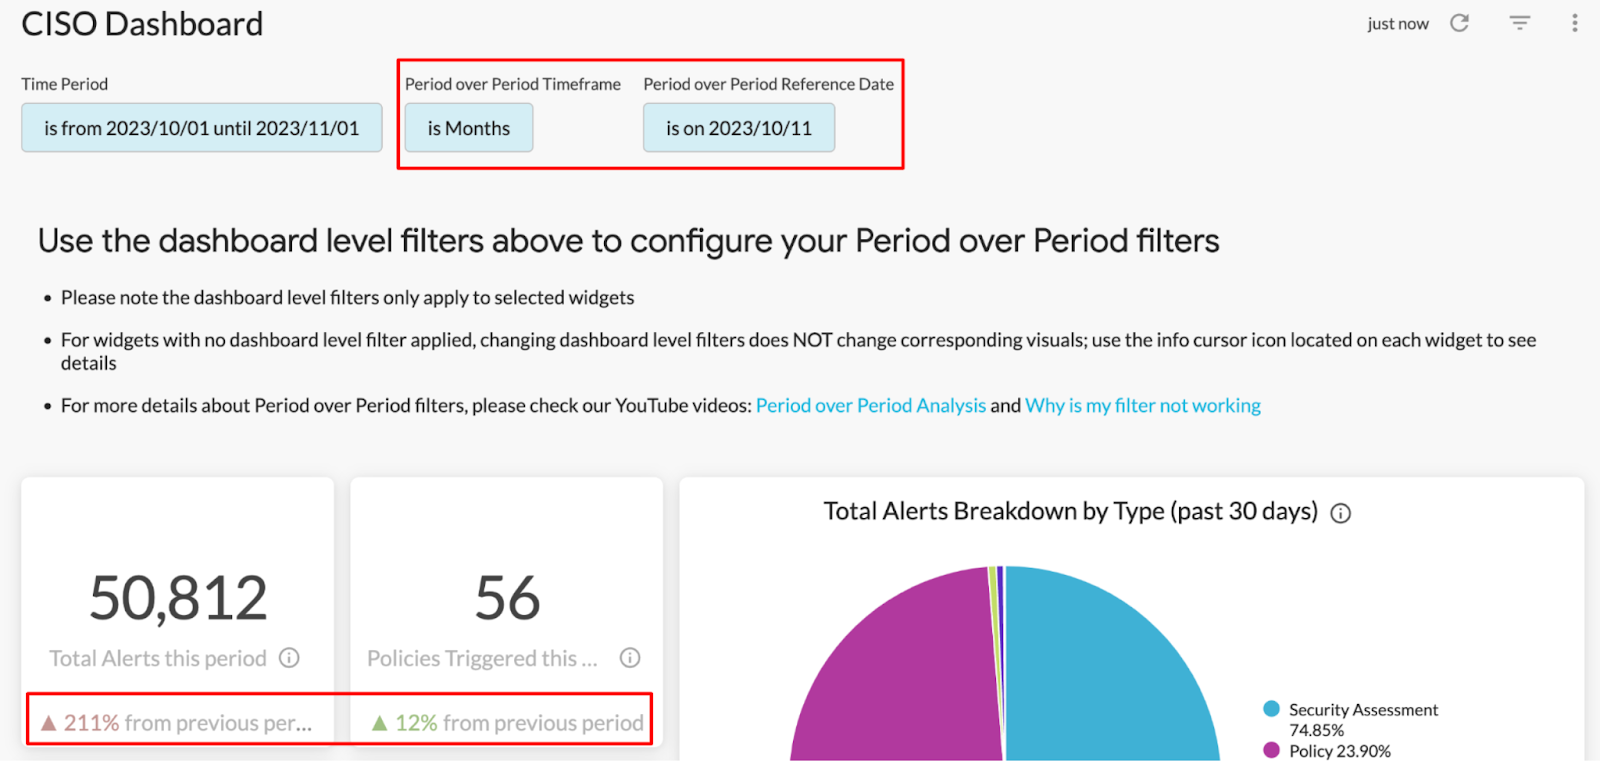
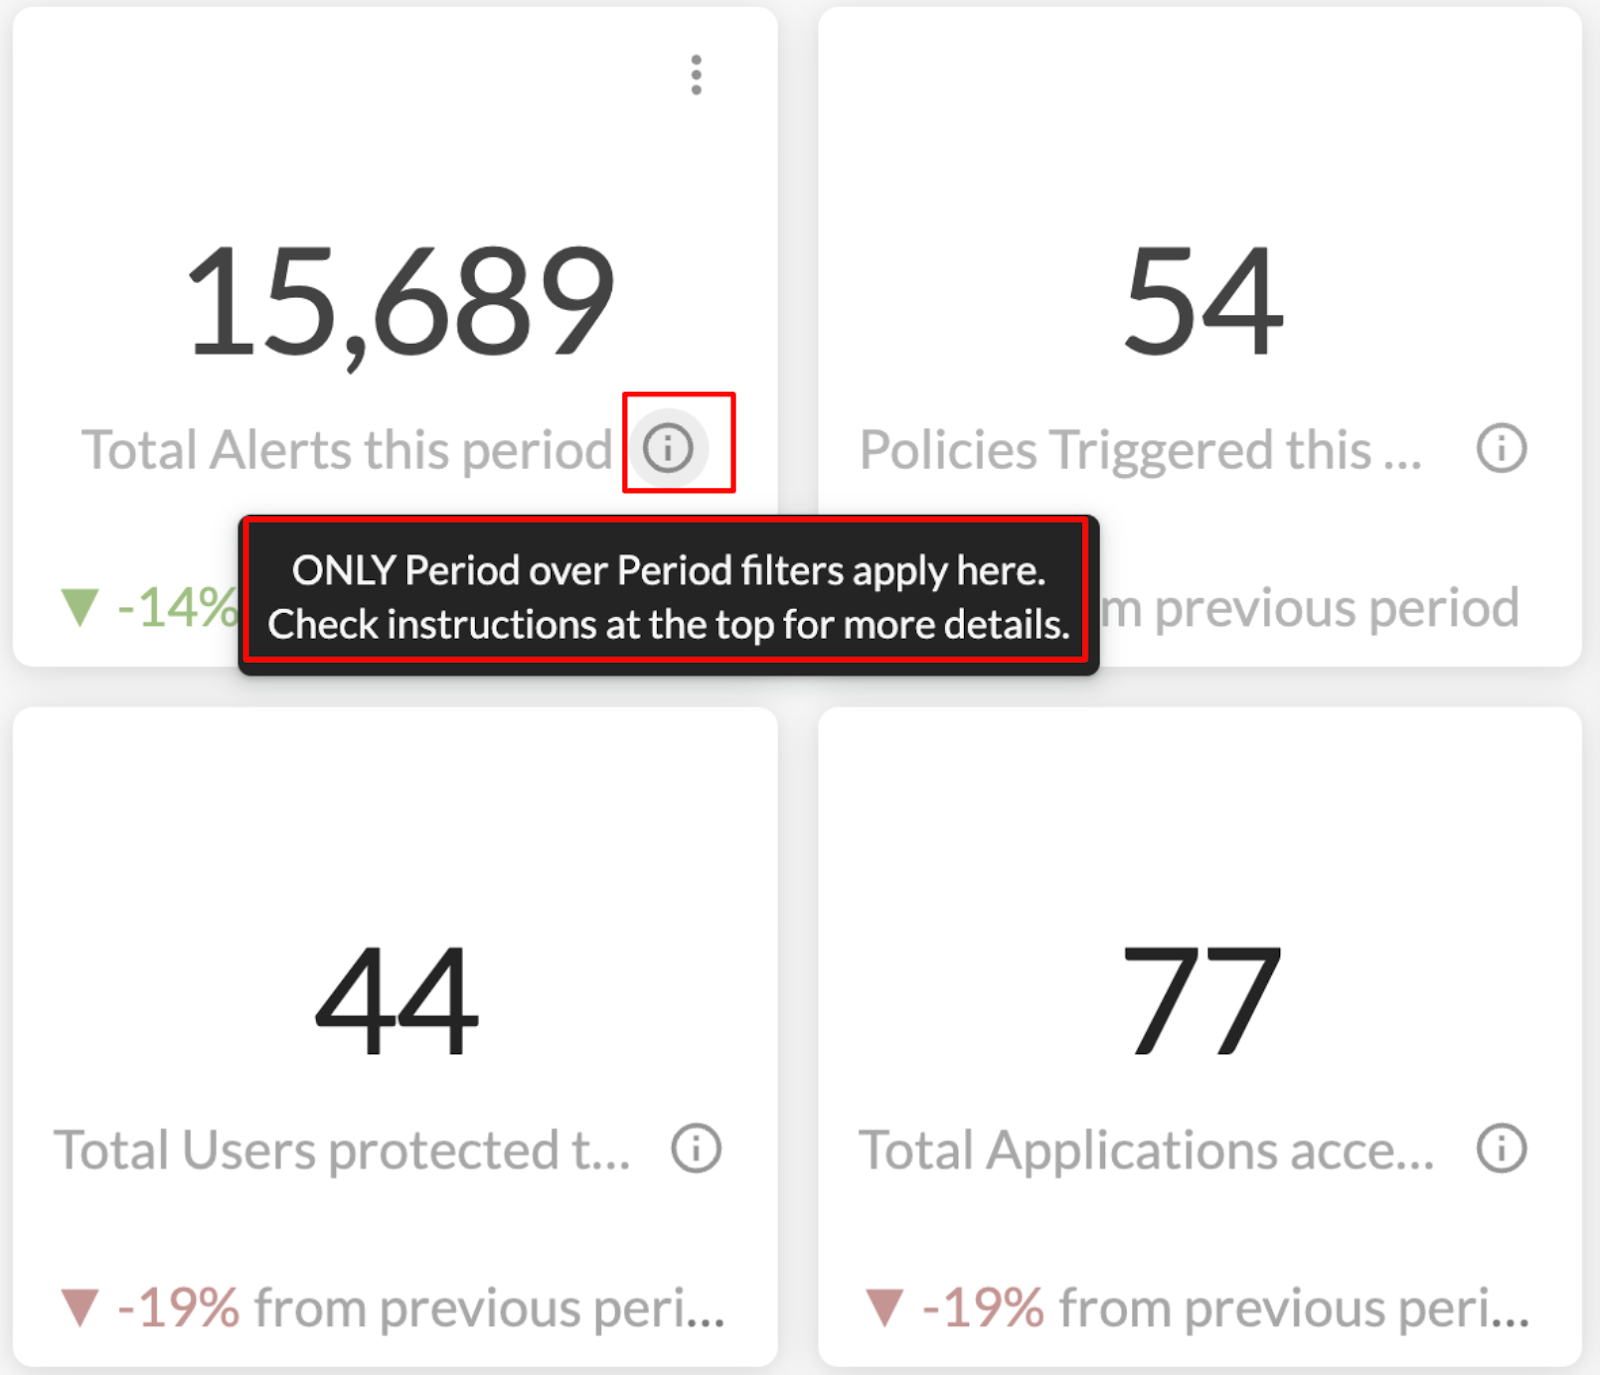
Please note that the “Period over Period” feature only applies to particular widgets, which is by design. If you change the Timeframe & Reference Date, only some of the widgets will change correspondingly. You will find notes about this in each widget.
For more details about the “Period over Period” feature, please watch our training video Period over Period Analysis. If you are looking for a simplified version of this dashboard, feel free to check the CISO Dashboard - No Period Comparison in Netskope Library.
Q: We need more details about emails, including From User, To User, and Subject Line if possible.
A: Advanced Analytics provides visibility into Webmail Traffic, including data like “From User,” “To User,” “Activity,” “Object Name,” and the corresponding “Policy Action” taken. A sample dashboard can be found here. Please note that “Subject Line” is not captured or stored in Advanced Analytics for security & privacy purposes.
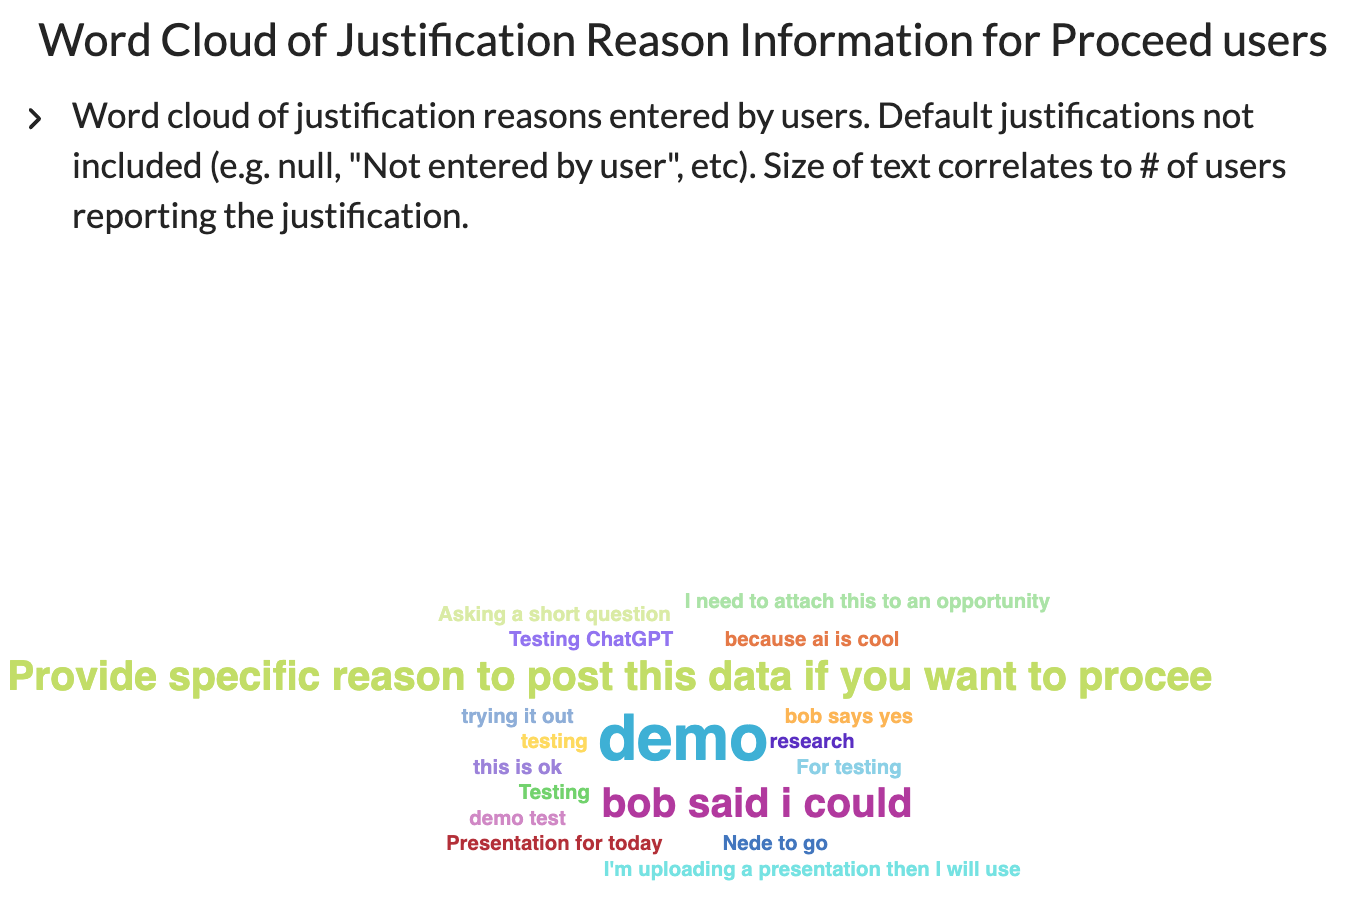
Q: Can we see justification reasons for “proceed” users from coaching policies in our organization?
A: Yes. The Coaching Policy Dashboard in Netskope Library provides visibility into justification reasons.
Q: We have users from multiple AD groups synced to the Netskope console, and we need to produce a report of top 50 allowed & blocked websites with the corresponding URLs accessed by users in a specific group. Can we target a specific AD group for the report? Can we add multiple groups as well?
A: Yes. Advanced Analytics provides visibility into allowed & blocked websites and the corresponding URLs. You can also use the “User Group” or “Organization Unit” filter to target one or more AD groups in your environment. A sample dashboard can be found here.


