

Hello Folks,
Below you can find a recap of questions asked at the office hours sessions last month and those sent in that we were not able to cover at the session. Feel free to comment and continue the discussion, as well as attend future sessions that can be found on the Community Events Calendar!
Q: I’m new to Advanced Analytics. How and where can I start my journey?
A: Netskope Advanced Analytics - Getting Started and “Getting Started” Webinar will help you get started quickly. More details can be found from our YouTube Channel. We highly recommend starting with existing dashboards, either in Netskope Library or Community. Tags can help you find dashboards you are interested in. You can explore any dashboards based on your needs, and customize them in your environment. You can also find tons of resources (e.g., hot topic discussion, dashboard intro, and upcoming AA events, etc.) here on the Netskope Community.
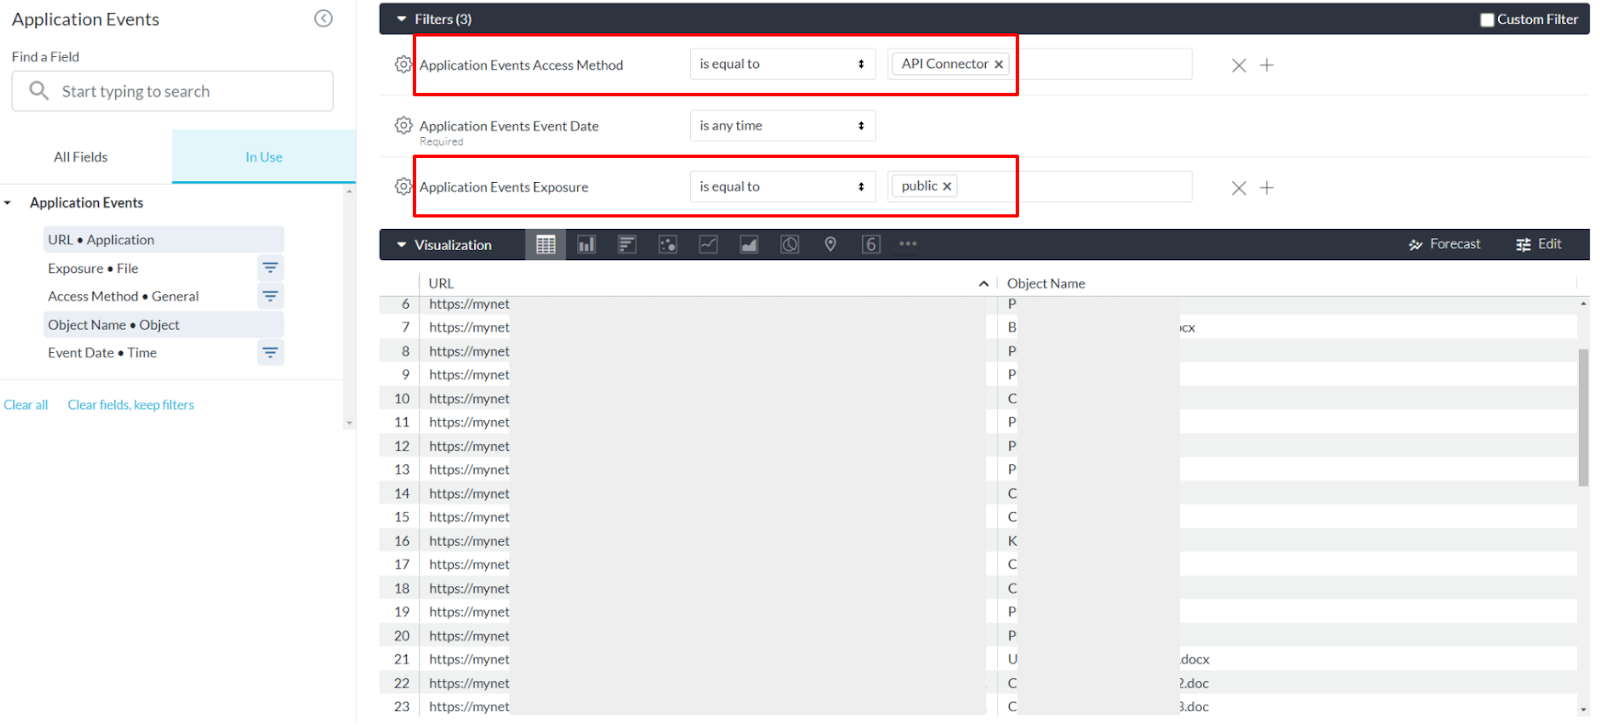
Q: Regarding API protection, I’m looking for visibility into files being shared publicly and the corresponding links of those files. Can I do this with Advanced Analytics?
A: Absolutely. By adding “URL” and “Object Name” fields, you’ll get visibility into file names and the corresponding links. Be sure to add “Access Method is equal to API Connector” and “Exposure is equal to public” filters, which filters on API protection and publicly shared files.
Q: What are the most useful/informative/relevant Advanced Analytics dashboards that I should start with?
A: Advanced Analytics can be used in 4 dimensions, and each dimension has different dashboards to start with:
- Discover Environments & Identify Risk: Identify & visualize security risks in your environment. Recommended dashboards include Cloud Risk Assessment - QBR, Risky Data Movement, Application Instance Overview, Insider Threat Dashboard, AI Usage.
- Investigate: Drill into data, aggregate and answer questions. Recommended dashboards include Application Activity Summary, Category Summary, User/Organization Unit Summary, User Investigation Dashboard.
- Operationalize: Identify gaps in protection coverage and areas where tuning is needed. Recommended dashboards include DLP Policies Dashboard, SSL Inspection, CASB Operationalization Dashboard, NG-SWG Operationalization Dashboard.
- Demonstrate Value: Visualize how users and data have been protected. Recommended dashboards include Cloud Risk Assessment - QBR, Reduction of Risk Dashboard.
All dashboards can be found in Netskope Library or Community.
Q: I’m looking for some resources regarding data security posture management with Netskope and best practices & policies to apply. Can Advanced Analytics help me with this?
A: Sure! We have 3 great starting points: Cloud Risk Assessment - QBR from our library, CASB Operationalization and NG-SWG Operationalization Dashboard from our community.
Q: How can I harness user behavior/alert/activity insights through Advanced Analytics?
A: We recommend starting with the User Behavior Analytics (UBA) Dashboard which provides visibility into anomalous user behaviors in your environment (e.g. suspicious data movement). The Insider Threat Dashboard can also help with this topic. Both dashboards can be found in Netskope Library.
Q: How can I share my Advanced Analytics dashboard with someone else?
A: There are two ways to do this: (1) Download and schedule the dashboard so the recipient will get a pdf or csv export. Always test the output by yourself to be sure of what will be sent. (2) Use the “Share with Executives” feature to share a live version of the dashboard. Please note that drilling is disabled for “Share with Executive” views, which prevents unauthorized views of detailed data. Here are helpful resources on each topic: Scheduling & Share with Executives.
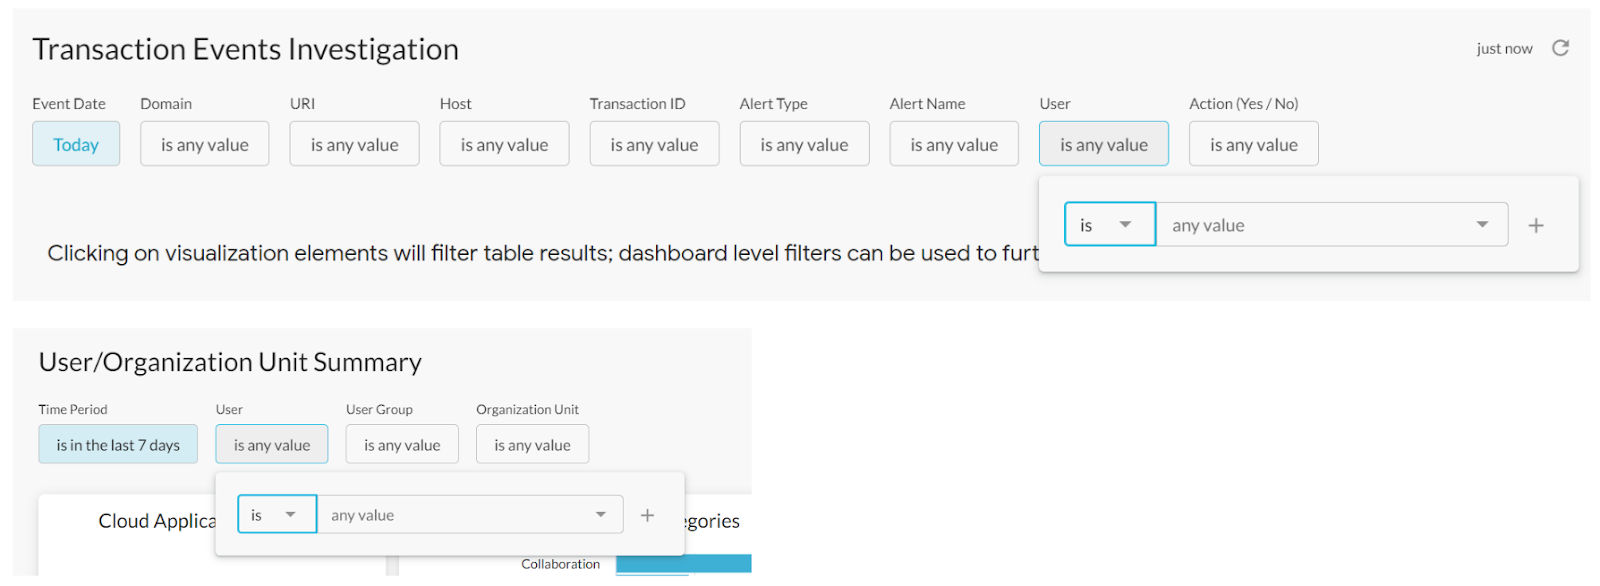
Q: How could we extract all the navigation logs about a specific user?
A: 2 dashboards from Netskope Library can help with this: User/Organization Unit Summary and Transaction Events Investigation. A “User” filter is provided in both dashboards, which helps you narrow down the results to any specific users.
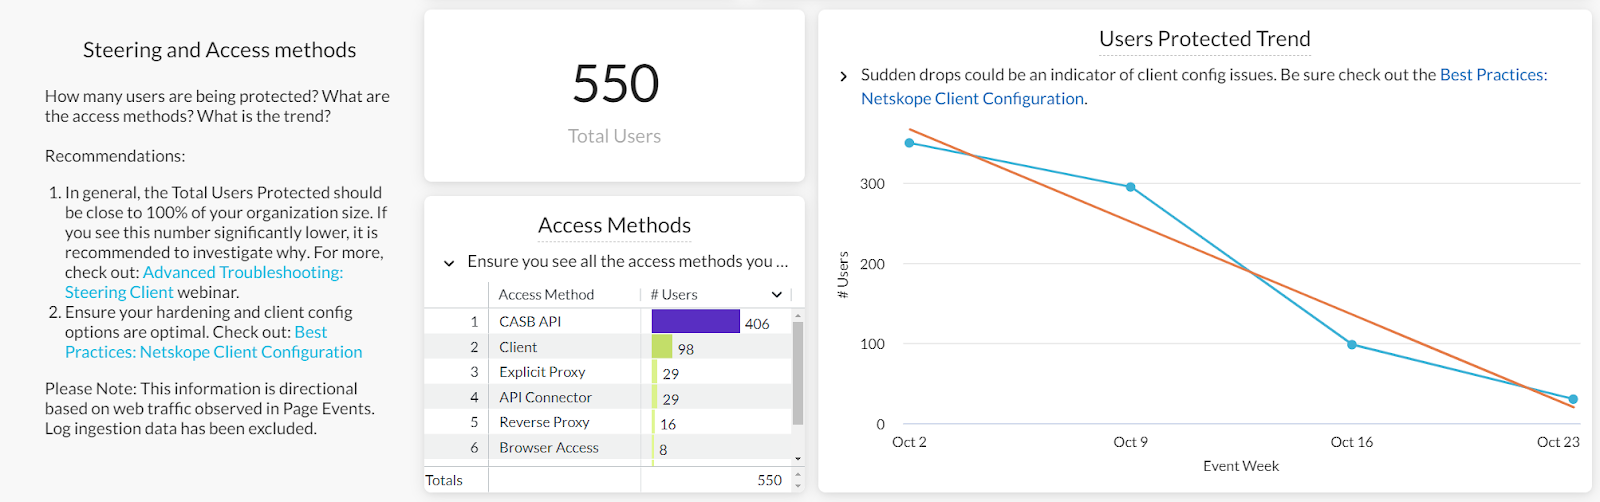
Q: Are there any dashboards that can be used to track user onboarding and issues with Netskope Client?
A: Yes. The User/Organization Unit Summary dashboard is still a great starting point here. It provides visibility into user activities when they are onboard on Netskope Client. CASB Operationalization and NG-SWG Operationalization Dashboard can also help here by providing insights into users coming online from different access methods.
Also, Netskope Client info will be available in our upcoming Device Data, including Client version, status, installation time, etc.


