

Hello Folks,
Below you can find a recap of questions asked at the office hours sessions last month and those sent in that we were not able to cover at the session. Feel free to comment and continue the discussion, as well as attend future sessions that can be found on the Community Events Calendar!
Q: When I create a dashboard in Advanced Analytics, is it visible to everyone by default or just me?
A: If you created the dashboard in your personal folder, it is visible to you only. If the dashboard is in the group folder, it will be visible to everyone in your environment.
Q: I want to understand if my organization is using Netskope’s CASB product to its full potential. Can Advanced Analytics help me with this?
A: Yes. The CASB Operationalization Dashboard can help! It helps you maximize the ROI of your Netskope investment by highlighting ways to ensure you are using Netskope to its full potential. The specific focus of this dashboard is operationalization of Netskope’s CASB product.
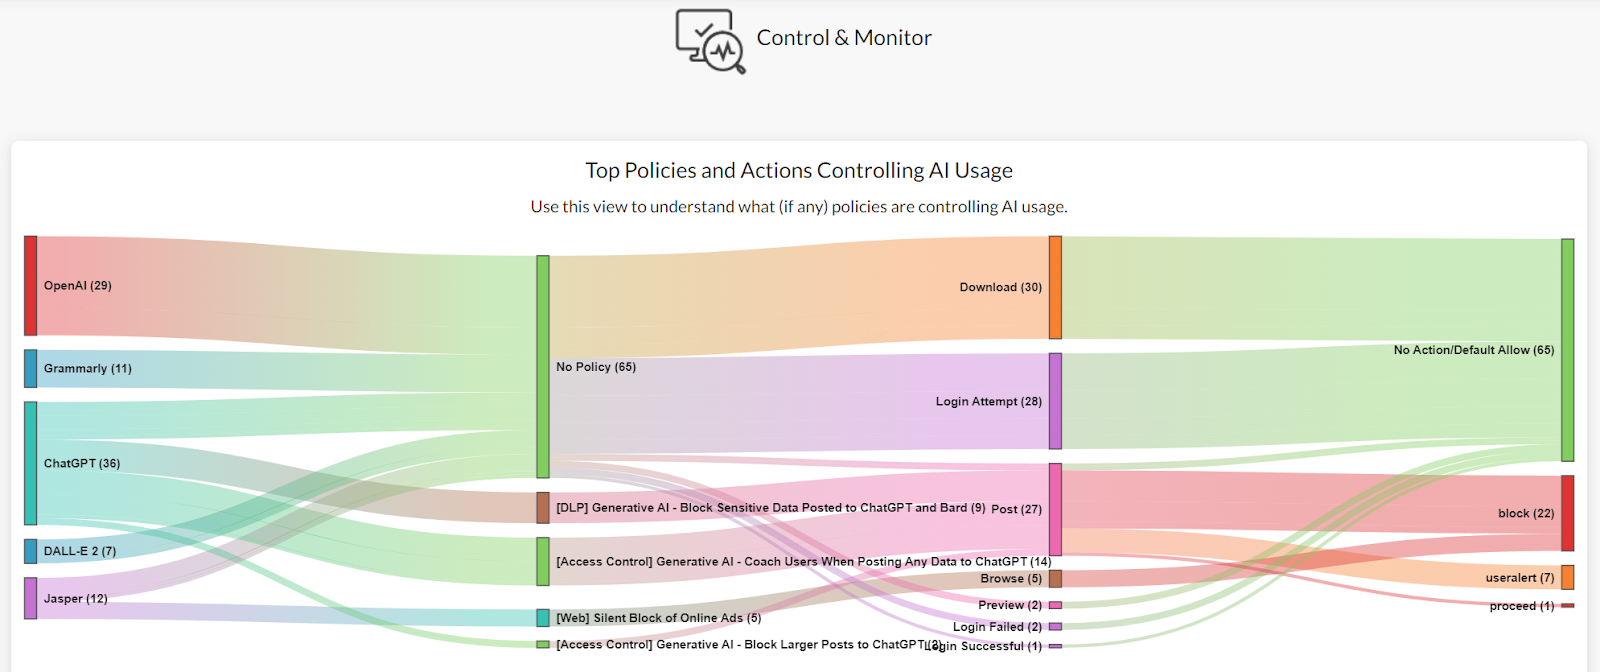
Q: Can I leverage Advanced Analytics to monitor and control generative AI usage in my organization?
A: For sure. The AI Usage Dashboard from Netskope Library is a great starting point. To gain insights into monitoring and controlling AI usage, we recommend starting with the “Control & Monitor” section of the dashboard.
Q: How can I share my Advanced Analytics dashboard with someone else?
A: There are two ways to do this: (1) Download and schedule the dashboard so the recipient will get a pdf or csv export. Always test the output by yourself to be sure of what will be sent. (2) Use the “Share with Executives” feature to share a live version of the dashboard. Please note that drilling is disabled for “Share with Executive” views, which prevents unauthorized views of detailed data. Here are helpful resources on each topic: Scheduling & Share with Executives.
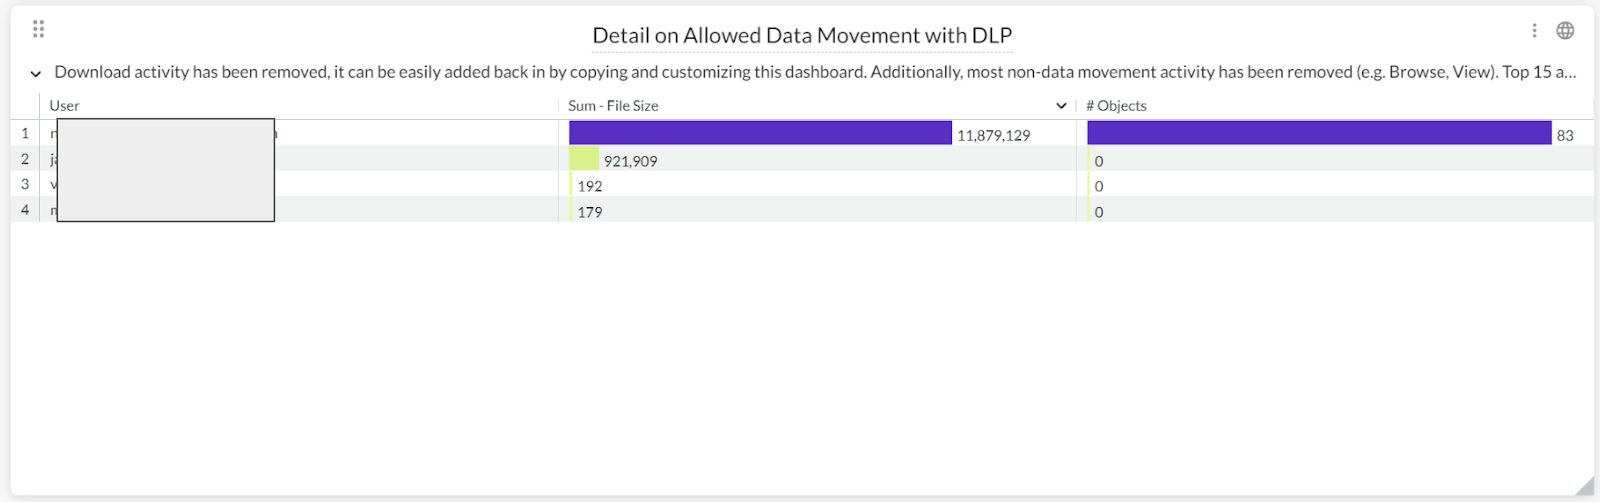
Q: Is it possible to collect leaked data through a dashboard and validate which people have the most occurrences?
A: Yes. With some simple customizations, the Risky Data Movement Dashboard can help. To start the customizations, locate the “Detail on Allowed Data Movement with DLP” widget and enter the edit mode.
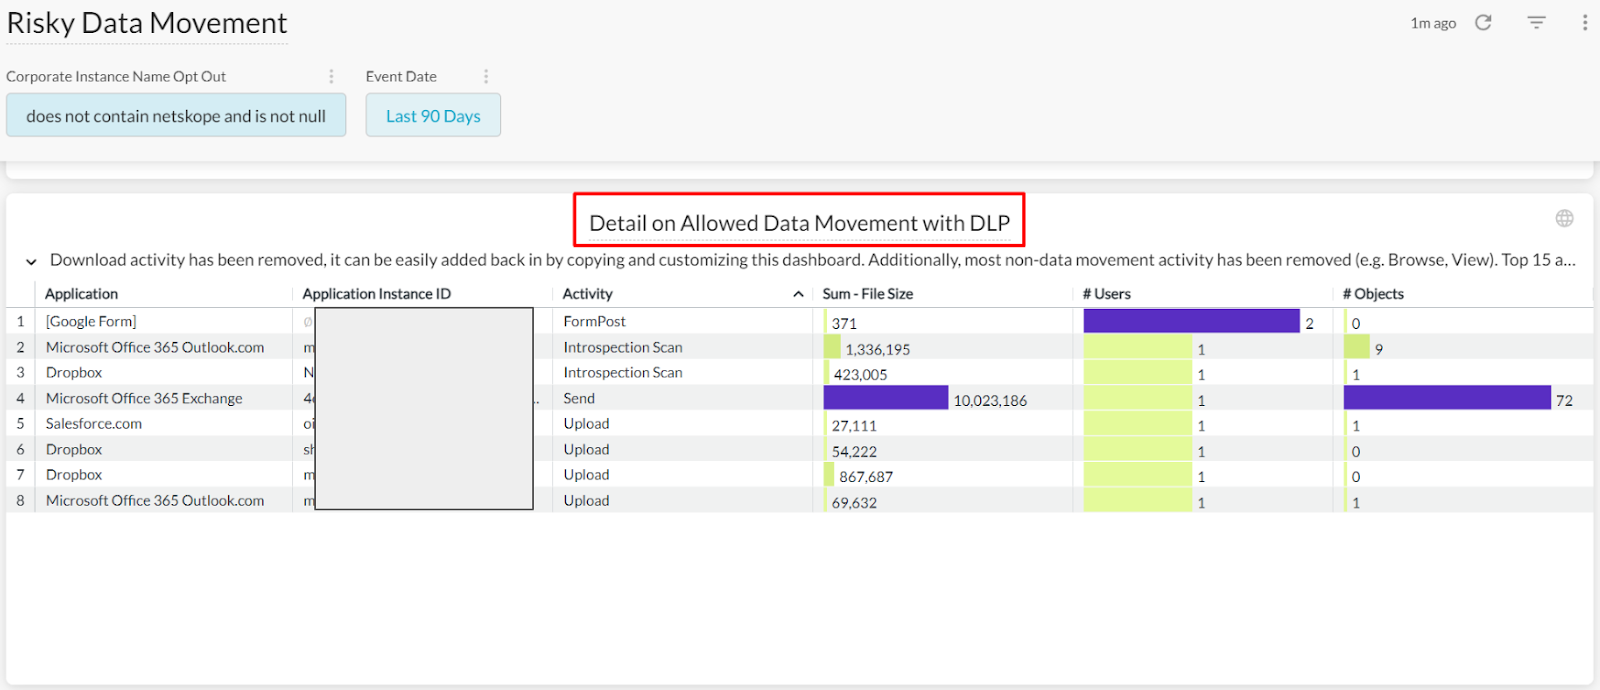
Remove all fields. Add “User,” “# Objects,” and “Sum - File Size” only and then hit the “Save” button.
The view will then show the number of objects leaked, total file size leaked, and the corresponding user info. Drill in for more details in each field.
Q: Is there a notification when a new dashboard is added to the community page?
A: Yes, but only if you subscribe to the page. You can do this by clicking the "Subscribe" button in the Advanced Analytics community page.
Q: How can I harness User Behavior Analytics insights through Advanced Analytics?
A: We recommend starting with the User Behavior Analytics (UBA) Dashboard which provides visibility into anomalous user behaviors in your environment (e.g. suspicious data movement). The Insider Threat Dashboard also can help with this topic. Both dashboards can be found in Netskope Library.
Q: Are there any unique/special ways to use Advanced Analytics? Any real world use cases?
A: Advanced Analytics is designed to help you get ideas of the risk landscape, perform security operationalization, communicate with your leadership, and investigate security issues. There are two unique/special use case with Advanced Analytics:
1) Visualize the reduction of risk in $ as an impact to revenue: check the link below for more details.
- Reduction of Risk in $: https://community.netskope.com/t5/Advanced-Analytics-Dashboard/Reduction-of-Risk-Dashboard/ba-p/7376
2) Enhance operationalization in NG-SWG & CASB products: check the links below for more details.
Q: How can I sort and filter out particular IP addresses or a range of IP addresses in my Advanced Analytics report?
A: You can do this with custom dimensions. Please check the link below for detailed instructions. https://community.netskope.com/t5/Advanced-Analytics/Group-User-IPs-into-Subnets-with-NAA-Custom-Dimension/m-p/4804
Q: How can I leverage Advanced Analytics on some DLP related topics, e.g. how to properly measure my DLP policy effectiveness?
A: To measure your policy effectiveness, we recommend starting with the DLP Policies Dashboard in Netskope Library. The dashboard provides visibility into the policies generating alerts, including policies triggered, actions taken, and users triggering these alerts, etc. The DLP Incidents Monitoring Dashboard from the library can also be helpful.
Q: Would the field in Advanced Analytics be a one-to-one mapping to the field in Skope IT? If yes, does that mean I can visualize/report anything I saw from Skope IT in my Advanced Analytics dashboard?
A: Most of the data/fields in Advanced Analytics are from Skope IT, but may be in different formats. In Advanced Analytics, you should be able to visualize/report everything you saw from Skope IT. Additionally, Advanced analytics has several other data collections not included in Skope IT - these include Transaction Events and DLP Incidents Data.


