

The dashboard attached had the following views that have been created or moved up from a different position in the previous dashboard. Here are the highlights of these views and their significance.
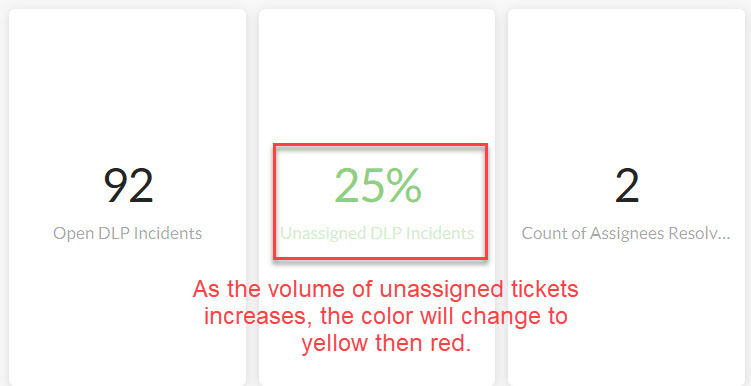
The top level numbers tell you how many open incidents there are in the environment, for a given time period. Also listed a % unassigned, and # of assignees.
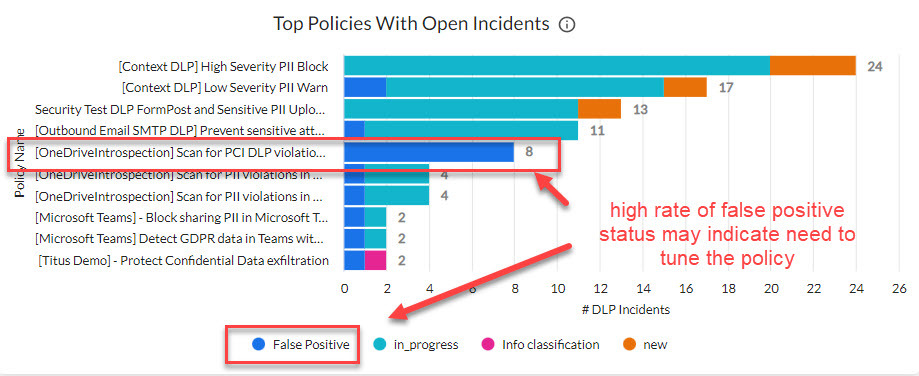
Another powerful view is the incident status by policy. This view is great for tuning, for example to identify policies that have high rates of false positives:
Check out the rest of the dashboard by downloading a sample PDF export or the dashboard template , which you can upload into your own environment, both available below.


