This post helps you understand how to customize the Reduction of Risk Dashboard based on your own environment. For a walk-through of this dashboard, please check this post: https://community.netskope.com/t5/Advanced-Analytics-Dashboard/Reduction-of-Risk-Dashboard/ba-p/7376#M102
Section 1: DLP Risk Reduction Customization
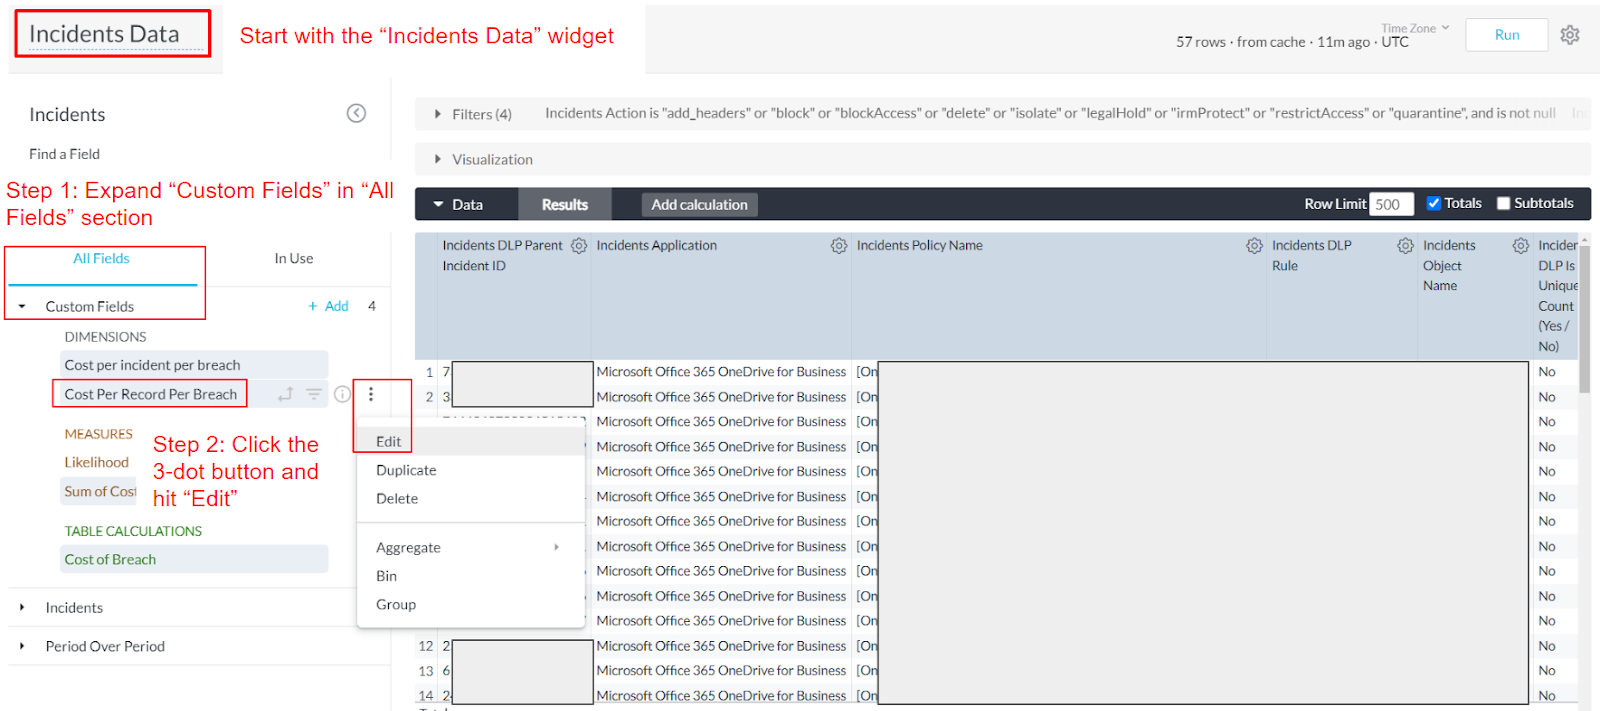
The “Cost Per Record Per Breach” is set by default to $164. If you would like to change it to a different value, you will need to do this for all three widgets in this section. Please follow the instructions below to start your customization.

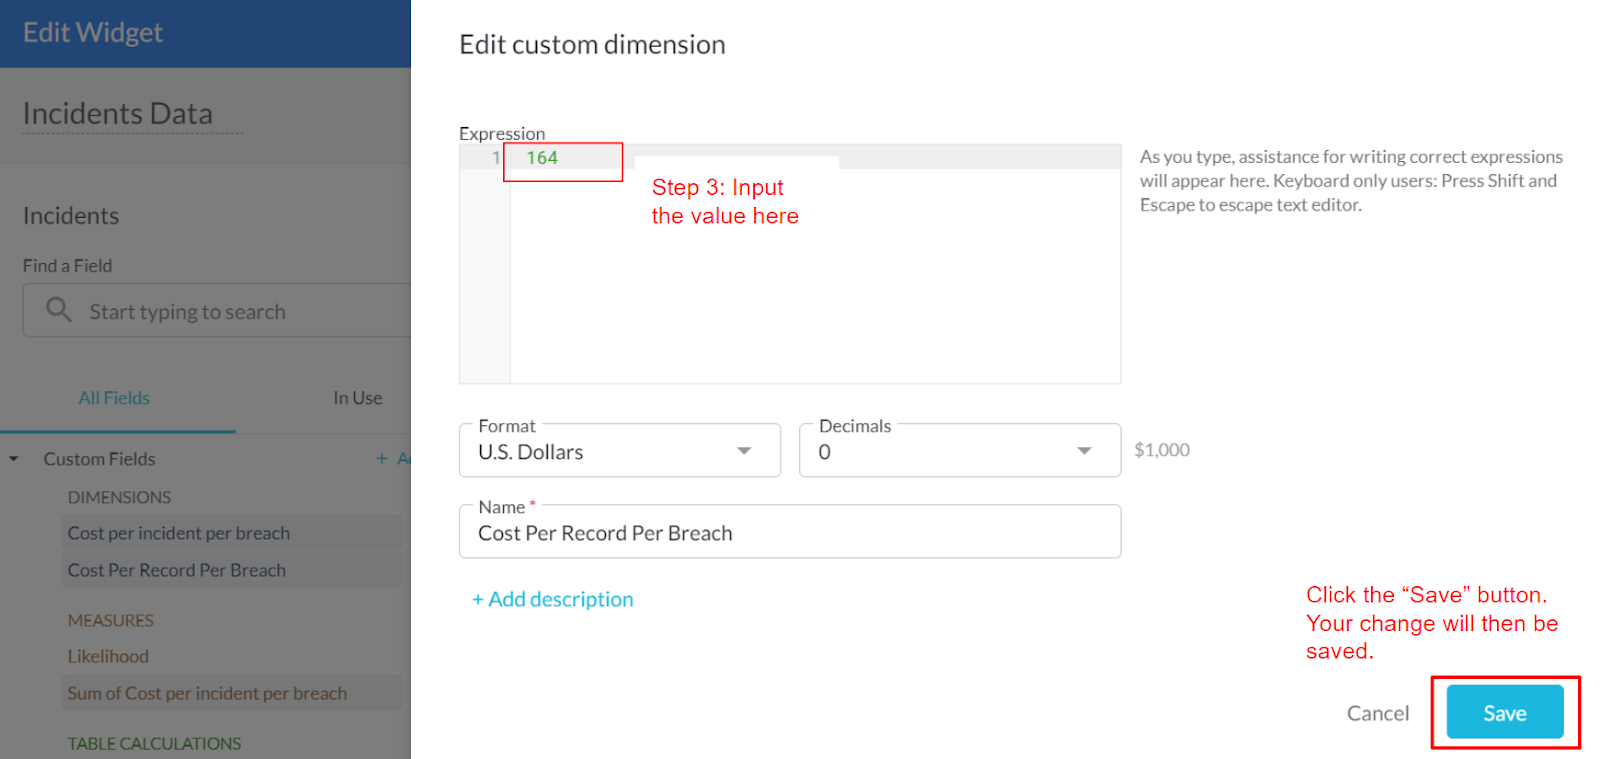
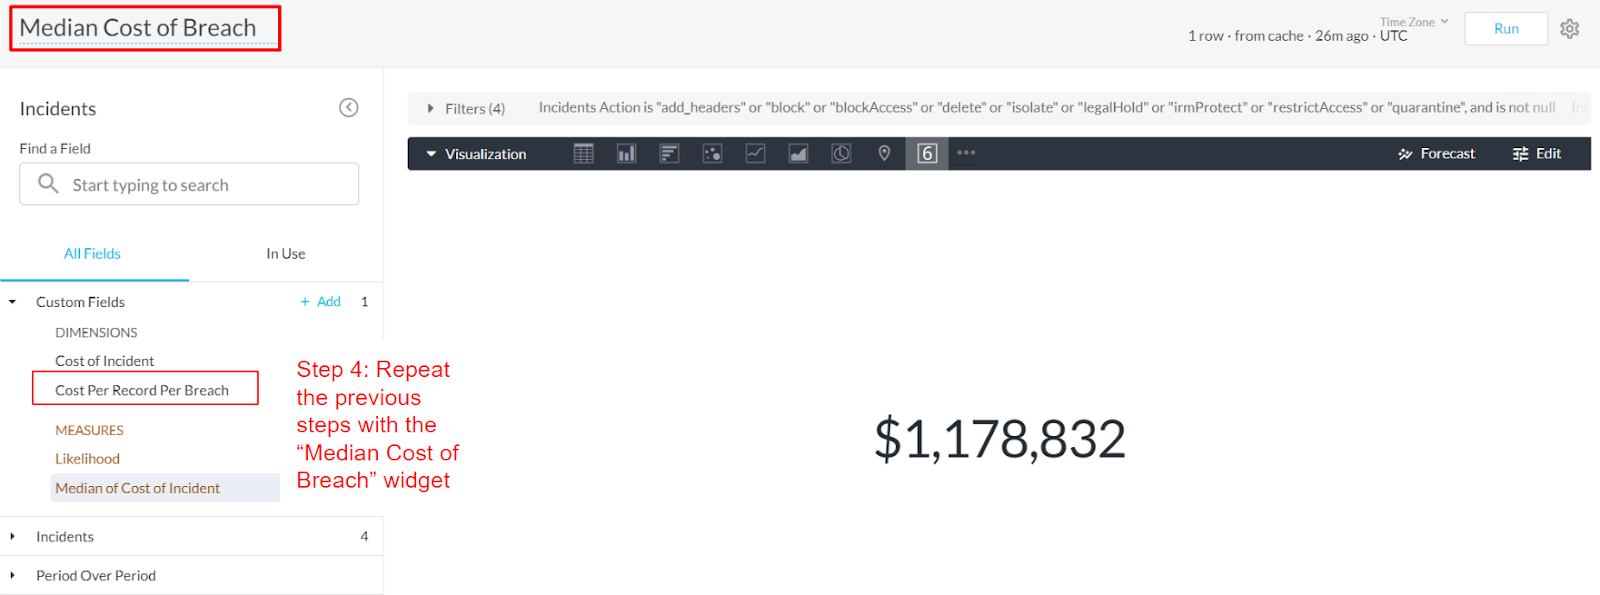

If you are going to further customize this section by changing anything in widget filters, please also be sure to make the changes to all three widgets in this section. For example, if you removed values from the “Action” filter in the “Incidents Data” widget, be sure to do the same change to the other two widgets: “Median Cost of Breach” and “# of Breaches Stopped” as well, otherwise inaccurate results will be returned.

Section 2: Malware Risk Reduction Customization
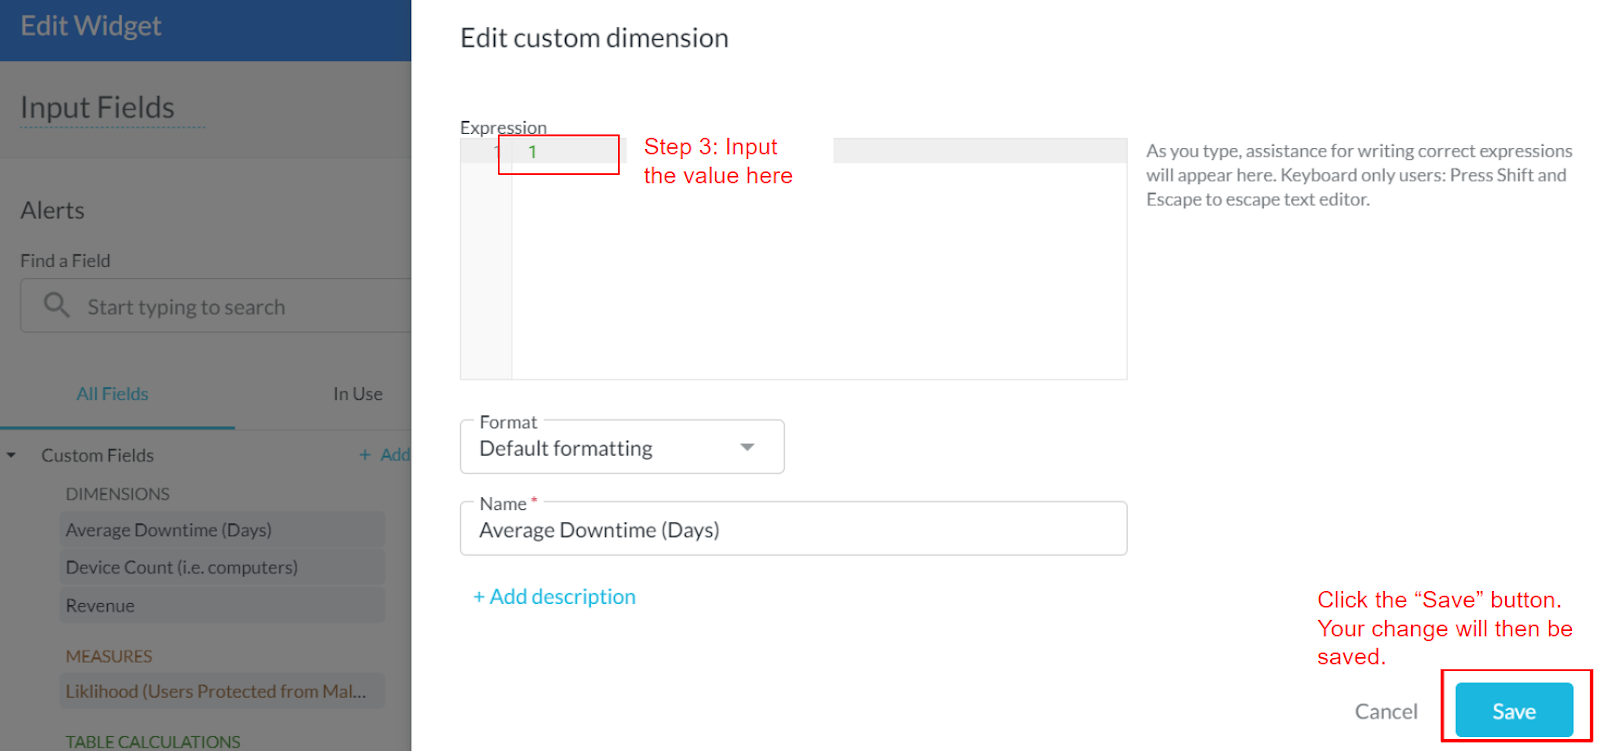
You will need to manually input your organization’s “Average Downtime,” “Device Count,” and “Revenue” for this section to show accurate data. Be sure to make the updates to all three widgets in this section. Please follow the instructions below to start your customization.
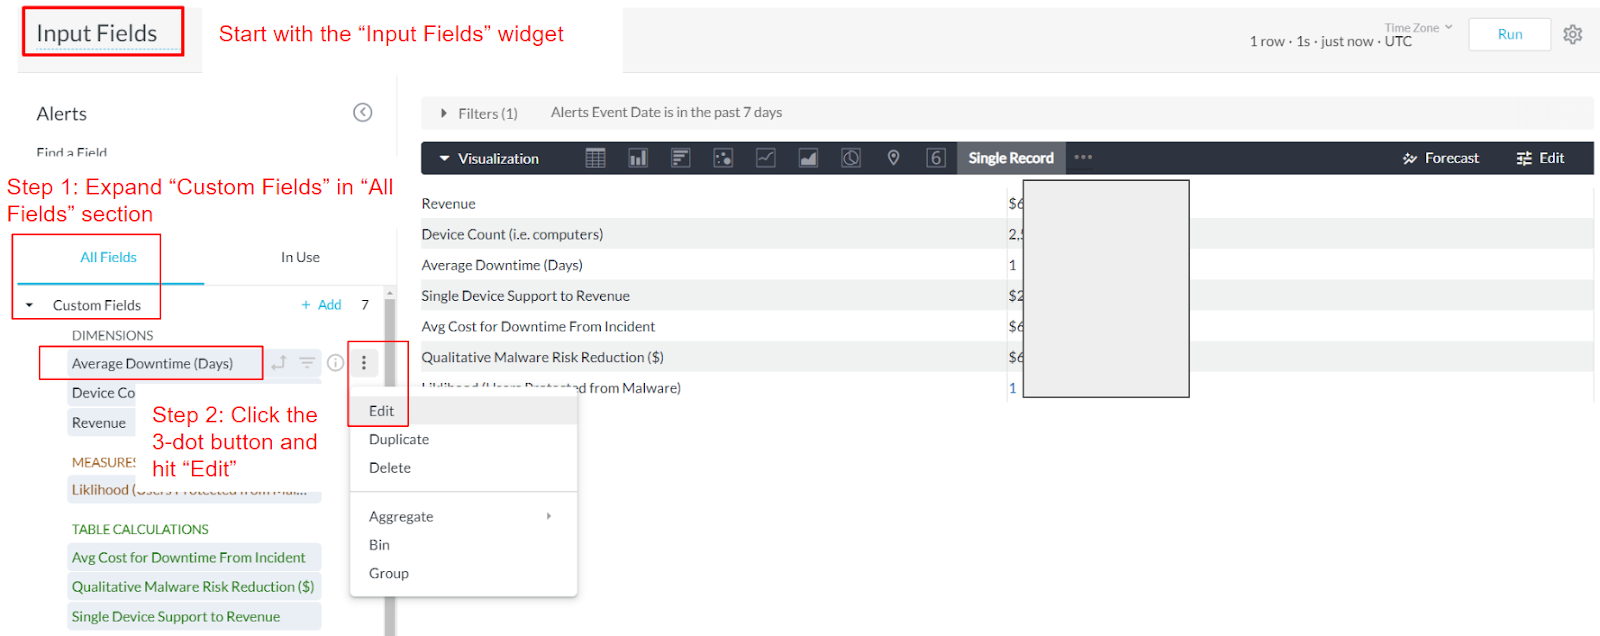

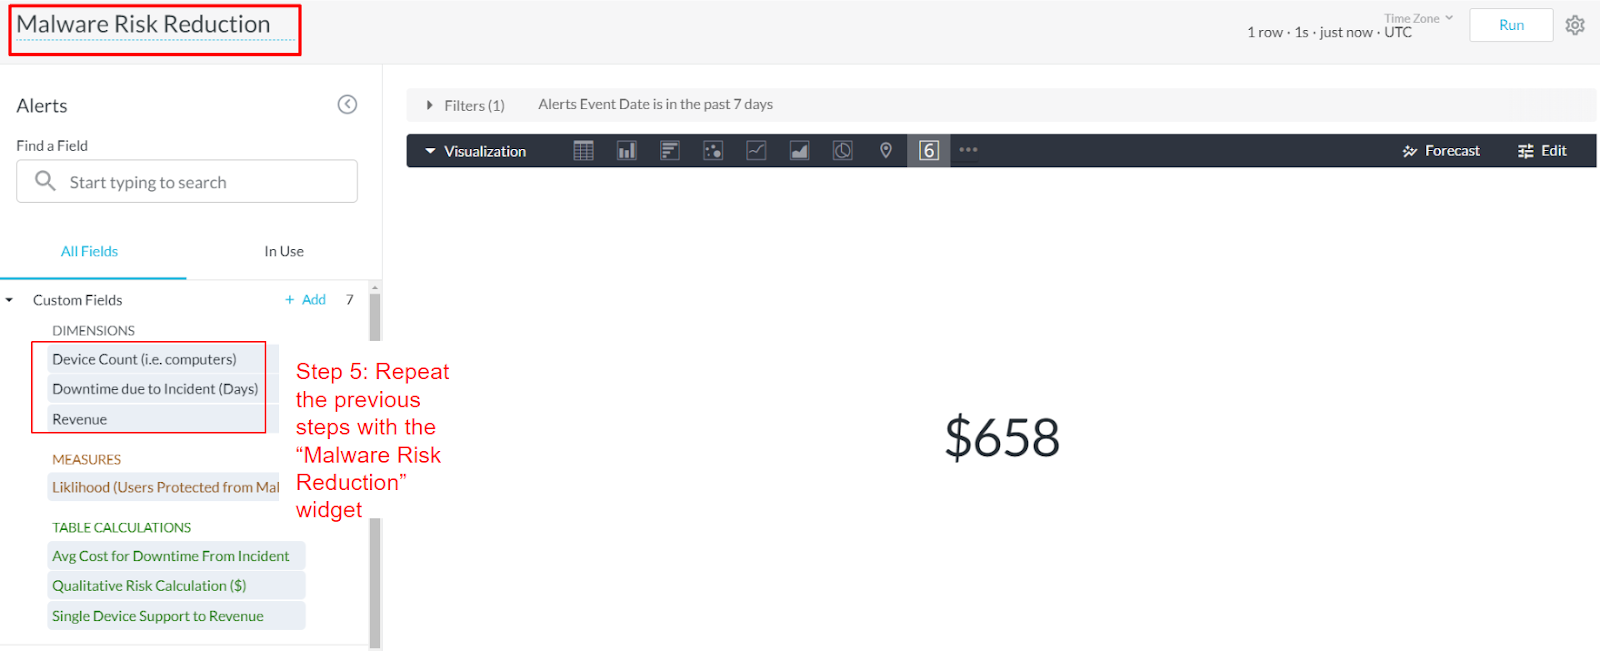
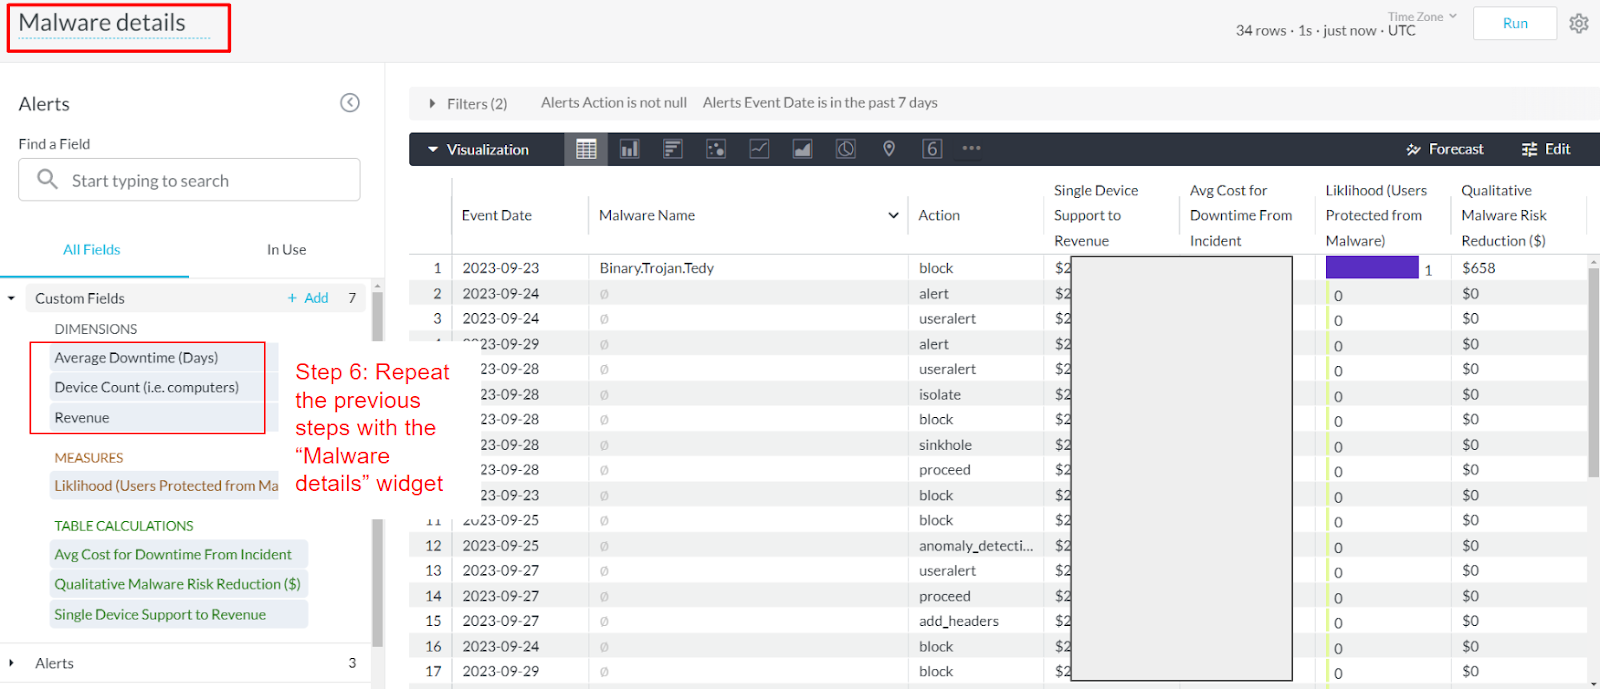
Again, if you are going to change anything in widget filters, please be sure to make the changes to all three widgets in this section as well.
The dashboard is attached below. Please import and view it in your own environment. Feel free to let us know if you have any questions or need any help!


