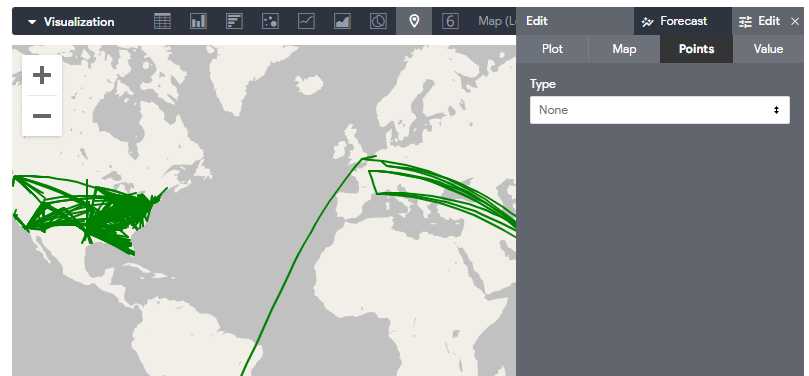
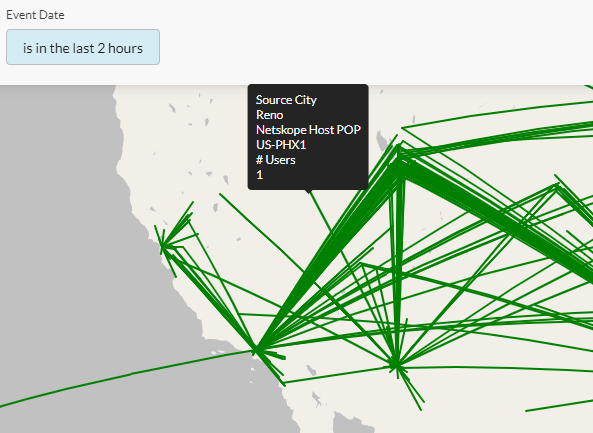
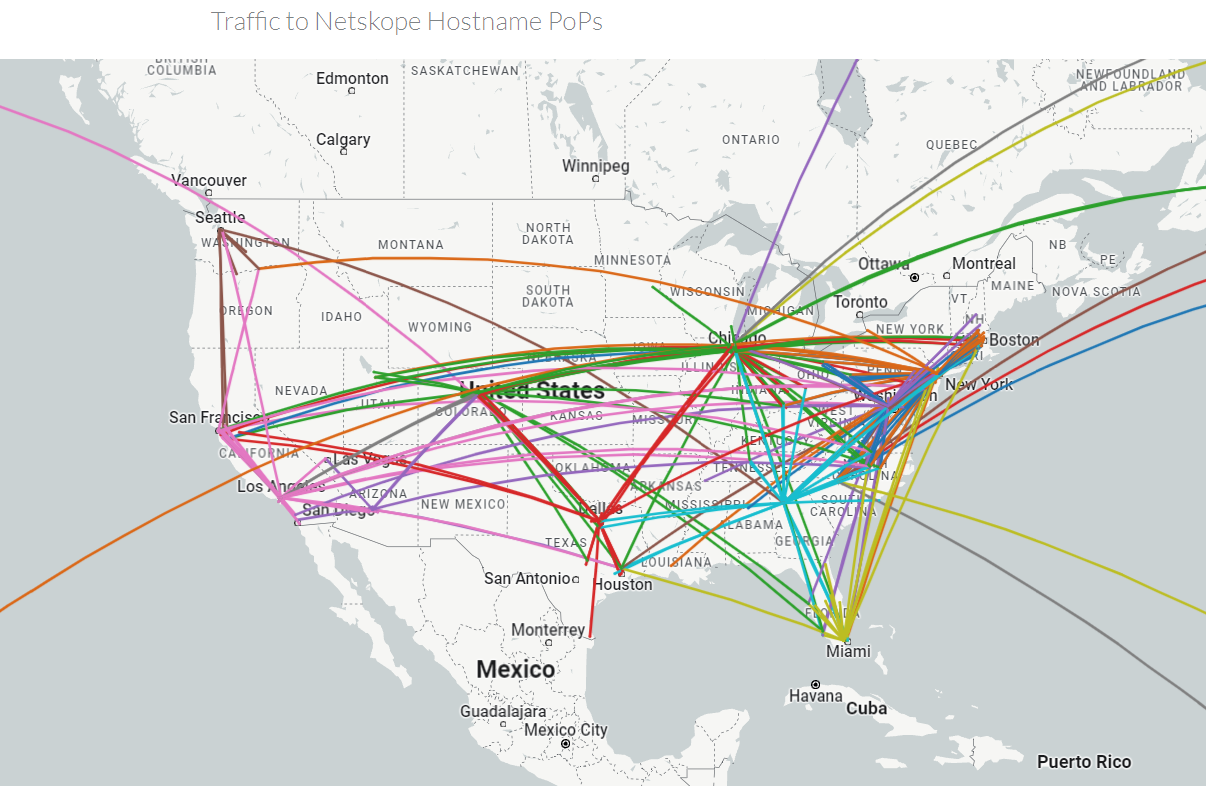
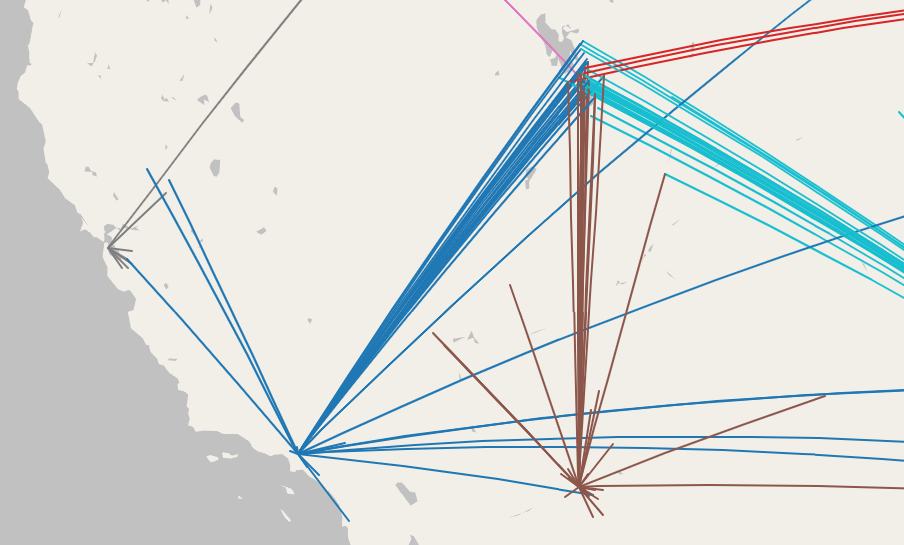
I've put together a quick map visualization, but I am not able to manipulate it in the manner I'd like to.

The editing options have a lot of control over how the points at the end of the line display, but I'm not really interested in the ends. Instead, I'd like to change how the lines are displayed. Am I overlooking something, or should I open an Enhancement Request to expose formatting controls for the lines themselves?
Specifically, I would like to color the line one end based on a string value associated with one of the points.


