Introduction
Netskope Private Access is a Zero-trust Network Access (ZTNA) that provides secure access to internal applications on behalf of your users. I focus pretty heavily on NPA in my day to day engagements and some of the most common questions I receive are on how the individual components of Netskope Private Access actually operate and route traffic. With that in mind, let’s take a look at the high level components of Netskope Private Access. As a quick note, while NPA does support both client and clientless access methods, this post focuses solely on the client based flows that occur on devices with the Netskope steering agent installed. It should also be noted that this flow applies to a remote user and flows for on-premise users will vary depending on your Netskope configuration. The abstracted flow for client based flows is below starting from the left side with a device with the Netskope agent installed all the way to the application via the Netskope Publisher on the right side.

Now of course, this is highly abstracted and in enterprise environments, you will have multiple data center and public cloud locations with numerous Publishers. For our purposes though, this is a way to quickly explain each subset of NPA communication. Before we dive into the individual communication phases, let’s quickly explain each of the components above from left to right:
- Netskope Steering Client
- The steering client handles traffic steering for Secure Web Gateway, Cloud Firewall, Netskope Private Access, and other real-time services. It also provides user identity, device classification, device location and other info to the Netskope Security Cloud for policy enforcement and other functions. This client does not perform any on-device enforcement, it simply determines if traffic should be sent to Netskope for processing or not.The Netskope Steering Client is also responsible for establishing TLS connectivity with the NPA Client Gateway.
- Netskope Private Access Client Gateway
- The NPA Client Gateway is the onramp for client traffic to the Netskope Security Platform. A number of other functions occur at the Gateway including policy enforcement for application access, periodic reauthentication of the user, and maintaining a mapping of which Publishers handle which applications and the Publisher Gateway those Publishers are connected to. Gateways reside at Netskope data planes across the globe and the Gateway endpoint will resolve to whichever data plane is closest to the end user.
- Netskope Private Access Publisher Gateway
- Publishers connect to their closest Publisher Gateway which resides at Netskope data planes across the globe. This connection is an outbound TLS tunnel that is persistent. Just like the client, the Publisher has built in mechanisms to connect to the closest Netskope data plane for optimal performance.
- Netskope Private Access Publisher
- The Publisher is a lightweight virtual machine that is deployed to your public cloud or private data center locations. The Publisher makes an outbound connection over TLS to the closest Publisher Gateway and uses this tunnel to route traffic destined for your internal applications following policy evaluation and traffic steering at the Gateway and client.
So just to recap, at a very high level, NPA provides access by steering specified applications (or optionally networks) to the Netskope Security Platform and then to a lightweight virtual machine in your public cloud or private data center called a Publisher. With that in mind, let’s take a quick look at each step in the process.
Client to NPA Gateway
Before we get into how the client intercepts traffic, let’s quickly review where that traffic is steered. One of the client’s responsibilities is to establish a TLS tunnel to the closest Netskope Private Access Client Gateway. All NPA traffic is sent over this TLS tunnel. From the first diagram, this is represented by the orange line from the NPA endpoint to the NPA Client Gateway:

You can verify that this tunnel is connected in the client configuration:

If this tunnel isn’t established, the Netskope client will not intercept the internal app traffic and the user or device will not have access to internal applications. You will notice in the screenshot that Private Access is Connected via a User Tunnel. NPA also has the concept of a machine level tunnel called Prelogon Connectivity which allows for machine level connectivity to internal applications for updates, password resets, and other functions. In either case, the client must establish a TLS tunnel to the Client Gateway. You can observe the tunnel status via the configuration shown above and in the Netskope WebUI under the Device details:

The Client Gateway is available at data planes across Netskope’s global NewEdge network. While this won’t go into details on how the client selects its closest data plane, it’s important to understand that the client uses NewEdge Traffic Management 2.0 with a fallback to either NewEdge Traffic Management 1.0 or to local DNS to select the closest data plane for traffic steering. (Note: Depending on your Netskope tenant, you may need to request that NewEdge Traffic Management 2.0 is enabled for NPA. Please contact your local Netskope account team for additional information or to request this latency based data plane selection You can see this process in the npadebuglog.log file starting with the client measuring latency to the respective gateways:
0x0 Got 9 Gateway IPs
0x0 GW FQDN [gateway.npa.goskope.com] GW IP [163.116.134.21] POP [US-MIA1] RTT [23 ms]
0x0 GW FQDN [gateway.npa.goskope.com] GW IP [163.116.137.4] POP [US-ATL1] RTT [40 ms]
After ordering the closest data planes the client will then select the lowest latency data center unless there is maintenance or another case where the data plane is not accepting traffic:
0x0 Client will connect to GW=[US-MIA1] IP=[163.116.134.21].
The client will then initiate a TLS session to the gateway. Part of this TLS session establishment includes checks for the user’s Netskope certificate, device posture, and authentication status. You can see the client posting this status in the npadebuglog.log:
Received device info request. Device Info: XXXXXXXXXXXXXXXXXXXXXXXXXXX
If this check is passed then you will see client steering and interception begin which is explained in the next section.
Client Interception and Steering
Recall that the Netskope steering client performs multiple functions but for NPA, the most important is intercepting and routing traffic to the Gateway. Before we jump into the technical intricacies of how this occurs, it’s important to understand how Netskope determines which applications to send to Netskope.
Netskope uses an object named a Service Routing Protocol which you may hear referred to as SRP. The SRP includes information on the applications that a user or device is entitled to based on the policies set by administrators. To see this in action, consider the following app definition:
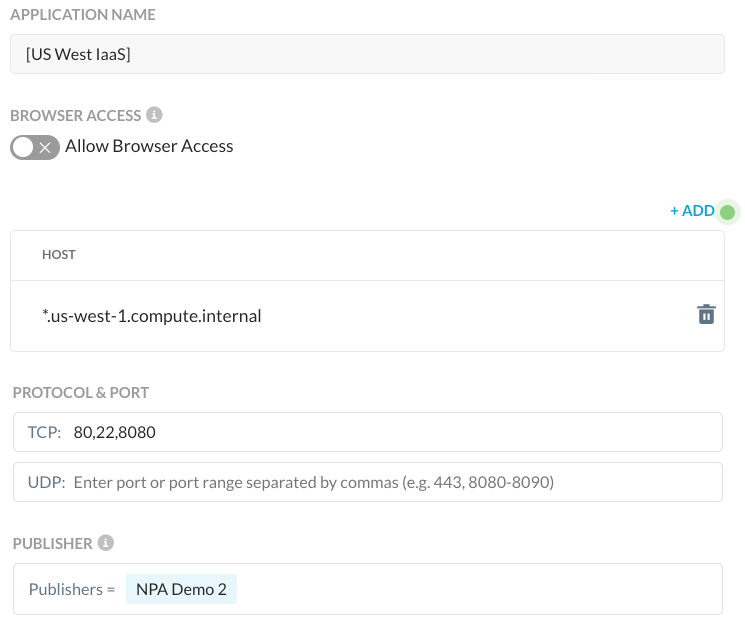
I’ve assigned this policy to my user:
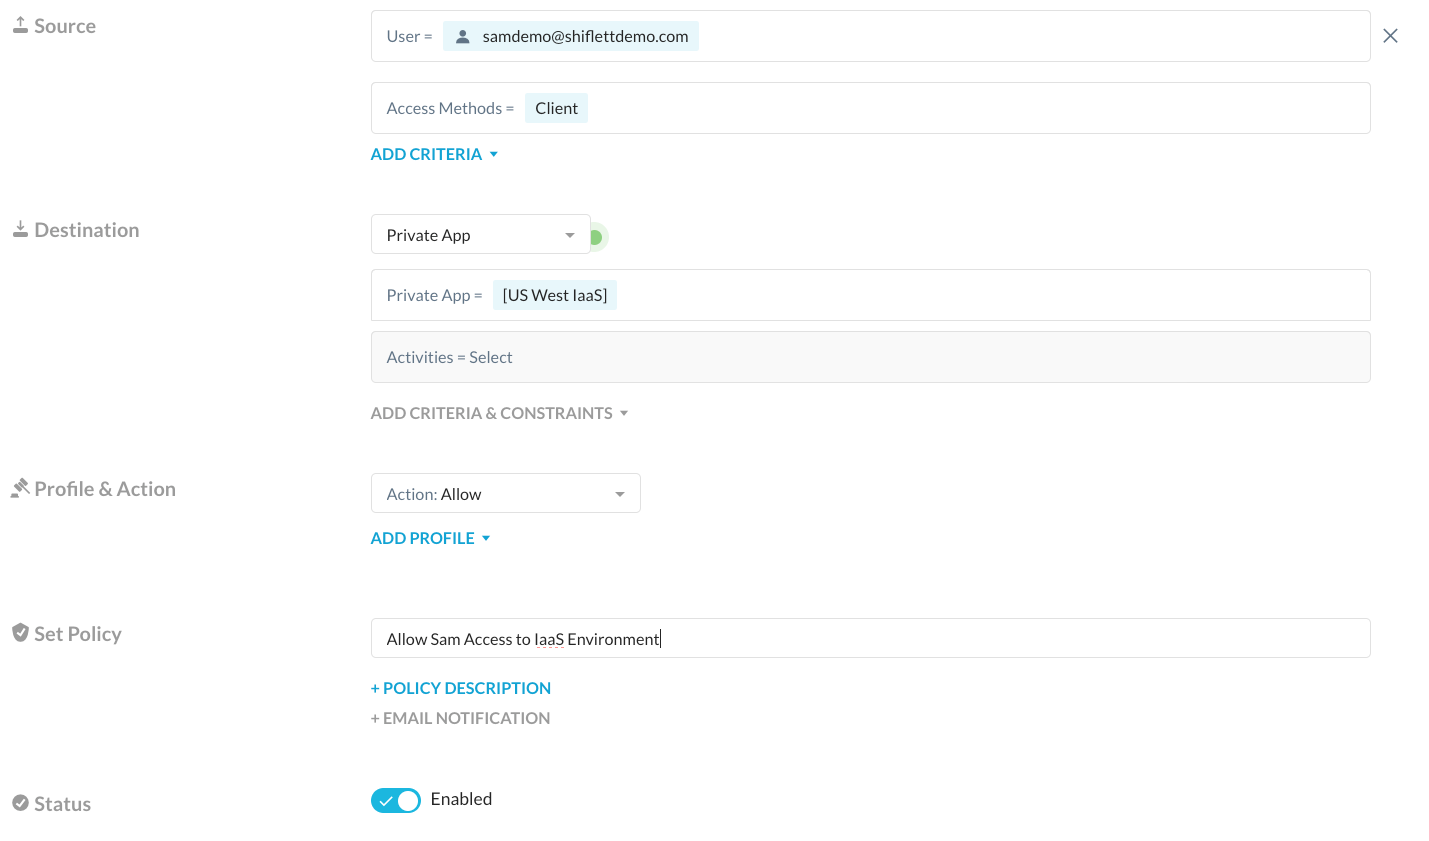
I have created another policy that explicitly blocks access for a subset of these apps as well:

How does the client know to steer these applications? Enter the SRP. An SRP is generated for users and devices that includes the superset of all NPA policies in Real-time Protection that apply to the user including policies scoped to the user, group, OU, and to all users. As a side note, the fact that the SRP is generated off of the superset of all policies assigned to the user means the order of Private Apps in Real-time Protection policy doesn’t matter. The client pulls a new SRP every 15 minutes and at tunnel establishment and you can see this status in the npadebuglog.log folder:
policy.cpp:572:build():0x52a2da0 SRP live status is 1.
The status “1” indicates that a new SRP was successfully pulled. Now let’s take a look at the SRP that the client pulls down based on the two policies assigned to my user. You can see the SRP in the npadebuglog.log (excerpts below) which provides the same app definitions to the local client:
Added protocols us-west-1.compute.internal:tcp:80-80; tcp:22-22; tcp:8080-8080;
…
Added protocols ip-10-0-0-242.us-west-1.compute.internal:tcp:22-22;
Adding Host Rule Name: Block SSH Access for Sam ip-10-0-0-242.us-west-1.compute.internal:tcp:22-22; Action:remediate
As you can see the client gets details on the application definitions that should be intercepted and sent to Netskope. While the examples are domain names which is the preferred method for ZTNA, note that app definitions can be scoped to IP addresses and CIDR blocks as well. There is one other item to be aware of at the client level. These example apps are defined by domain names, so how does the client know to steer them? The client has a default behavior to monitor the DNS queries and reply back with a Netskope stub IP address if a host is in an app definition. For example, if we perform an nslookup of ip-10-0-0-242.us-west-1.compute.internal, we get a 100.64.0.0/10 IP address:

This 100.64.0.3 address comes from the Netskope client which has implicit logic to steer this traffic through NPA. As mentioned, this is the default behavior of the client but there are cases where the real IP address of an application is needed such as split brain DNS where a remote device should resolve IPs differently than a device that is on-premise. Administrators can override this behavior by enabling the “Use Publisher DNS” on the app definition:
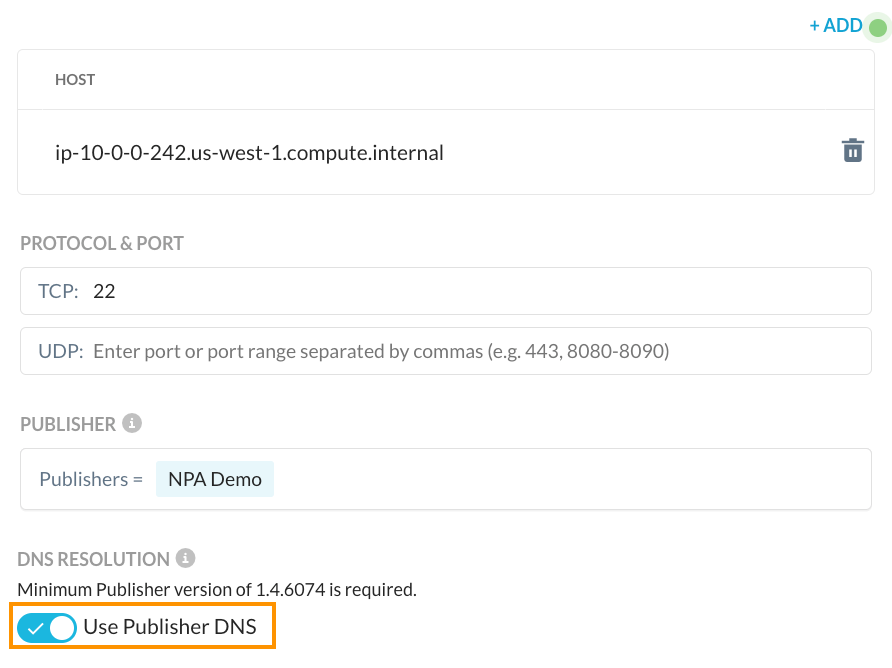
Once enabled, the client will no longer reply back with the stub IP address. Instead, it will forward the DNS request for any host in that app definition to the assigned Publishers where the DNS resolvers assigned to the Publisher will be used to resolve the hostname. This response is forwarded back to the client and as a result, the endpoint will see the real IP address of that host:

It’s important to understand that because this IP address is not in the 100.64.0.0/10 range that the client implicitly intercepts, you also need to add the IP address to an app definition if you want NPA to intercept this traffic. See here for additional information on Publisher DNS and best practices.
Once the client has intercepted the traffic, it steers it over the TLS tunnel to the NPA Gateway. This steering is recorded in the npadebuglog.log file and you can also use the client’s native packet capture capability to see this traffic. After initiating a connection to our internal web server there are log entries that indicate the traffic was intercepted:
Publisher DNS Disabled
Getting policy rule for host ip-10-0-0-242.us-west-1.compute.internal ip 3004064, proto 6 port 80
An inner tunnel packet capture also shows this process starting with the DNS resolution from the client. The response includes the stub IP 100.64.0.3:

This is followed by the actual TCP and HTTP connections:

Publisher DNS Enabled
Tunnel DNS request for ip-10-0-0-242.us-west-1.compute.internal type: 1
Getting policy rule for host 10.0.0.242 ip f200000a, proto 6 port 80
An inner tunnel packet capture also shows this process starting with the DNS resolution from the Publisher with the real IP address of 10.0.0.242:

This is then followed by the actual TCP and HTTP connections:

These packets showing up in the inner tunnel demonstrate the client intercepting and steering the configured traffic over the TLS tunnel to the NPA gateway.
NPA Client Gateway and Publisher Gateway
The NPA Client Gateway is a data plane component where traffic from clients is processed against policy. Once the traffic is steered, Netskope evaluates whether the user or device should have access to the requested application based on device classification, user, device, and other policy constraints.
Further, the Gateway also handles mapping where the applications are and which Publisher to route traffic to based on the same app definitions, Publisher availability, and load balancing. The Gateway retains this information and dynamically updates it based on the SRP and Publisher availability. You can see the Publisher that handled the particular session or connection within SkopeIT under the Network Events.
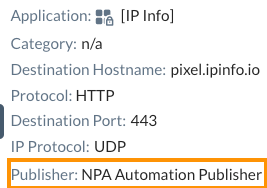
Once the Publisher has been selected, the NPA Gateway sends it to the appropriate Publisher Gateway. Just as the client connects to the closest Gateway, a Publisher will connect to the closest Publisher Gateway. This is dynamic so there may be cases where a data plane is under maintenance or pulled out of the NewEdge network. Publishers and clients will automatically connect to the next closest NewEdge data plane to maintain connectivity. This happens transparently and the NPA Client Gateway maintains a mapping of apps to Publishers to Publisher Gateway(s). In our diagram earlier, we showed that the Client Gateway connects to the appropriate Publisher Gateway(s):

Once the Publisher is selected, this traffic is routed over a TLS tunnel to the Publisher Gateway. There is also a concept of Publisher stickiness to retain Publisher selection based on user and application.
Publisher Gateway to Publisher
This step is fairly simple just like the Client Gateway to Publisher Gateway connectivity.

The Publisher Gateway routes the traffic to the selected Publisher over a TLS tunnel that the Publisher established to the Publisher Gateway. Just like the client, you can observe this data plane selection in Publisher agent logs:
Received response for host Publisher Gateway.npa.goskope.com request. The result is 0. Resolved IP is 163.116.140.71
{"eventId": "NPACONNECTED", "publisherId": "XXXXXXXXXXXXX", "Publisher GatewayIp": "163.116.140.71", "tenant": "ns-XXXX"}
It’s also reflected in the Publisher Wizard when you initially login to the Publisher:

The Publisher receives this traffic via the tunnel which you can see via a TCPDump. For example when connecting via RDP (port 3389) you can see the traffic:

The Publisher then routes this traffic to the appropriate host which is the final step.
Before we jump to the Publisher to app flow, it is important to note that we have abstracted this to a single flow to a single Publisher. In reality, Netskope Private Access also includes a mechanism for selection of the Publisher based on latency from the user’s gateway to the respective Publisher. A deeper discussion and furhter information on latency based Publisher selection can be found here. In short though, when you assign Publishers to an app definition, Netskope will measure the latency to the Publishers and prefer Publishers that fall into lower latency ranges.
Publisher to App
In the previous section, you saw the application traffic routed from the Publisher Gateway to the Publisher. The final step is routing this traffic from the Publisher to the application.
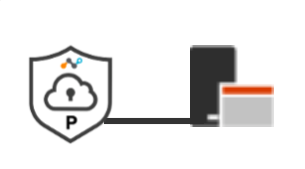
The Publisher applies a NAT to this traffic on the interface(s) and routes it to the appropriate application. You can observe this by capturing the traffic on the outbound interface(s). For example, you can see the traffic on the primary Publisher interface below on the local subnet destined for a server on RDP:

As the Publisher NATs the traffic, the end application will see the Netskope IP address. On the RDP server I connected to using Netskope Private Access, the connections are received from the Publisher’s interface:


