




Overview
The Netskope data connector for Microsoft Sentinel (Content Hub solution Netskope Data connector) now includes a Netskope Client Status connector. It ingests Netskope Client device status records into your Sentinel workspace through the Codeless Connector Framework (CCF) REST API poller, so you can monitor the health and posture of your Netskope Client fleet alongside the rest of your security telemetry.
The solution also ships with:
- 1 workbook: a Client Status dashboard
- 2 analytics rule templates: detections for users disabling Netskope protection
This article covers why this data matters, the permissions you need, how to set up the connector, and what you get once data starts flowing.
Why do you need Netskope Client Status data?
Netskope alerts and events tell you what users and devices did. Client Status data tells you whether the Netskope Client that enforces your policy is installed, running, healthy and connected on each endpoint. Without it, there are blind spots:
- Coverage gaps: devices that have stopped reporting (stale devices) are not being steered to Netskope, so their traffic is not inspected.
- Tampering and defense evasion: users or malware can disable Internet Security or Private Access (NPA) on the client. You want to know when that happens.
- Connectivity problems: tunnel disconnects, and the reasons behind them, point to network, VPN or endpoint issues that affect protection and user experience.
- Version and OS drift: older client versions and unsupported OS builds create inconsistent protection and support overhead.
- Investigation context: when an incident involves a device, you can see its client state, location (last public IP), make and model, and recent client events in one place, and correlate with other Sentinel tables.
- Operational reporting: deployment progress, install trends, and the percentage of healthy clients.
The connector delivers this in the NetskopeClientStatus_CL table, so you can query it with KQL, build detections, and join it with other data.
Prerequisites
RBAC role and permissions for the REST API v2 token
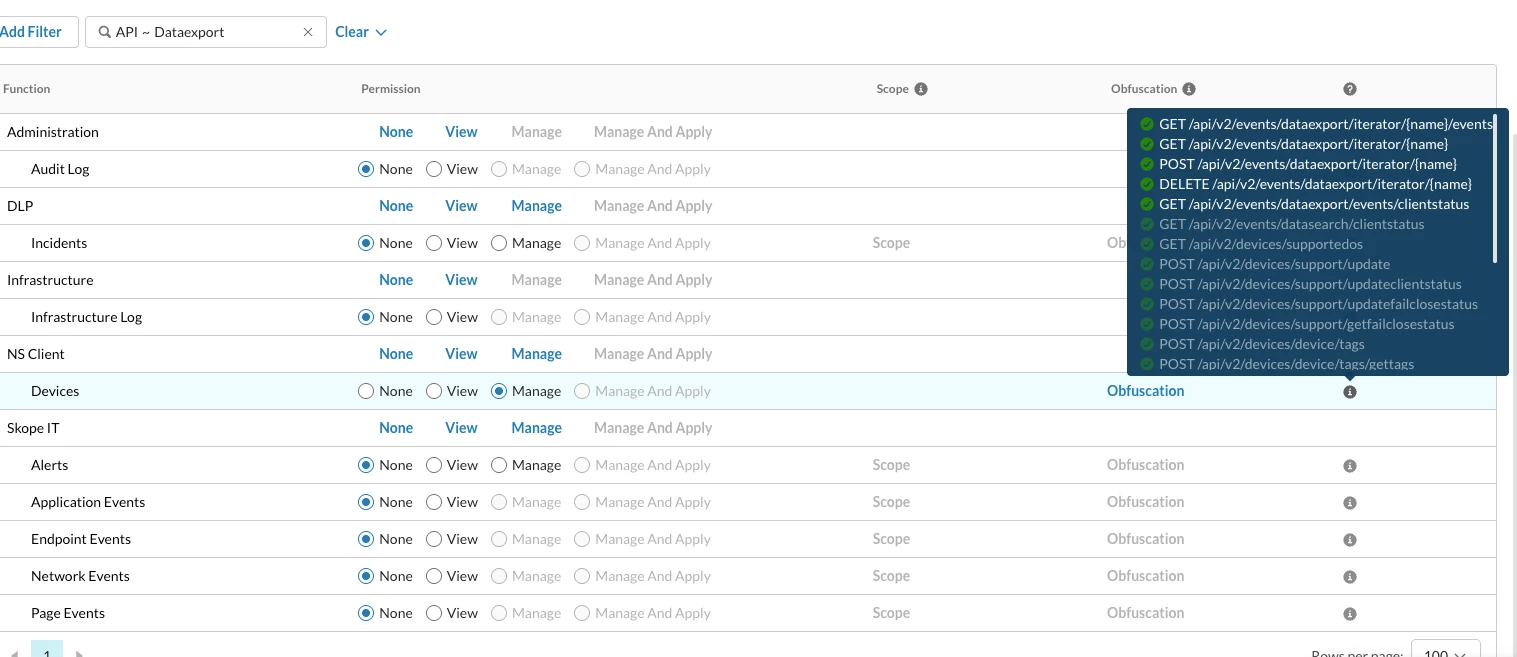
The connector authenticates with a Netskope REST API v2 token. Create a dedicated RBAC role for it in the Netskope tenant and apply least privilege. The role needs:
| Function | Sub-function | Permission |
|---|---|---|
| NS Client | Devices | Manage |
All other functions can stay at None.
Why Manage and not View: Client Status is read through a dedicated iterator, so the token must be able to create and read the iterator, not just read events. The Devices: Manage permission covers these Data Export endpoints:
POST /api/v2/events/dataexport/iterator/{name}: create the iteratorGET /api/v2/events/dataexport/iterator/{name}: read iterator detailsGET /api/v2/events/dataexport/iterator/{name}/events: poll events from the iteratorGET /api/v2/events/dataexport/events/clientstatus: client status events
💡 Tip: In the Netskope RBAC role editor, filter by API ~ Dataexport and hover the info icon next to a function to see exactly which endpoints it grants.
Other requirements
- Workspace: read and write permissions on the Log Analytics workspace used by Microsoft Sentinel.
- Netskope organisation URL: your tenant URL, for example
<your-org>.goskope.com. - Netskope API v2 key: a token created with the RBAC role above.
- Client Status iterator: unlike the Alerts and Events data types, Client Status has no default or auto-created iterator. You create it once in Netskope (Step 2 below).
Setup
Step 1: Install the solution from Content Hub
- In Microsoft Sentinel, go to Content management > Content hub.
- Search for Netskope and install the Netskope Data connector solution.
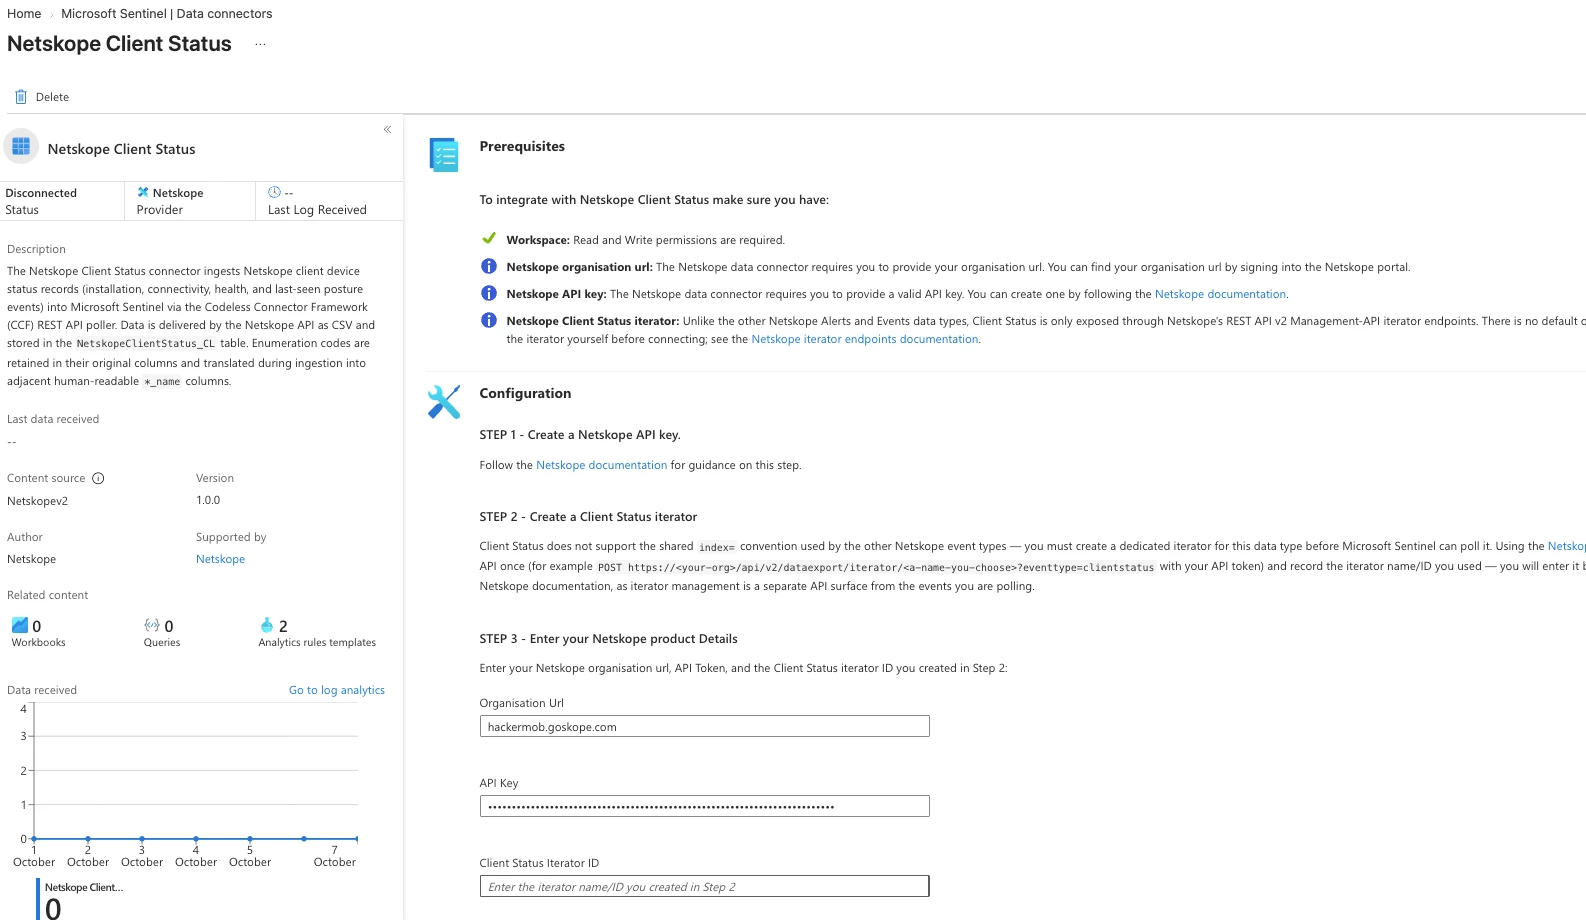
- Open Configuration > Data connectors and select Netskope Client Status.
Step 2: Create the Client Status iterator in Netskope
The connector page asks for a Client Status Iterator ID. Create it from the Netskope Swagger docs:
- In your Netskope tenant, open the REST API v2 Swagger docs and authorize with your API token.
- Find
POST /api/v2/events/dataexport/iterator/{name}. - Enter any value for
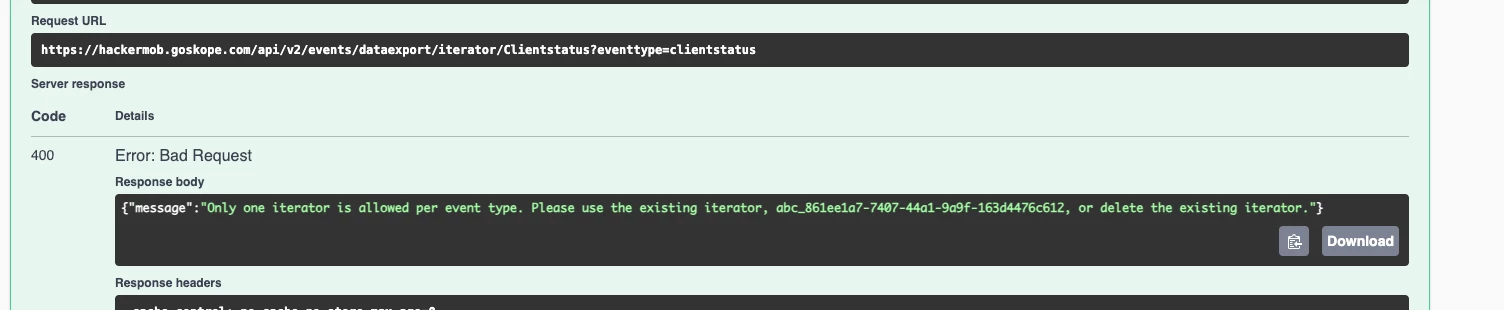
name(for exampleClientstatus) and seteventtypetoclientstatus. - Click Execute.
- Copy the iterator name/ID you used. You will enter it in the connector.
If the iterator already exists
Netskope allows only one iterator per event type. If one exists, the call returns a 400 Bad Request:
Only one iterator is allowed per event type. Please use the existing iterator,
<iterator-id>, or delete the existing iterator.
In that case, use the iterator ID returned in the error message.
[SCREENSHOT 4: 400 response showing the existing iterator ID]
⚠️ Important: Make sure the same iterator is not used by another integration (another SIEM, script or connector). Iterators keep track of the read position. If two consumers share one, each will receive only part of the data. If another integration uses it, delete and recreate it only after confirming that is safe.
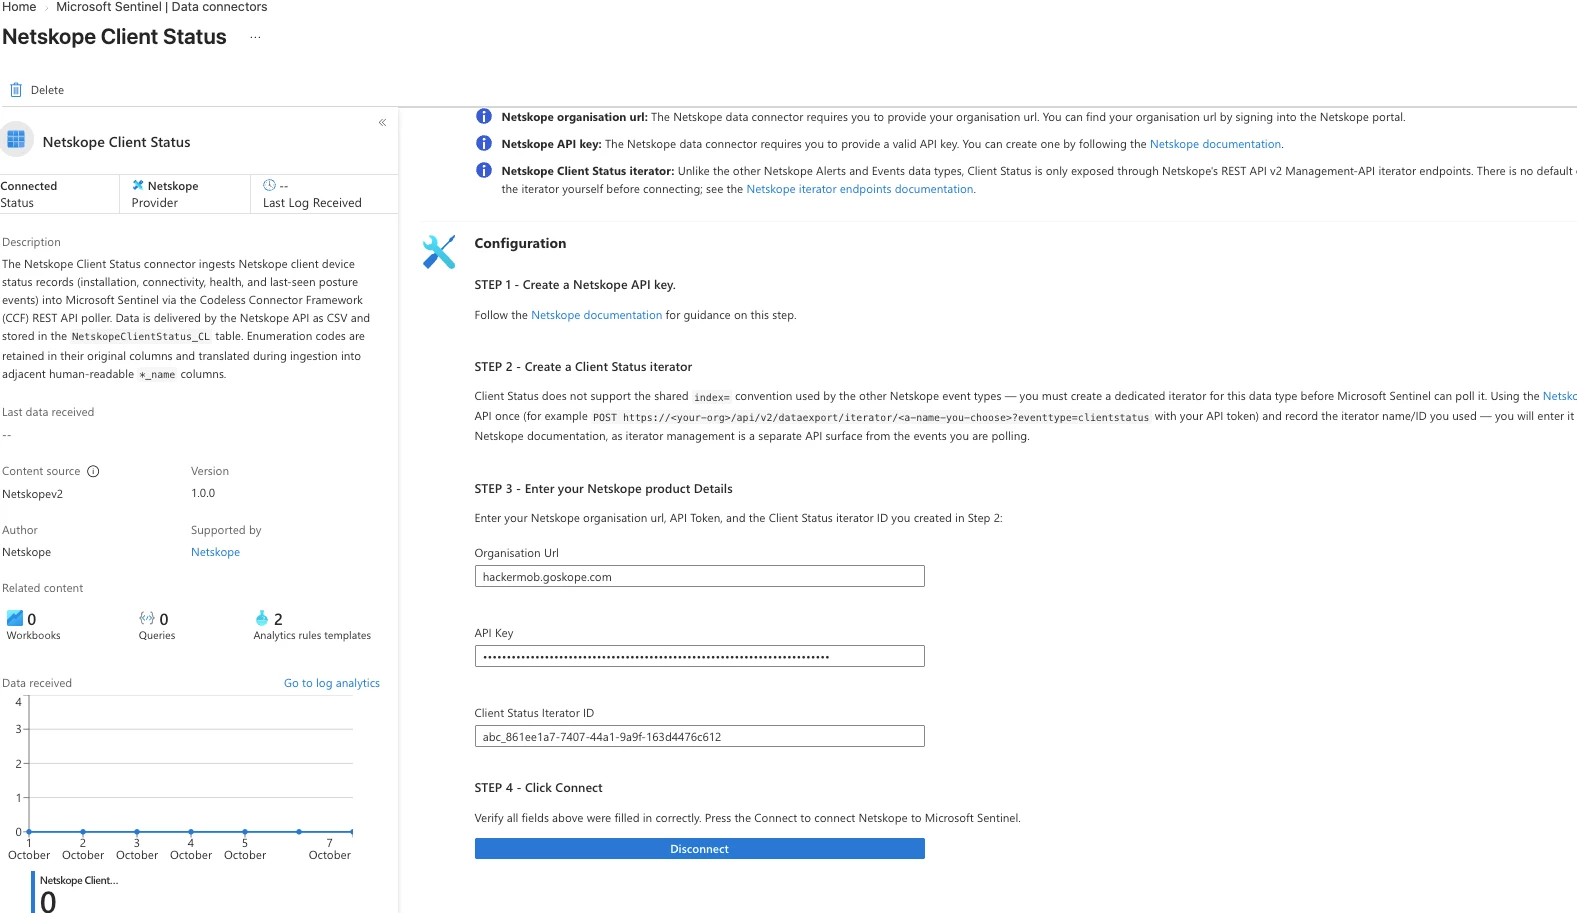
Step 3: Configure and connect
On the connector page, enter:
| Field | Value |
|---|---|
| Organisation Url | <your-org>.goskope.com |
| API Key | The Netskope REST API v2 token |
| Client Status Iterator ID | The iterator name/ID from Step 2 |
Then click Connect.
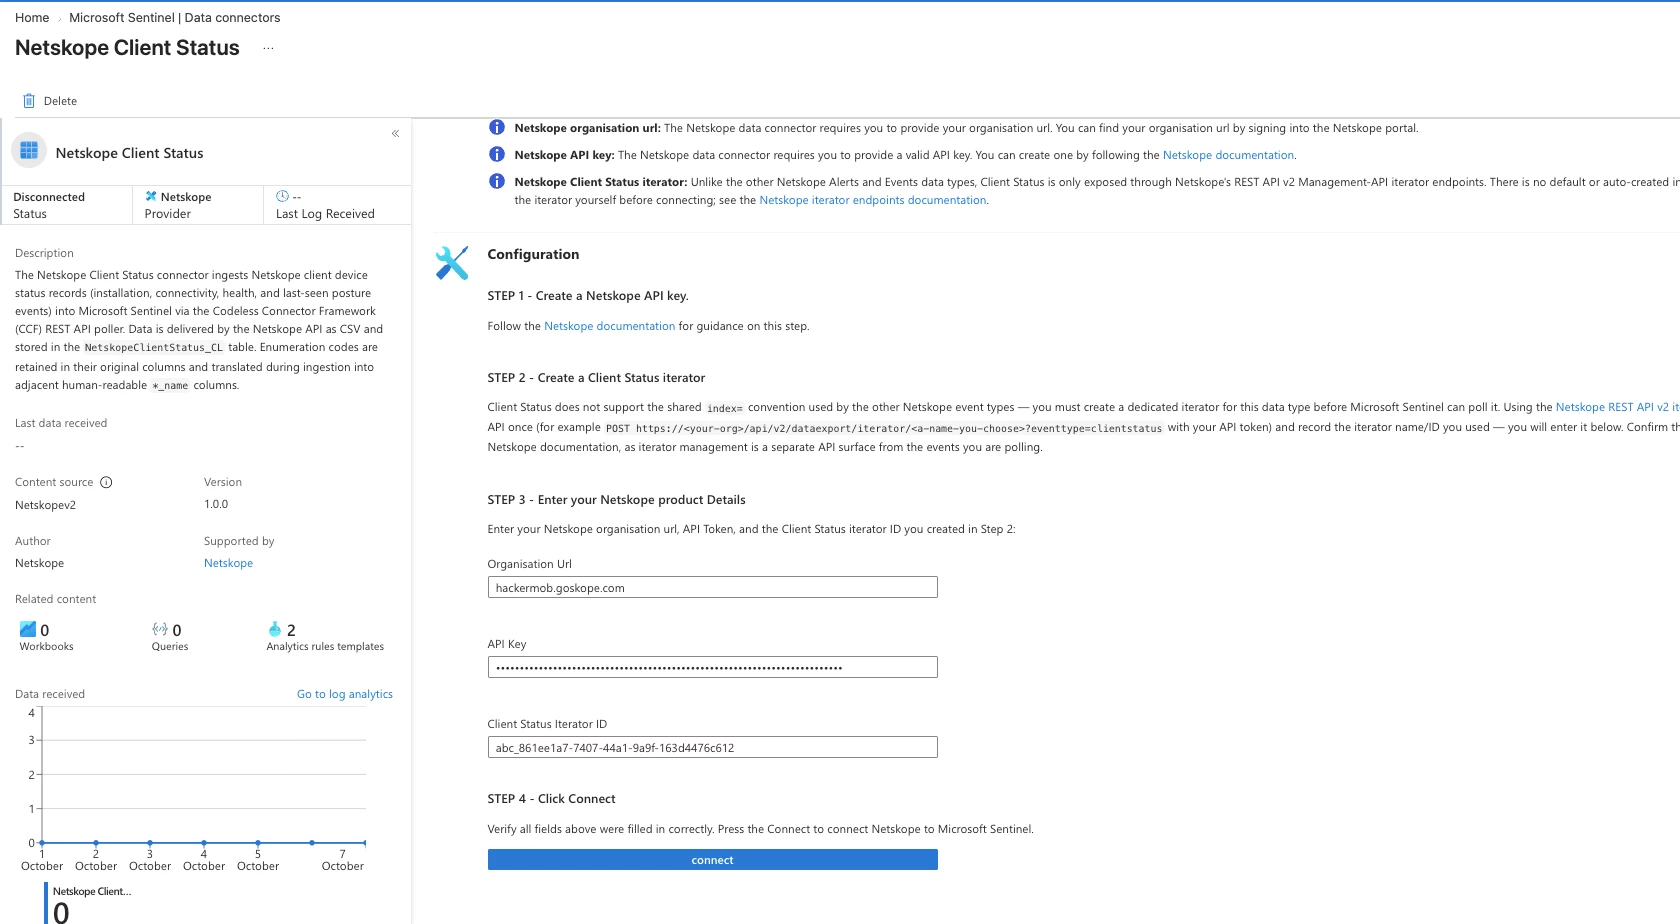
The connection takes about 2 to 3 minutes. When it succeeds, the button changes to Disconnect and the status shows Connected.
Step 4: Verify data in Log Analytics
Open Logs and run:
NetskopeClientStatus_CL
| sort by TimeGenerated desc
Client Status data is delivered as CSV and stored in NetskopeClientStatus_CL. Enumeration codes are kept in their original columns and also translated during ingestion into adjacent human-readable *_name columns. The table includes fields such as device_id, device_hash, guid, client_version, client_install_time, heart_beat, enriched, and geolocation details (country, city, continent, asn).
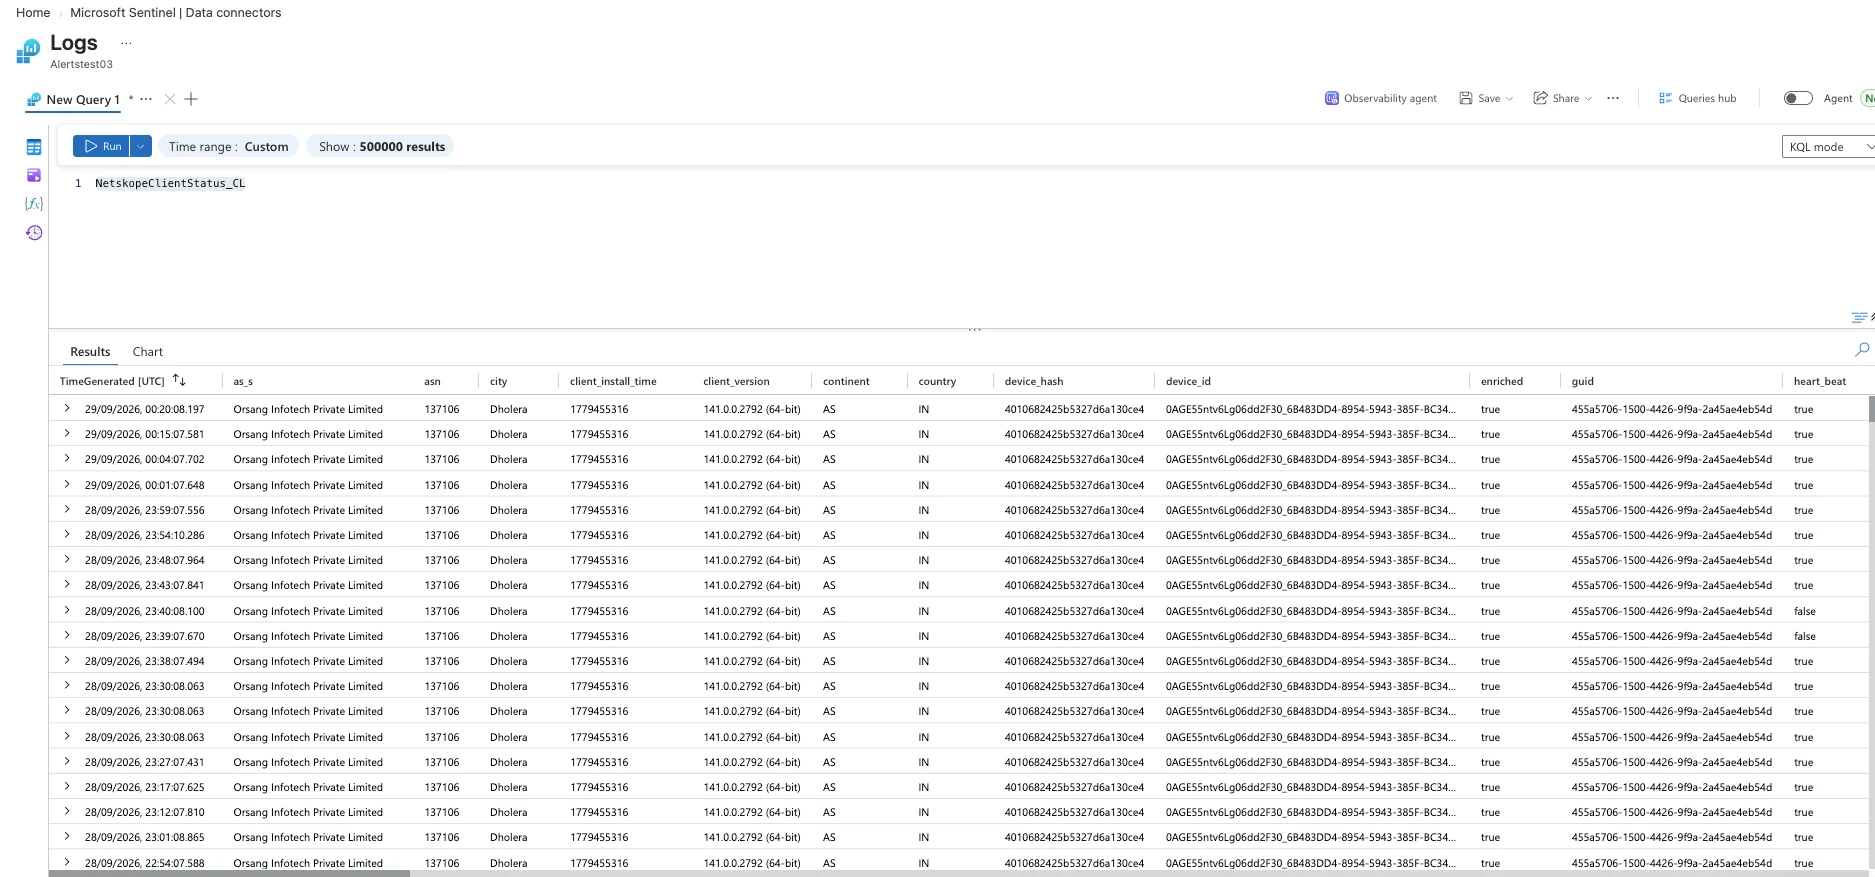
Netskope Client Status data is now flowing into Microsoft Sentinel.
Workbook: Netskope Client Status
The solution includes a workbook that turns the raw table into a fleet-health dashboard. Open it from Threat management > Workbooks > Templates (save it to use it).
Global filters: Time range, Operating system, Client status, Device classification, Client version, a configurable stale device threshold (default: 3 days), a host/user/public IP search, and a selected-device drilldown.
The workbook is organized into tabs:
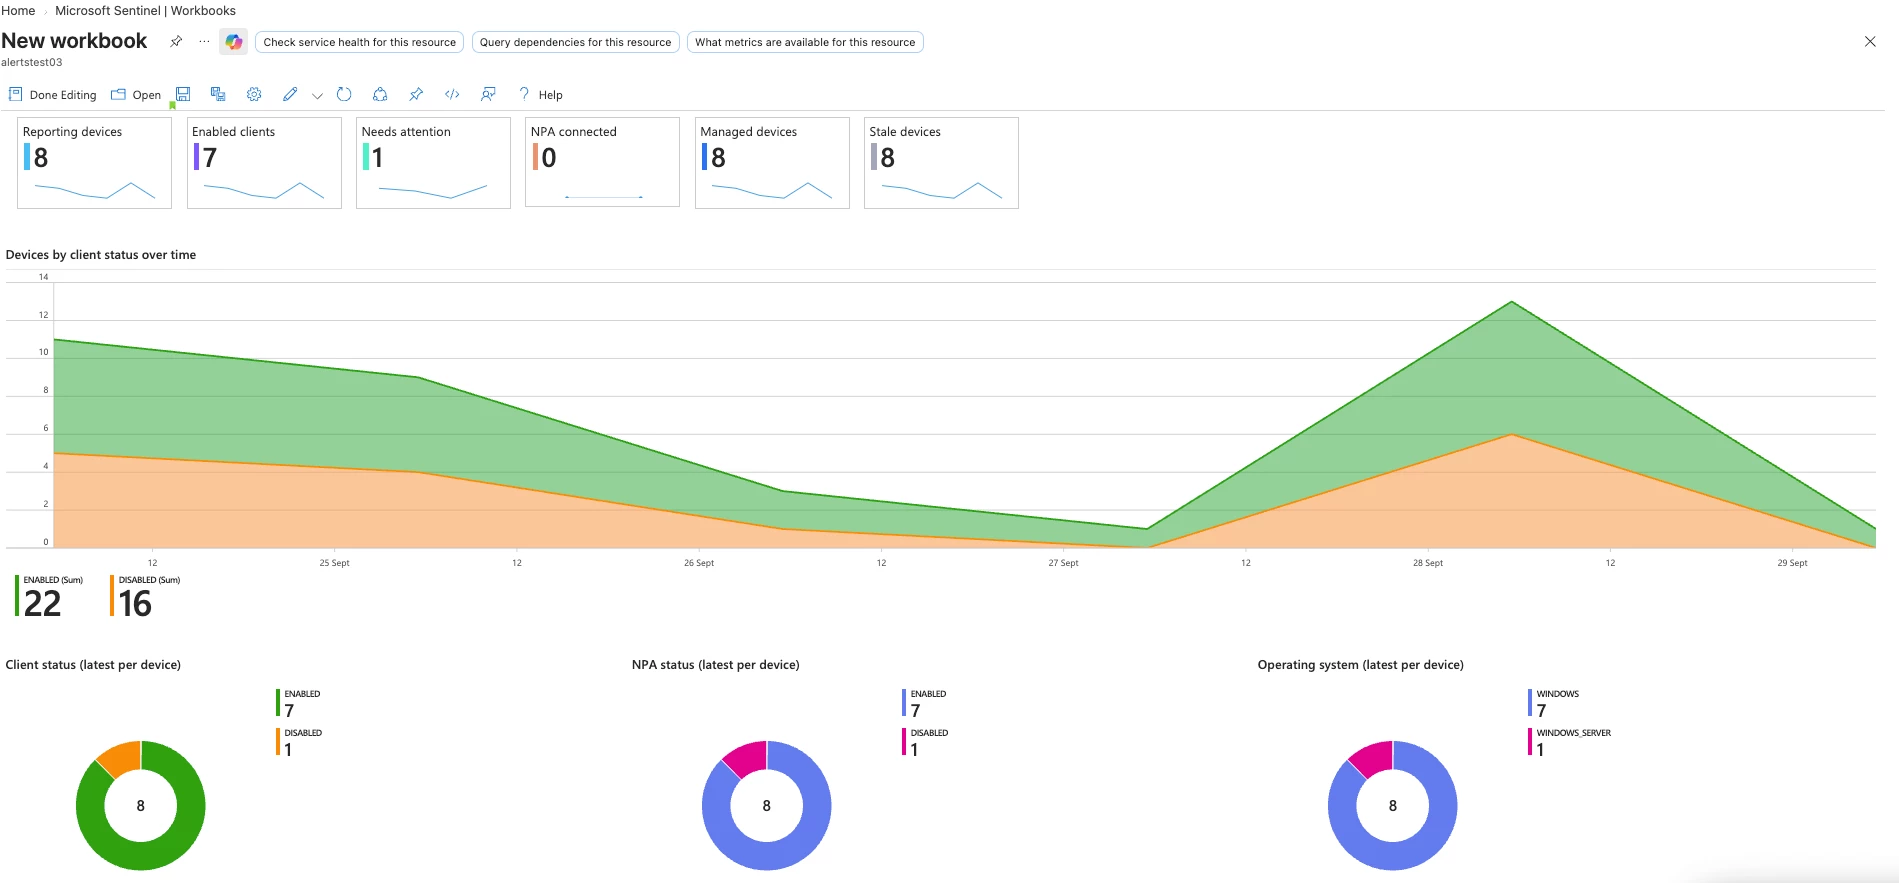
Overview
Summary tiles for Reporting devices, Enabled clients, Needs attention, NPA connected, Managed devices and Stale devices, each with a trend sparkline. Below are Devices by client status over time and the latest-per-device breakdowns for client status, NPA status and operating system.
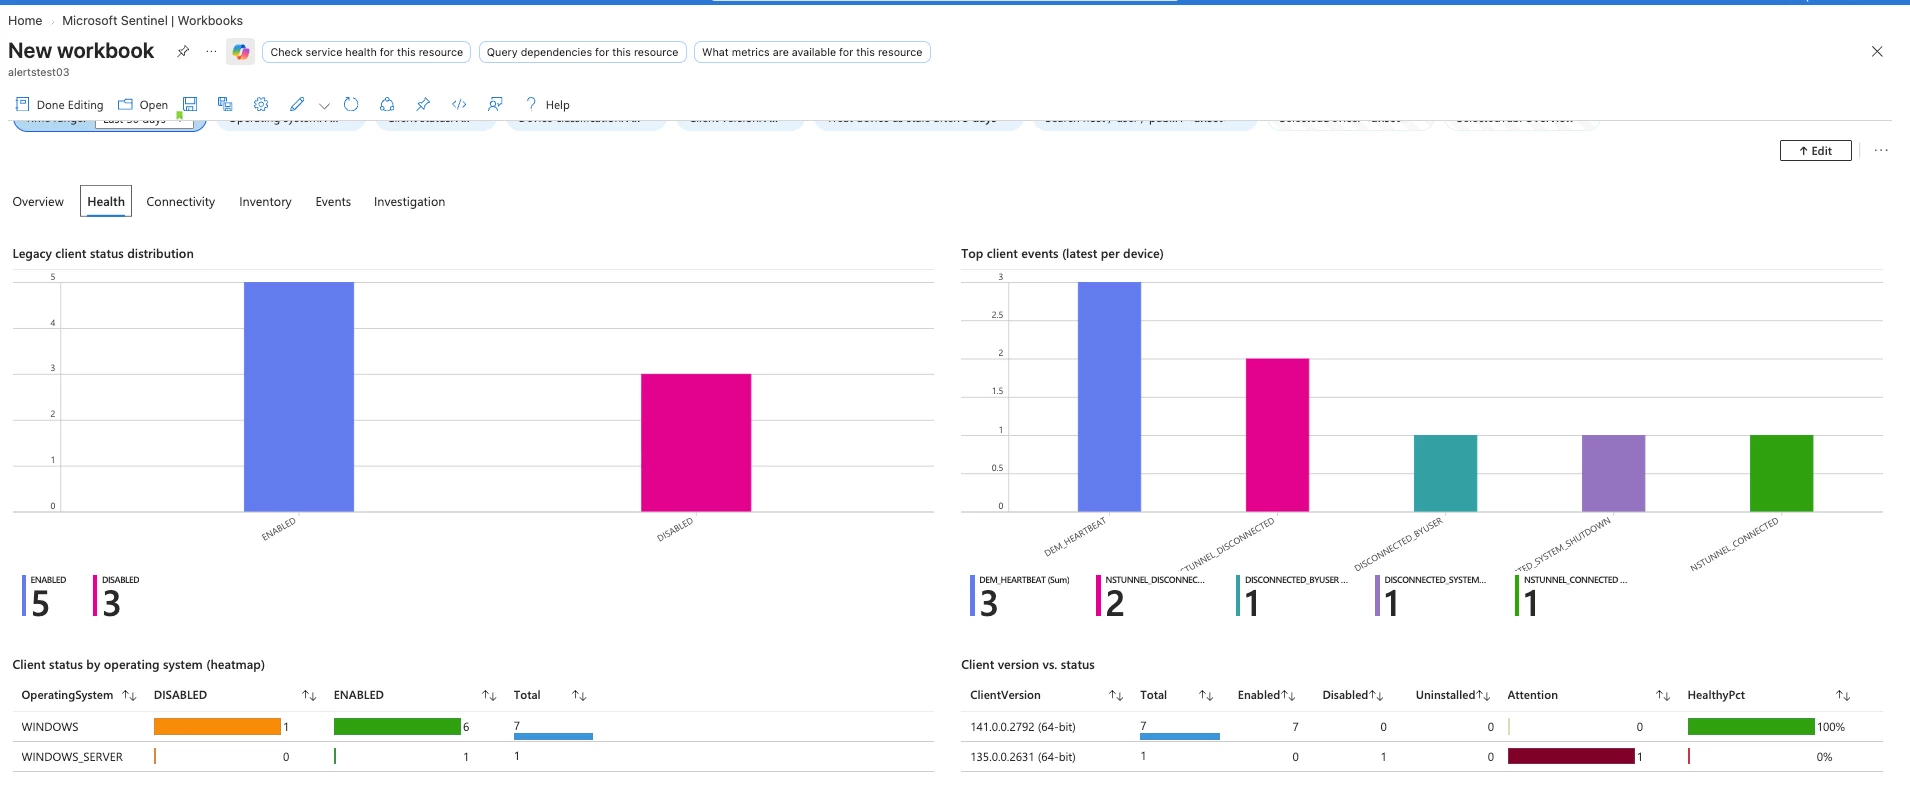
Health
- Legacy client status distribution: enabled vs. disabled clients.
- Top client events (latest per device): for example
DEM_HEARTBEAT,NSTUNNEL_DISCONNECTED,DISCONNECTED_BYUSER,DISCONNECTED_SYSTEM_SHUTDOWN,NSTUNNEL_CONNECTED. - Client status by operating system heatmap.
- Client version vs. status: total, enabled, disabled, uninstalled, attention and a HealthyPct per client version, so you can spot versions that need upgrading.
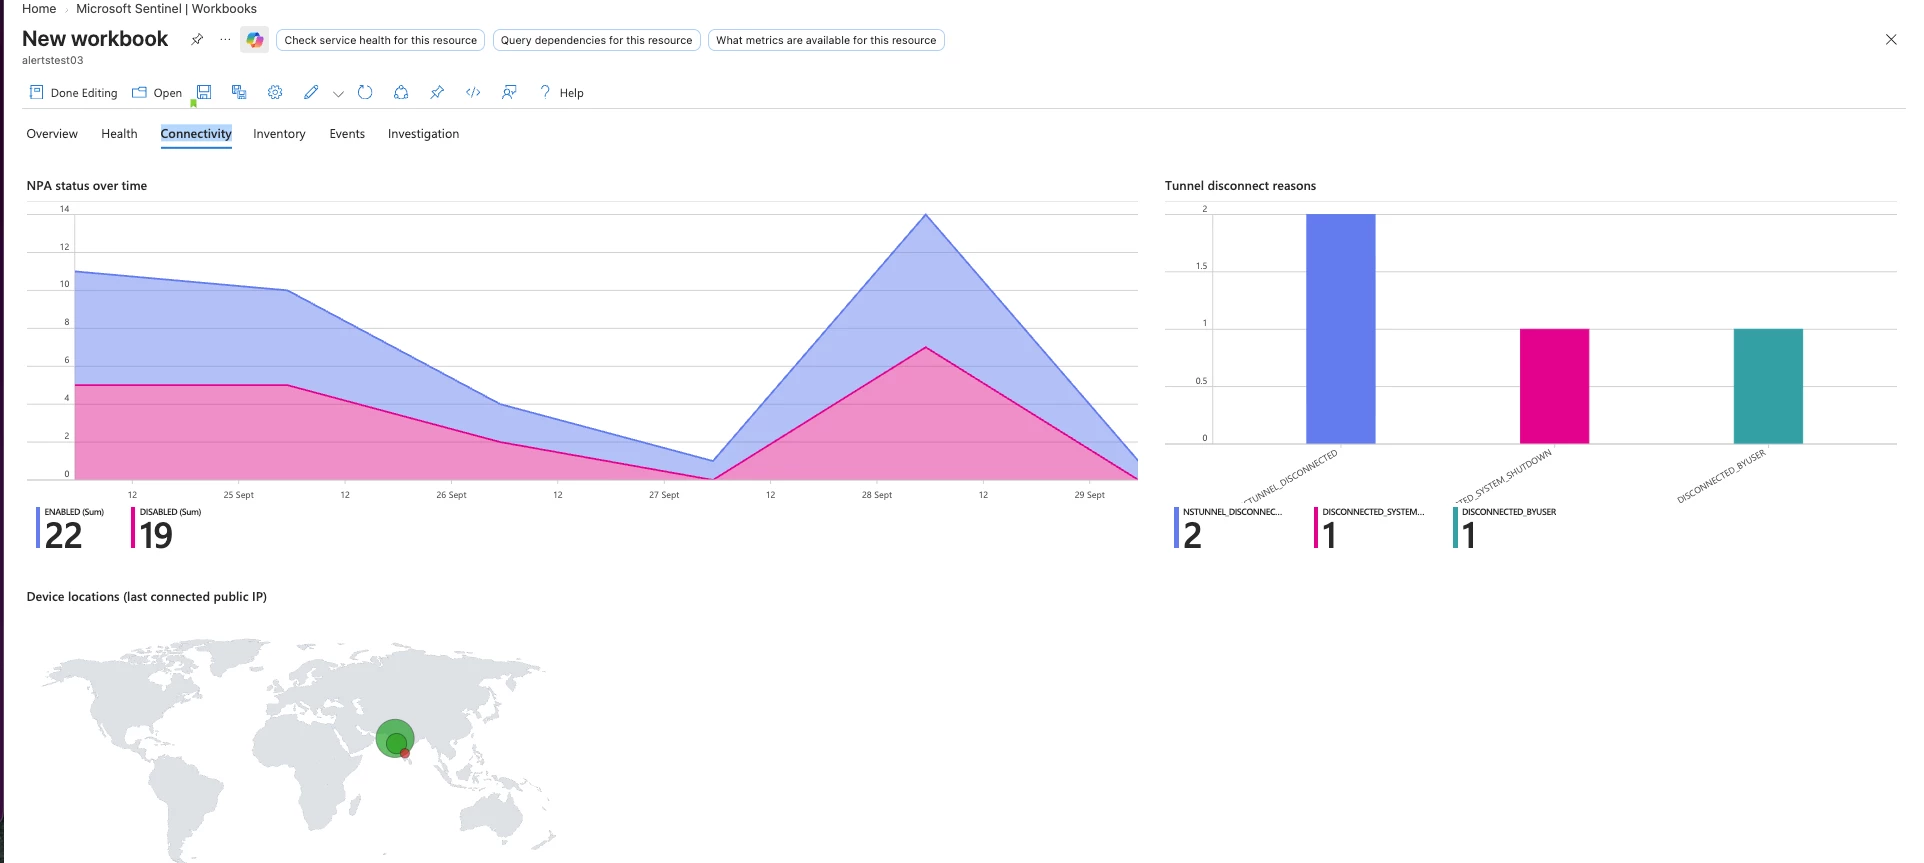
Connectivity
- NPA status over time
- Tunnel disconnect reasons
- Device locations map, based on the last connected public IP
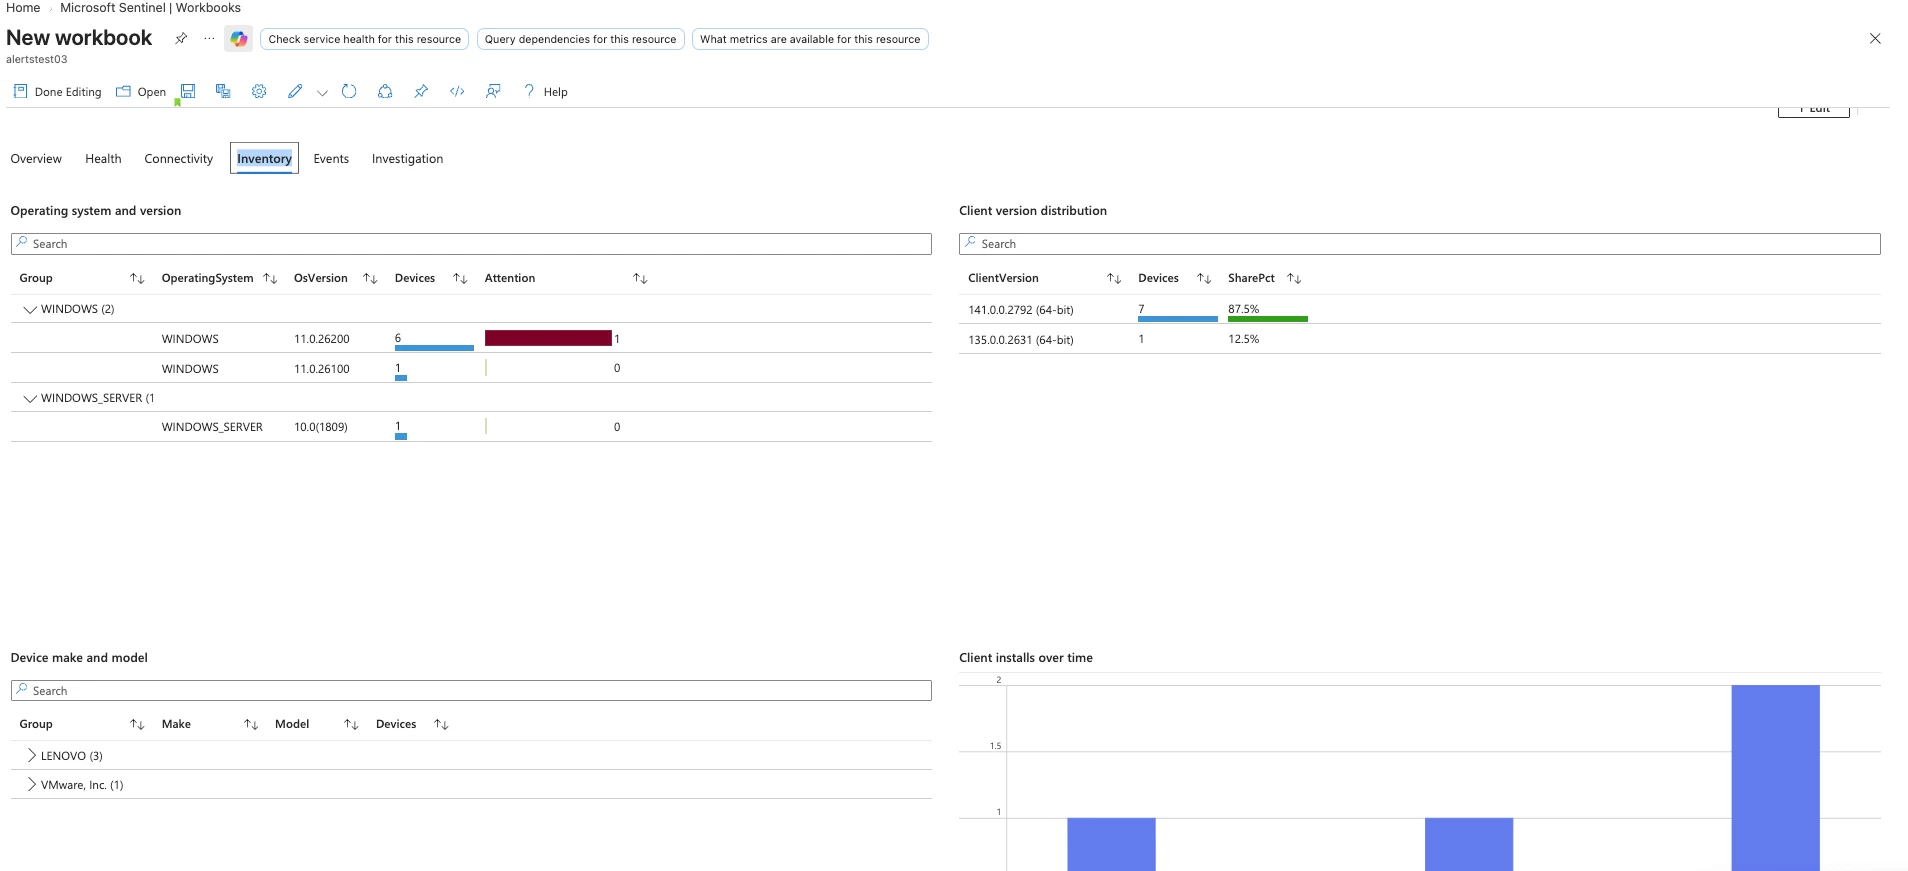
Inventory
- Operating system and version, with an attention indicator
- Client version distribution (devices and share %)
- Device make and model
- Client installs over time
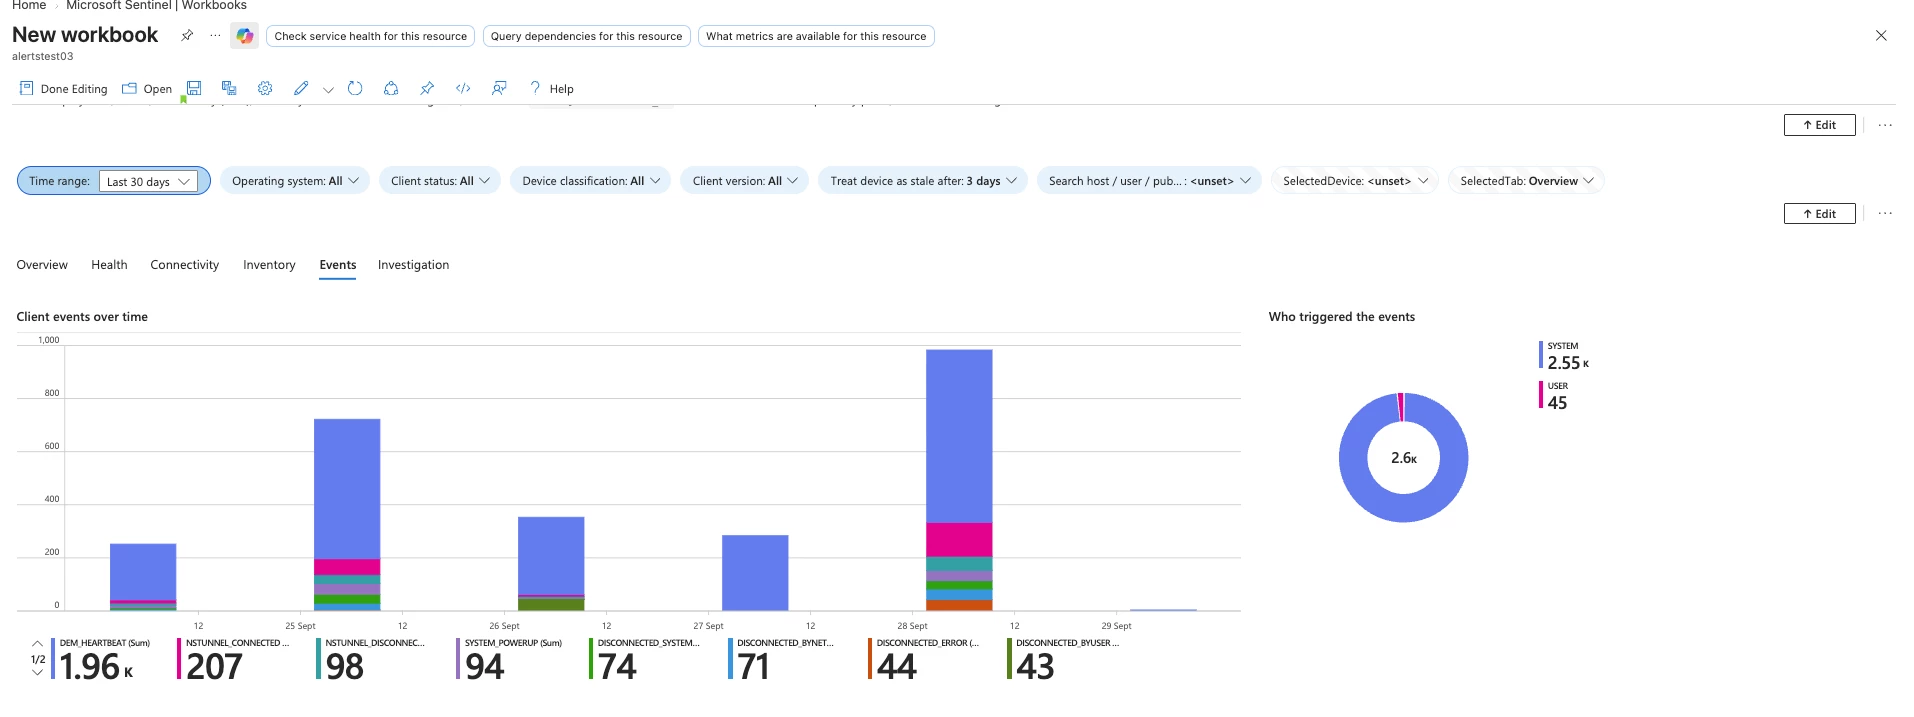
Events
- Client events over time by event type
- Who triggered the events: system vs. user
Investigation
Use the search box and SelectedDevice to drill into a single device.
Analytics rules
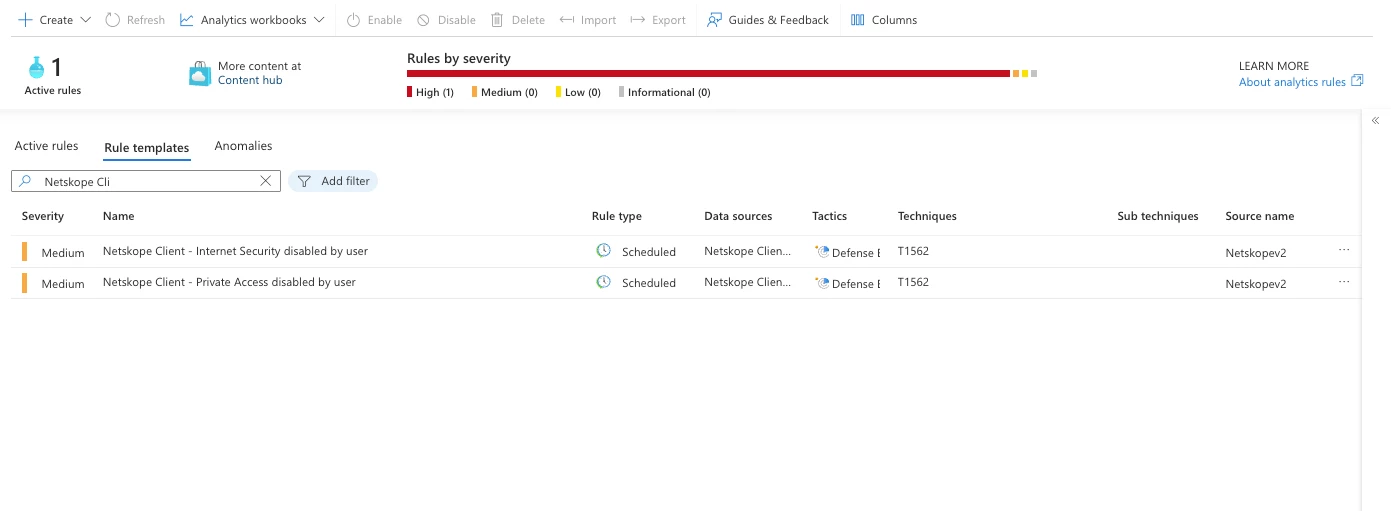
The solution includes two scheduled analytics rule templates, both Medium severity, mapped to MITRE ATT&CK Defense Evasion, technique T1562 (Impair Defenses). Both use the NetskopeClientStatus_CL table as their data source.
| Rule | Severity | Tactic | Technique |
|---|---|---|---|
| Netskope Client - Internet Security disabled by user | Medium | Defense Evasion | T1562 |
| Netskope Client - Private Access disabled by user | Medium | Defense Evasion | T1562 |
- Internet Security disabled by user: detects when a user turns off Netskope Internet Security on their client, so web and cloud traffic is no longer steered through Netskope for inspection.
- Private Access disabled by user: detects when a user turns off Netskope Private Access (NPA), cutting off secure access to private applications through Netskope.
To enable them, go to Analytics > Rule templates, search for Netskope Client, select a rule and click Create rule. You can then tune the schedule, thresholds, entity mapping and incident settings, and attach automation (playbooks) as needed.
Summary
With the Netskope Client Status connector you can:
- Ingest Netskope Client status into
NetskopeClientStatus_CLwith a least-privilege API role (NS Client > Devices > Manage). - Monitor fleet health, connectivity, inventory and client events with the included workbook.
- Get alerted when users disable Internet Security or Private Access.
Try it out and share your feedback in the comments.
References
- Netskope REST API v2 documentation (Data Export iterator endpoints): https://docs.netskope.com/en/using-the-rest-api-v2-dataexport-iterator-endpoints#using-the-client-status-iterator-api
- Creating an API token / RBAC role: https://docs.netskope.com/en/roles-rbac-v3