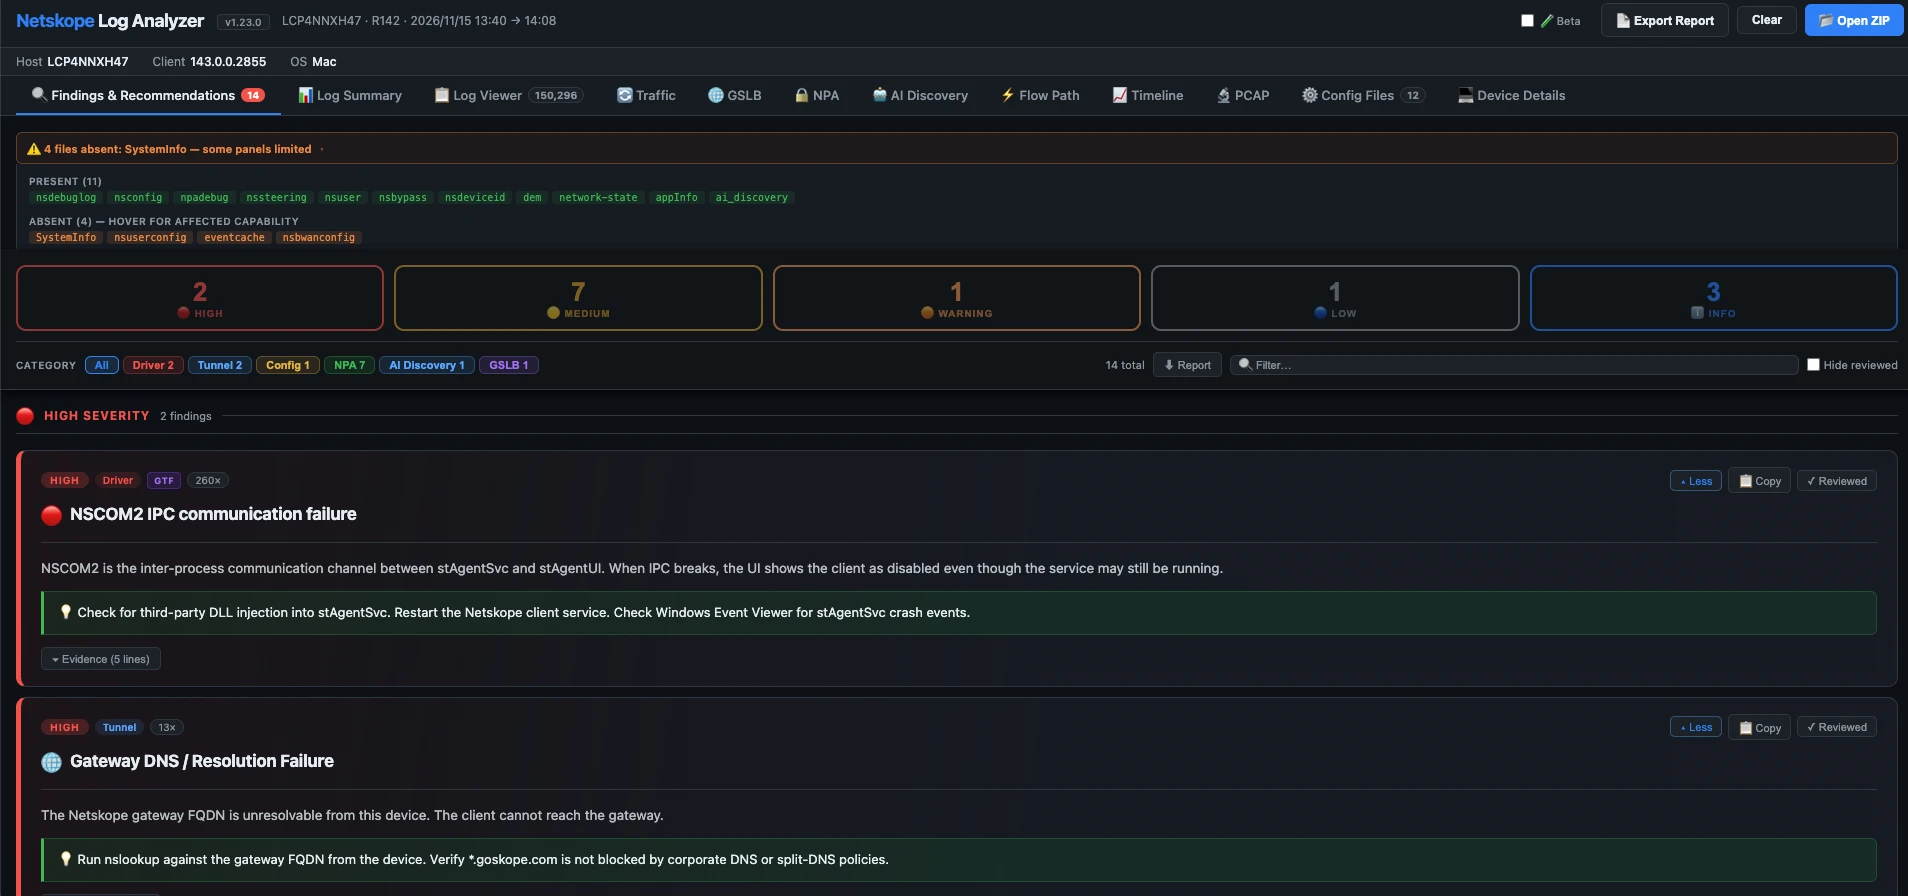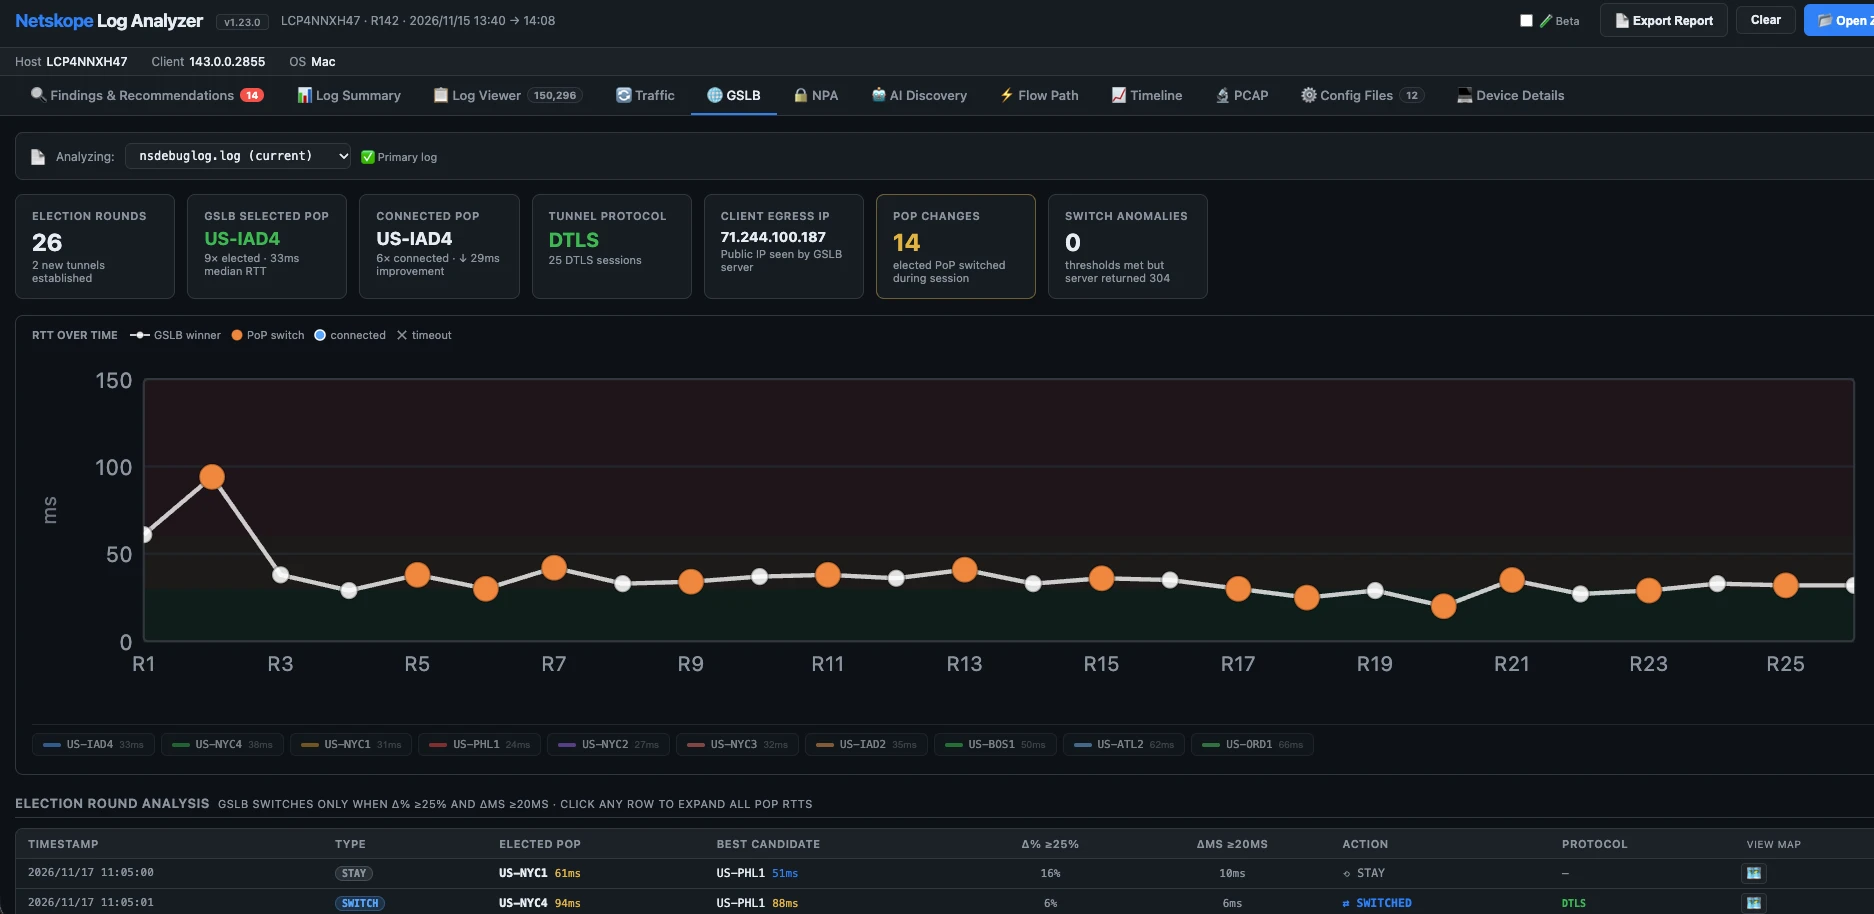


We’ve released the Netskope Client Log Analyzer as an open-source tool on GitHub, so you can troubleshoot Netskope Client issues faster without sending logs anywhere.
Get it here: https://github.com/netskopeoss/netskope_client_local_log_analyzer
What it is
The Log Analyzer is a single HTML file that parses a Netskope Client diagnostic ZIP entirely in your browser. There’s nothing to install and no server or internet connection needed. Parsing happens locally, so your log data never leaves your device.
Getting started
- Collect the diagnostic logs from the Netskope Client (Windows or macOS).
- Open the HTML file in Chrome (recommended) or any modern browser.
- Upload the ZIP. The Findings & Recommendations tab opens first, with issue cards ranked by severity.
Each finding includes a description, the supporting log lines, and a recommended next step. In many cases it points to the root cause within a minute.
What it detects
The built-in library has 100+ detection rules covering:
- Steering tunnel and gateway connectivity (firewall blocks, DTLS fallback, fail-close, SSL inspection conflicts)
- Netskope Private Access (publisher and broker reachability, enrollment, pre-logon)
- GSLB and data plane selection
- Endpoint DLP (policy load, service health, bypass state, USB and printer controls)
- SD-WAN (tunnel state, authentication, enrollment, steering)
- Client configuration and interoperability with VPN and other security software
More than findings
- Log Viewer: full-text and regex search, level filters, and timezone switching
- Traffic, GSLB, and Flow Path: what was tunneled vs. bypassed, and per-PoP latency
- Timeline: drag-to-zoom activity view with click-through to the logs
- Config Files and System Info: parsed device, steering, and enrollment details
- AI Discovery (R141+): detected AI agents, MCP servers, extensions, and local LLM servers, with risk badges
- Report export: a self-contained HTML report to attach to a support case
Good to know
- It needs the full diagnostic ZIP. Individual log files aren’t supported yet.
- It analyzes only what’s in the bundle, so it can’t see tenant-side state such as policy, publisher health, or directory sync.
- Novel failures may not produce a finding. Use the Log Viewer for those.
Feedback
We’d like to hear which failure patterns you’d like added and what would make this more useful. Reply below or share it on the GitHub repo.