Netskope API logs with CrowdStrike NG-SIEM
This guide walks through ingesting Netskope Events and Alerts logs into CrowdStrike NG-SIEM using the Netskope Security Service Edge Data Connector and the Netskope API v2 Data Export endpoint.
Prerequisites
- Admin access to both Netskope and CrowdStrike tenants
- Netskope API v2 Data Export endpoint URL for your tenant (typically https://<tenant-name>.goskope.com)
Netskope API token
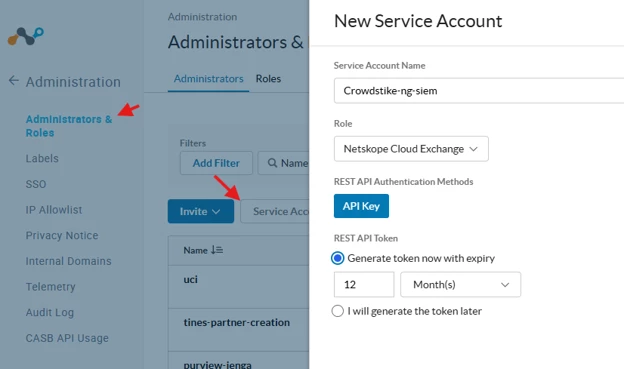
1. Log into your Netskope tenant as an administrator.
2. Navigate to Settings > Administration >Administrators & Roles.
3. Create a new service account with the role Netskope Cloud Exchange or equivalent. This account must have read permissions for Events and Alerts logs.
4. Generate an API token for this service account. Copy and store this securely—you will need it in the next section.
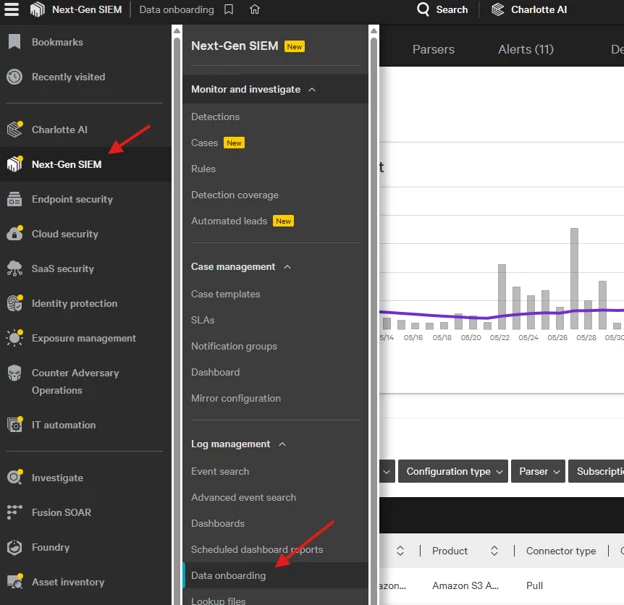
CrowdStrike Data Onboarding
Go to your CrowdStrike tenant > NG-SIEM > Data onboarding.
Add connection
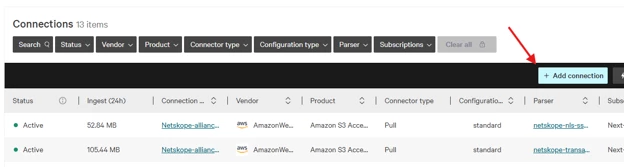
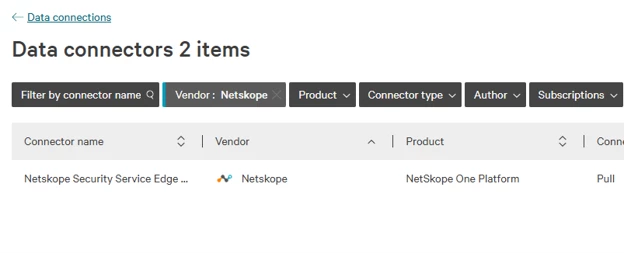
Filter Vendor to Netskope and select the Netskope Security Service Edge Data Connector
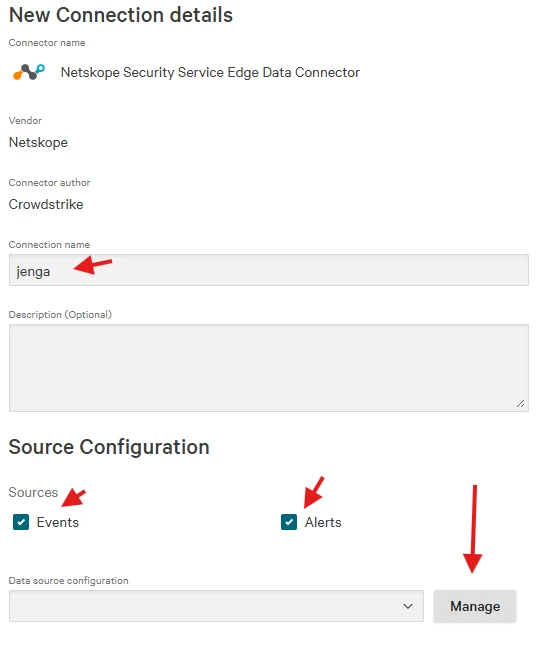
Give the connection a name and select the sources you want. I am going to grab both Events and Alerts. For data source, I need to add my tenant so I am going to select Manage then Add configuration.
Understanding the Data
Events Log
The Events log captures application and network activity from the Netskope tenant. Fields include: timestamp, user identity, source and destination IP, application, action, traffic classification, bytes transmitted, and policy violations. Refer to Netskope Events log schema documentation for the complete field reference.
Alerts Log
The Alerts log contains security alerts triggered by DLP policies, malware detection, suspicious behavior, or policy violations. Each alert record includes: alert timestamp, severity level, alert type, affected user and data, remediation action taken, and associated policy or detection rule. The Alerts log provides higher-level security signals compared to the granular transaction data in Events.
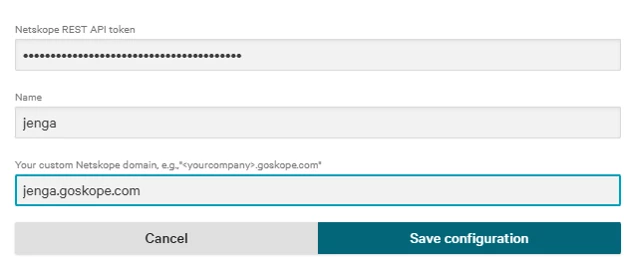
Add your Netskope API token, give it a name, and add your tenant url.
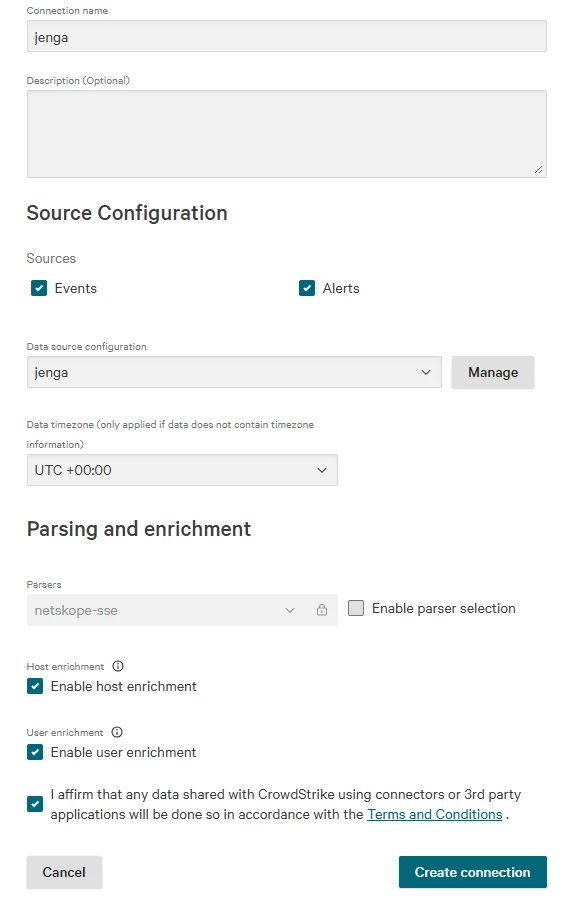
Select the tenant you just added and Create. You will see that I left the parser as netskope-sse. This is the correct one for this.
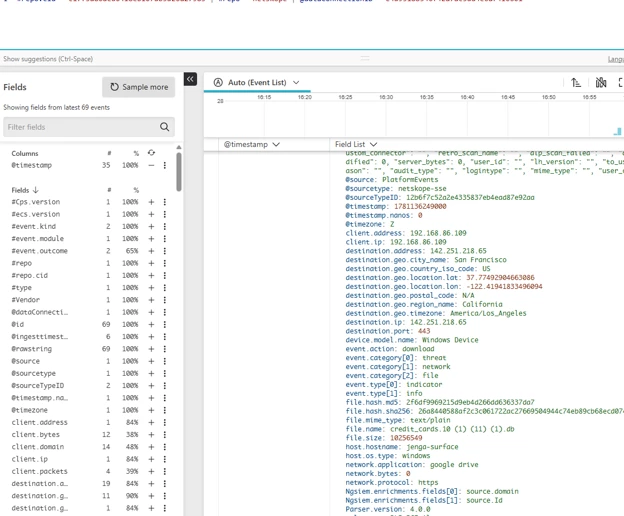
Verification and Troubleshooting
After a few minutes it will go active and you will see the ingest number increase.

In NG-SIEM, navigate to your data connector. Select the three-dot menu (···) > Show Events. You should see ingest numbers increasing and individual Events and Alerts appearing within minutes of being generated in Netskope.