
|
Building a CrowdStrike Falcon Dashboard on Netskope Data: a Step-by-step GuideHow my team streamed Netskope web, DLP, and alert telemetry into CrowdStrike Falcon Next-Gen SIEM, wired up automated indicator sharing, and built a cross-source security dashboard that correlates Netskope, Falcon, and Okta signals in one place. Everything below is enough to build the same thing in your own tenant.
Why we built thisMy security operations team lives in CrowdStrike Falcon. That is where analysts triage, hunt, and respond. But a lot of the signal they need sits in Netskope: web transaction logs, DLP violations, anomaly alerts, and policy actions from the Netskope One Security Service Edge (SSE) platform. Every time an analyst had to pivot out of Falcon to check the Netskope Admin Console, we lost time and context. Our solution had two parts. First, stream Netskope logs into Falcon LogScale so analysts get a native Netskope dashboard inside Next-Gen SIEM, sitting next to their endpoint detections. Second, automate indicator of compromise (IoC) sharing so a threat found by our email security vendor automatically becomes a blocklist entry in Falcon. This post walks through both, with the exact configuration, parser, and LogScale queries we used, so you can reproduce it in your own environment. The architectureWe run two independent, parallel flows. Neither depends on the other, so you can build them in either order or just build the one you need.
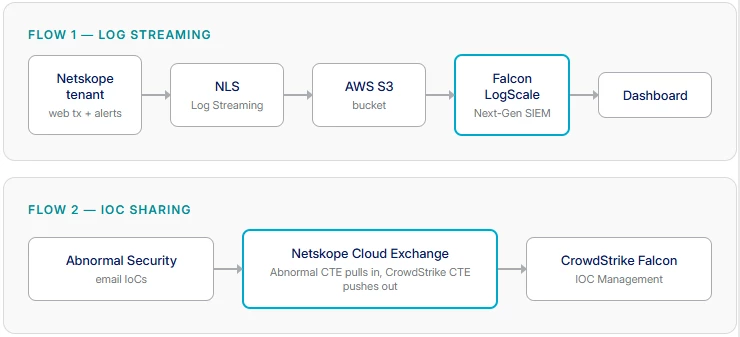
Both flows land in the same CrowdStrike tenant, which is what eventually let us build panels that correlate across sources. More on that later. 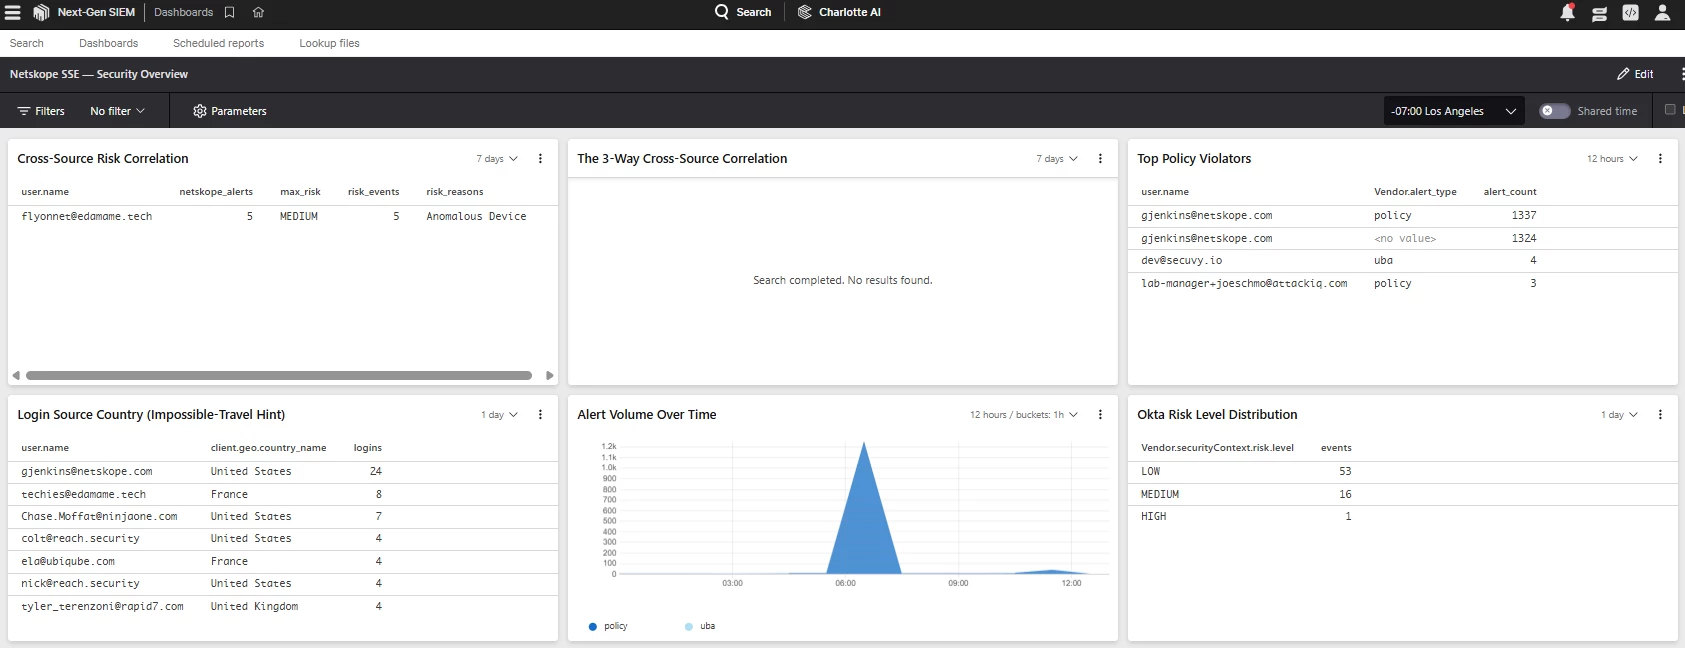 The finished dashboard, live in Falcon Next-Gen SIEM: Netskope panels sitting directly alongside Falcon detection data. Before you start: prerequisitesConfirm every one of these before touching a config screen. Missing a license midway through is the most common reason this project stalls. Netskope
AWS
CrowdStrike
Abnormal Security
Part 1: streaming Netskope logs into FalconWe chose NLS over syslog or the REST API. NLS writes structured JSON or CEF directly to a cloud bucket on a schedule, which is a much more reliable pattern for high-volume web transaction logs than polling an API or running a syslog relay. 1. Configure Netskope Log StreamingIn the Netskope Admin Console:
Give it 10 to 15 minutes, then check the S3 bucket directly for new objects before moving to Falcon. Confirming delivery here saves a lot of guessing later if the pipeline looks empty. 2. Point Falcon LogScale at the bucketIn Falcon:
3. Import the Netskope parserRaw Netskope JSON and CSV events need a parser to become queryable fields. We built one (netskope-sse, parser version 4.0.0) that auto-detects the incoming format, normalizes fields to a consistent schema, and tags every event with #type = "netskope-nls-sse-v1". Import it under Next-Gen SIEM > Parsers and bind it to the S3 connector you just created. The detection logic at the top of the parser looks like this: From there the parser normalizes vendor-specific fields into a consistent event schema: destination.address, source.geo.country_iso_code, event.outcome, threat.technique.id and more, including a MITRE ATT&CK lookup for file and malsite events. Everything specific to Netskope (DLP rule, alert type, app category, policy name) stays under the Vendor.* namespace so it never collides with fields from other log sources in the same repository. 4. Confirm your field mappingThese are the fields we ended up building every panel on, confirmed against live event data. Save yourself the trial and error and start here.
A tip that saved us real debugging time: filter alerts with the raw Vendor.alert = "yes" field, not the derived event.kind field. The raw field is more reliable across the full range of Netskope alert types. Part 2: automating IoC sharing through Cloud ExchangeNetskope Cloud Exchange (CE) is the integration layer that turns point products into a threat sharing loop. We use two of its plugins together: Abnormal Security's Cyber Threat Exchange (CTE) plugin to pull email-borne indicators in, and the CrowdStrike CTE plugin to push them out to Falcon.
Once this is running, an indicator Abnormal flags in a phishing email becomes a block condition in Falcon automatically, with no analyst copying hashes between consoles. Building the dashboardWe started with eight panels covering the fundamentals: what is getting blocked, who is triggering alerts, and where data is going. Every query below runs against the netskope-nls-sse-v1 event type and is ready to paste into a new LogScale dashboard panel. Top Blocked Destinations — bar chart #type = "netskope-nls-sse-v1"| Vendor.action = /(?i)^(block|deny|drop|quarantine)$/| destination.address = *| groupBy(destination.address, function=count(as=blocked_events))| sort(blocked_events, order=desc, limit=10) Alert Volume Over Time — time series #type = "netskope-nls-sse-v1"| Vendor.alert = "yes"| timechart(span=1h, Vendor.alert_type, function=count(), limit=10) Top Policy Violators — table #type = "netskope-nls-sse-v1"| Vendor.alert = "yes"| user.name = *| groupBy([user.name, Vendor.alert_type], function=count(as=alert_count))| sort(alert_count, order=desc, limit=20) DLP Alert Breakdown by Profile & Rule — donut chart #type = "netskope-nls-sse-v1"| Vendor.alert_type = "DLP"| Vendor.dlp_profile = *| groupBy([Vendor.dlp_profile, Vendor.dlp_rule], function=count(as=violations))| sort(violations, order=desc, limit=20) Web Traffic by Application — stacked time series #type = "netskope-nls-sse-v1"| network.application = *| timechart(span=1h, network.application, function=count(), limit=10) Blocked vs Allowed Ratio — donut #type = "netskope-nls-sse-v1"| Vendor.action = *| groupBy(Vendor.action, function=count(as=event_count))| sort(event_count, order=desc) Data Volume by User — bar chart #type = "netskope-nls-sse-v1"| user.name = *| network.bytes = *| groupBy(user.name, function=[ sum(network.bytes, as=total_bytes), count(as=event_count) ])| total_bytes := total_bytes / 1048576| rename(total_bytes, as="total_mb")| sort(total_mb, order=desc, limit=15) Source Geo Distribution — world map / table #type = "netskope-nls-sse-v1"| source.geo.country_iso_code = *| groupBy(source.geo.country_iso_code, function=count(as=event_count))| sort(event_count, order=desc, limit=50) Going further: correlating across sourcesThe eight panels above were the starting scope. Once Netskope events were landing in the same LogScale repository as our Falcon endpoint detections and Okta identity signals, an obvious next step opened up: correlate them. A host with rising Falcon detections and a spike in Netskope DLP alerts from the same user is a much stronger signal than either one alone. We added a second row of panels that joins across sources by hostname and username: a combined hostname view showing Falcon detections next to Netskope alert counts, a cross-source risk correlation table that rolls up Netskope alerts against Okta's risk scoring, and a three-way correlation panel. We also added an impossible-travel hint using Okta's login source country against known user geography, and an Okta risk level distribution panel. 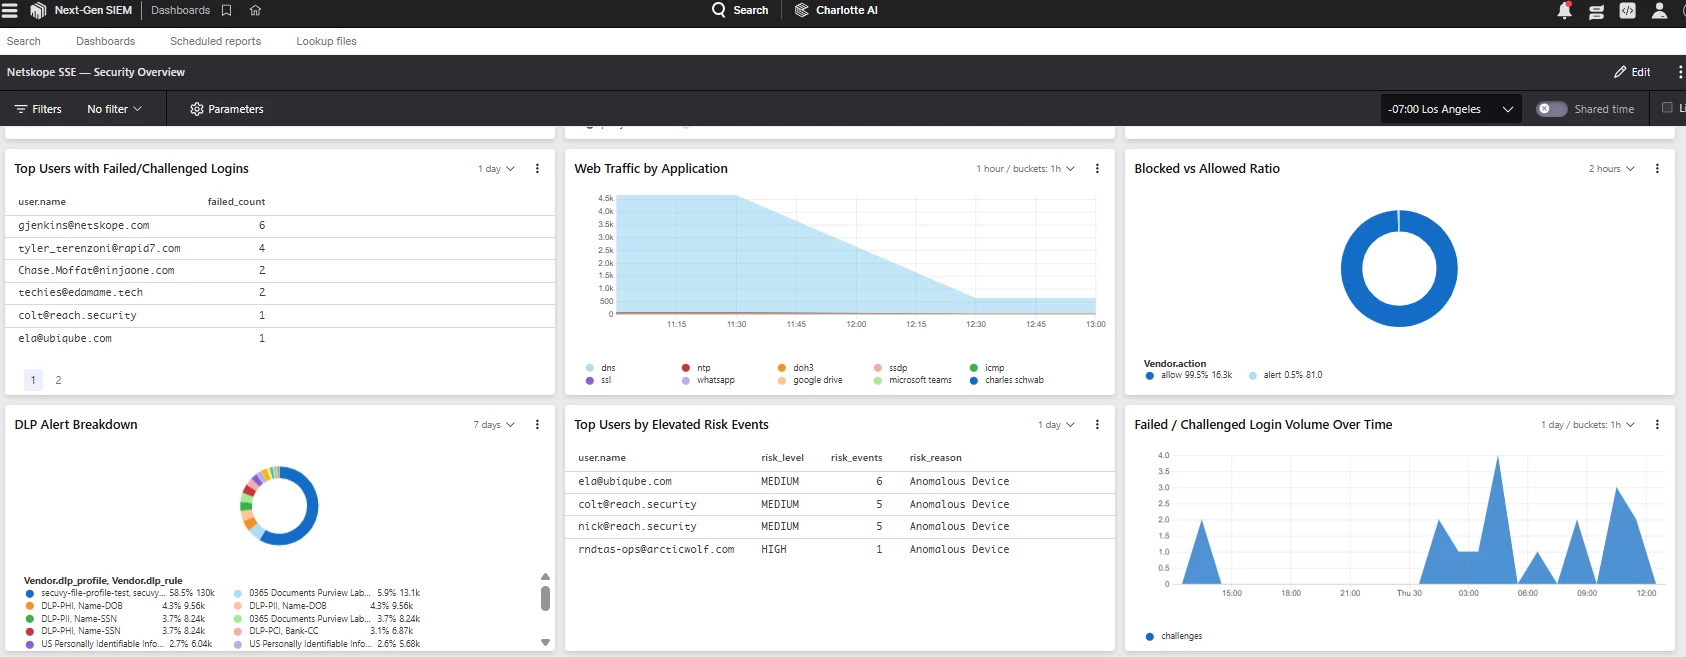 Cross-source correlation panels: Netskope alerts joined against Falcon detections and Okta risk data by user and host. 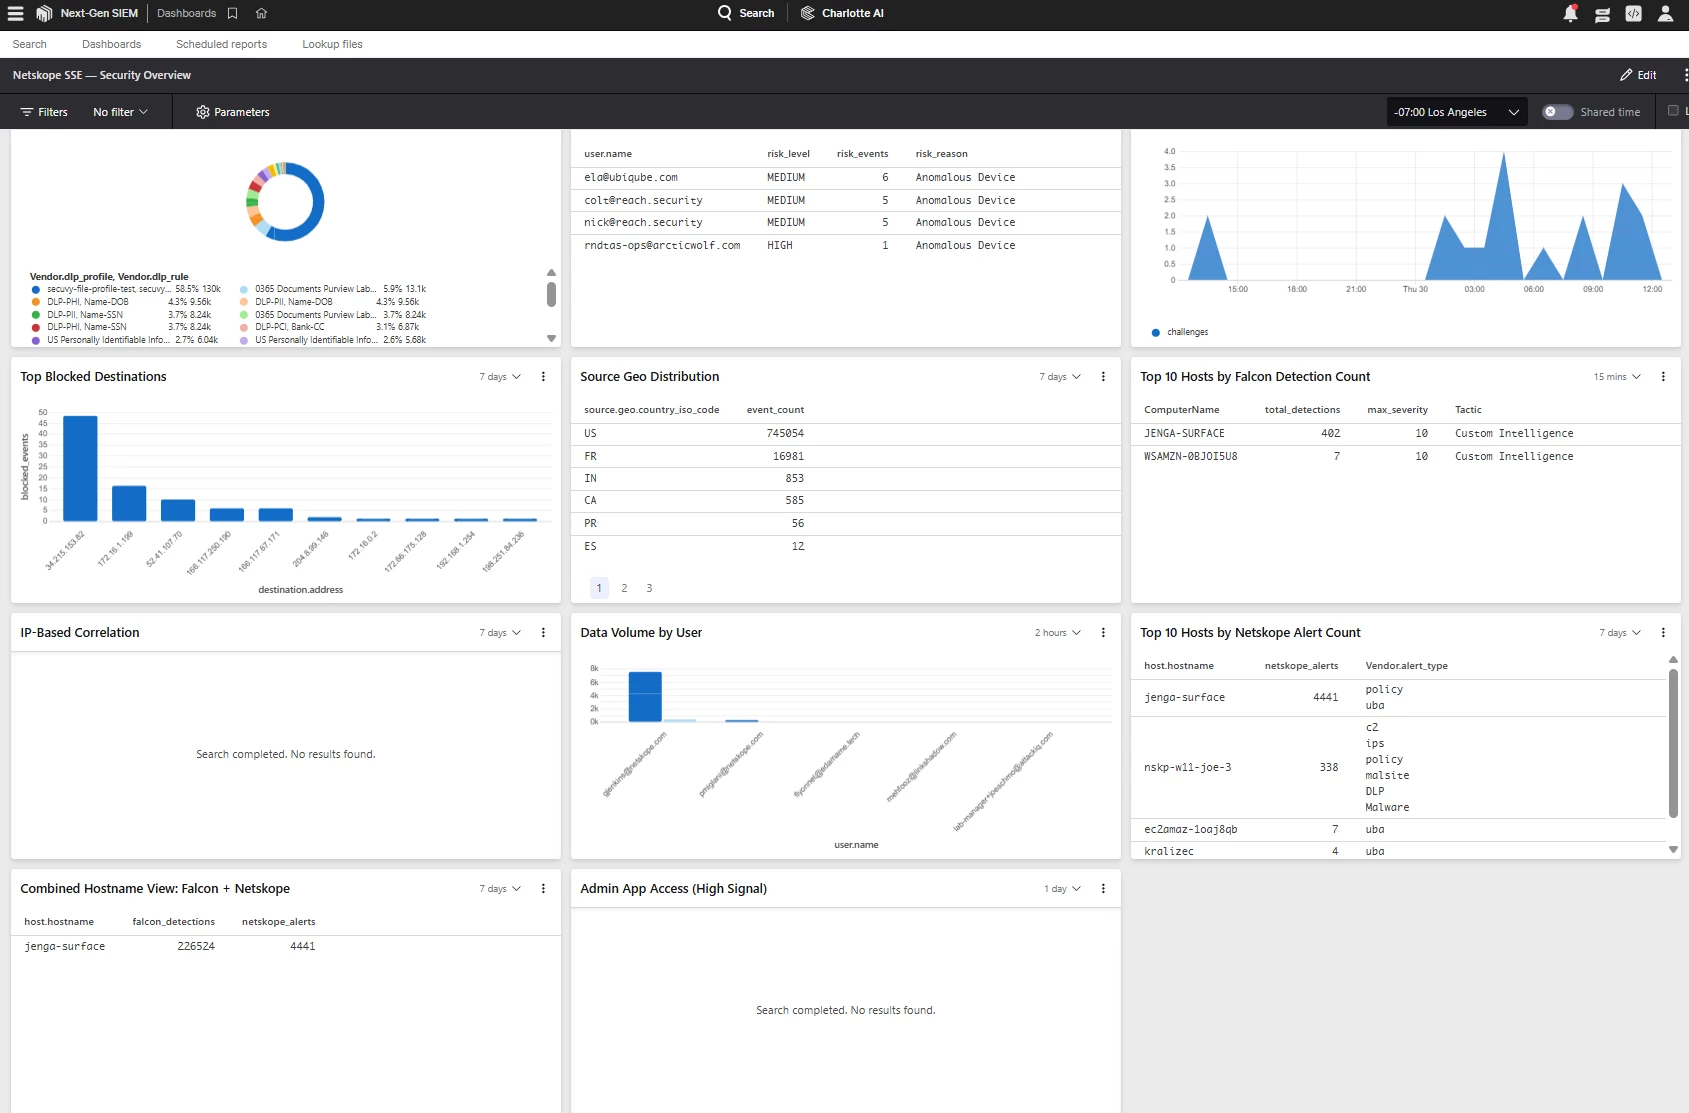 The remaining rows round out identity and DLP visibility: failed logins, elevated risk users, and blocked-versus-allowed traffic. None of this required new infrastructure. It is the same netskope-nls-sse-v1 data, joined in LogScale query language against whatever other sources already live in the repository. If you stream Okta or another identity provider's logs into the same LogScale repo, the correlation panels are just groupBy and join queries away. A realistic rollout timeline
Resources
If you build this in your own tenant and hit a field that does not map the way ours did, that is expected. Log formats change slightly across Netskope tenant versions. Start from the confirmed field table above, validate against a live sample in LogScale before wiring up a full panel, and you will save yourself most of the trial and error we went through.
| ||||||||||||||||||||||||||||

Building a CrowdStrike Falcon Dashboard on Netskope Data


 +15
+15



Sign up
Already have an account? Login
Sign in or register securely using Single Sign-On (SSO)
Employee Continue as Customer / Partner (Login or Create Account)Login to the community
Sign in or register securely using Single Sign-On (SSO)
Employee Continue as Customer / Partner (Login or Create Account)Enter your E-mail address. We'll send you an e-mail with instructions to reset your password.