




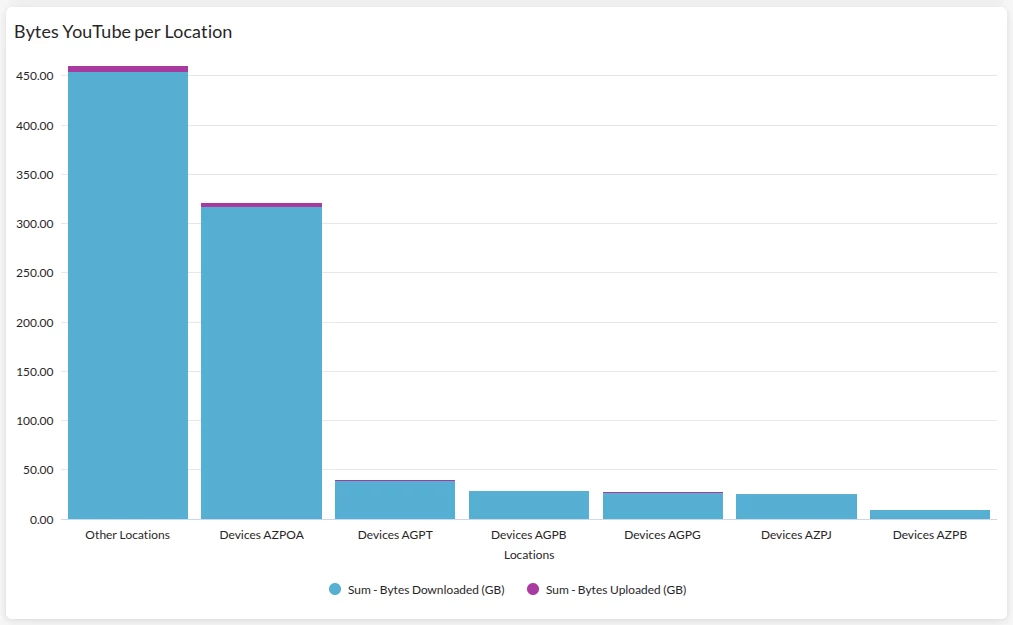
This post shares a Custom Field / widget I built in Advanced Analytics that groups devices by location based on a hostname naming convention, then maps YouTube Bytes Uploaded and Bytes Downloaded per location. It's a simple pattern that can be reused for any environment where hostnames follow a structured naming standard.
The use case
In our environment, device hostnames follow a consistent pattern:
[AZ|AG] + [Location Code] + [NB|DS] + [Number]
- AZ / AG — identifies the business unit / region the device belongs to
- Location code (e.g.
POA,PB,PJ,PG,PT) — identifies the site/location of the device - NB / DS — indicates whether the device is a notebook or a desktop
- Number — a sequential device identifier
Since the location code is embedded in every hostname, I wanted a way to aggregate traffic by location without having to build a filter or dimension for every single site individually. The goal was to answer a simple question: "Which locations are generating the most YouTube upload/download traffic?"
Building the Custom Field
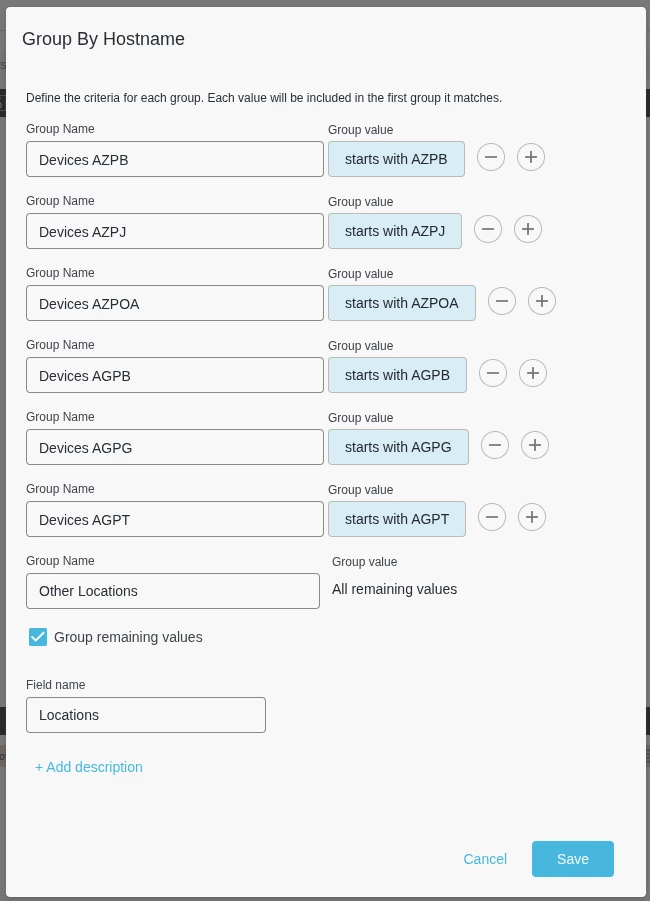
I created a Custom Dimension based on the Hostname field, using the "Group By" option to bucket every device into its corresponding location group with a "starts with" condition:
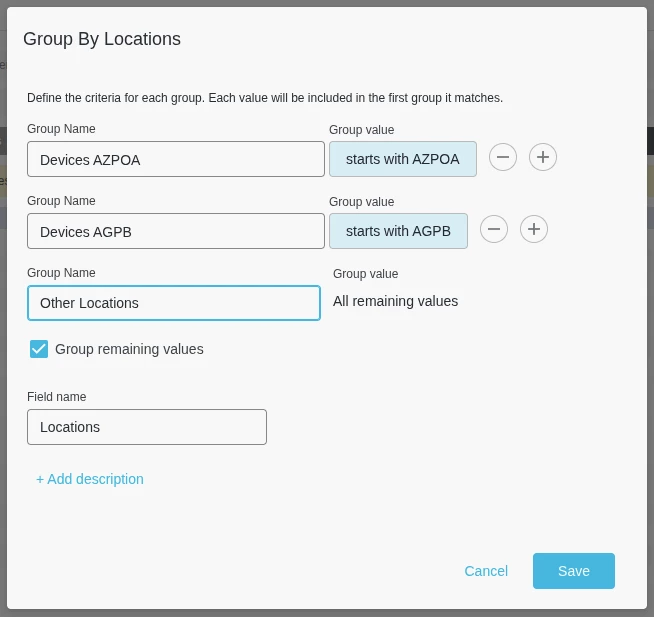
Devices AZPB→ starts withAZPBDevices AZPJ→ starts withAZPJand so on...Other Locations→ Group remaining values (checked), catching everything that doesn't match one of the defined prefixes
A couple of things worth noting for anyone replicating this:
- Values that can be contained in others: Remember that devices that start with ‘AZPJA’ will be contained in the ‘AZPJ’ group since this is a broader one. If you have such case, you will have to adapt the widget to separate those groups properly (maybe add NB/DS as well).
- "Group remaining values" is what makes this scalable — you don't need to enumerate every possible location up front. Anything that doesn't match your defined prefixes automatically falls into a catch-all bucket (I named mine "Other Locations"), so the field stays complete even as new hostnames are added.
- I named the resulting field "Locations" so it could be reused across any widget, not just this one.
(if you wish) Here's how to recreate the setup, step by step:
Step-by-step
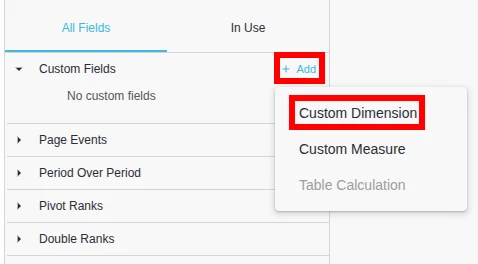
- Create a Custom Dimension
Under All Fields → Custom Fields, click + Add and select Custom Dimension.
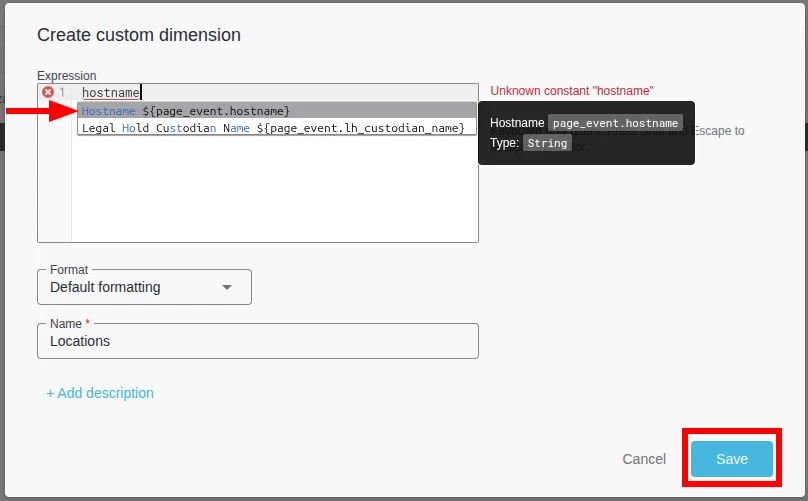
- Reference the Hostname field
In the expression editor, start typing hostname and select the suggested field (${page_event.hostname}). Give the dimension a name — I used "Locations" — and click Save.
- Open the Group option
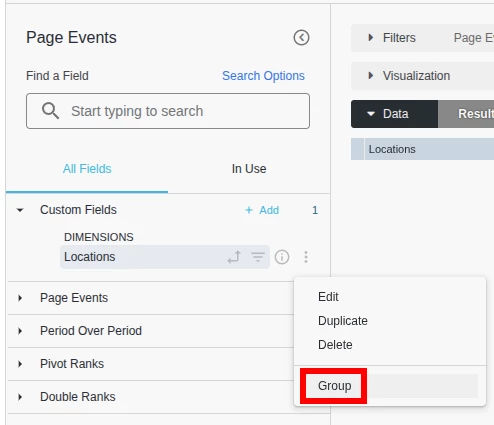
With the new "Locations" dimension added to the field list, click the ⋮ menu next to it and select Group.
- Define the group rules
In the "Group By Locations" dialog, add one rule per site using "starts with" (e.g., Devices AZPOA → starts with AZPOA, Devices AGPB → starts with AGPB, etc.). Check "Group remaining values" and name the catch-all group (e.g., "Other Locations").
Save.
- Confirm the grouping
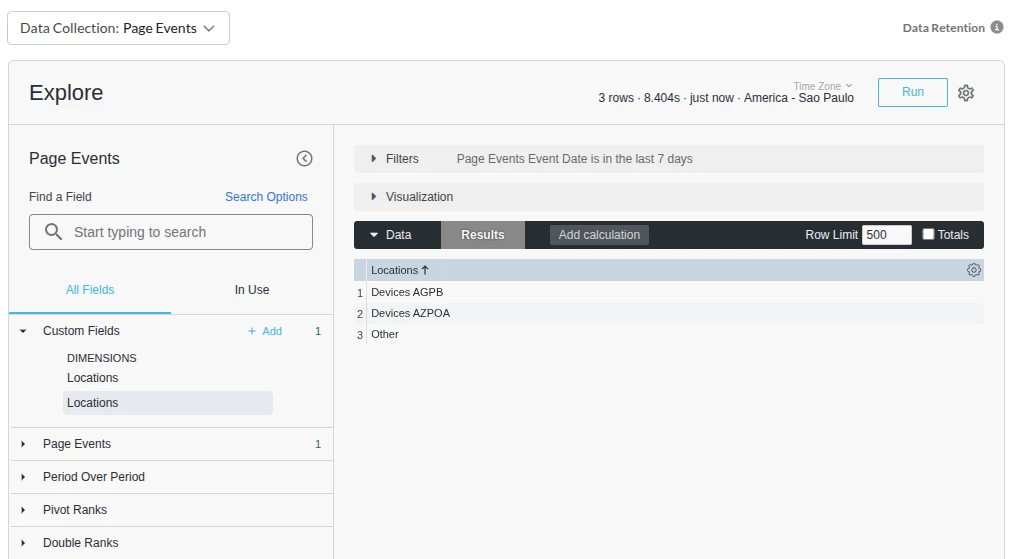
Run the field on its own (no measures) to sanity-check the output — each row should show one of your defined group names instead of raw hostnames.
- Build the widget
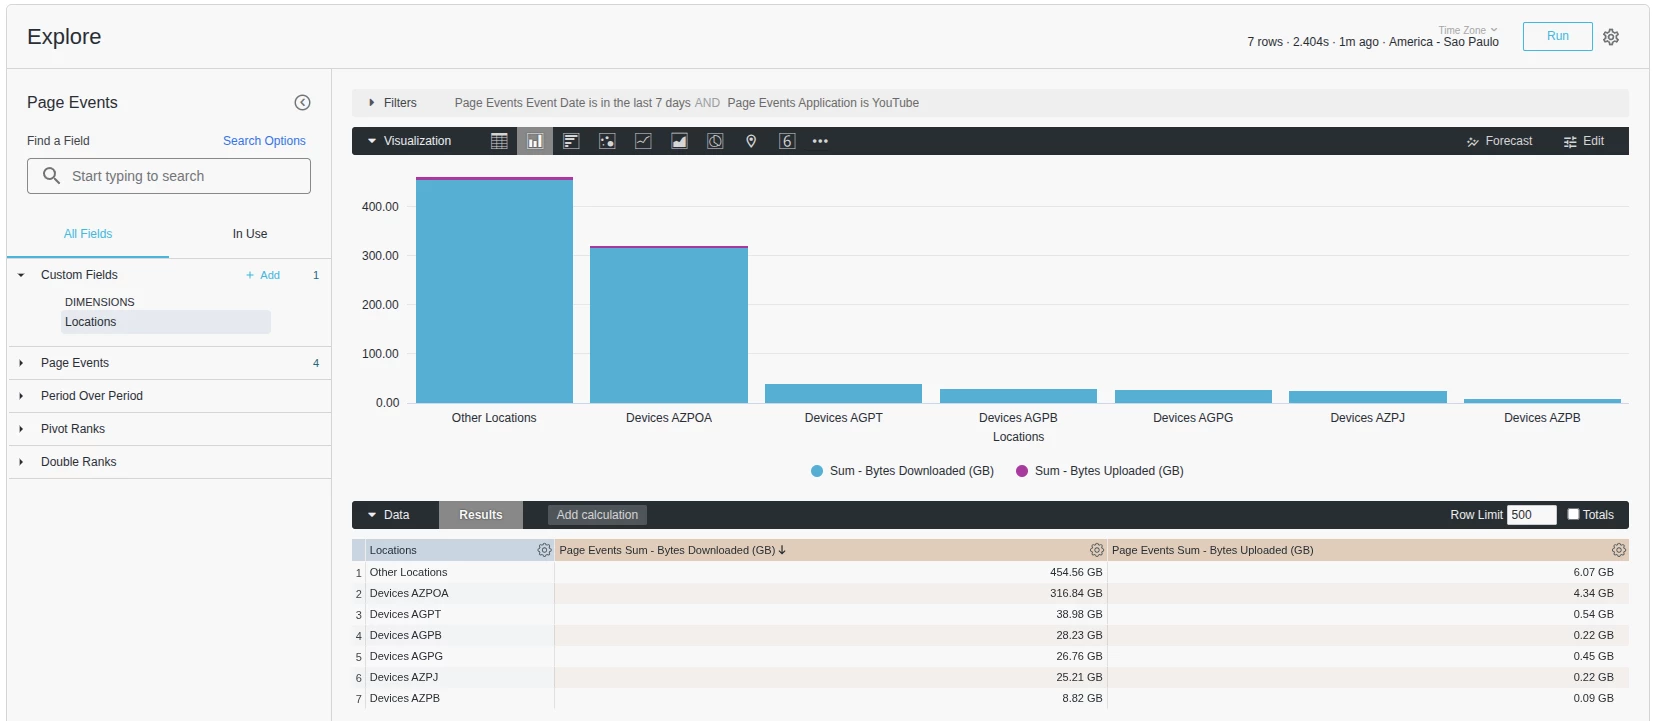
Add the "Locations" dimension, the measures Sum – Bytes Downloaded (GB) and Sum – Bytes Uploaded (GB), filter Application = YouTube, and switch the visualization to a bar chart.
The resulting widget
With the Custom Field in place, building the widget was straightforward:
- Dimension: the new "Locations" custom field
- Measures: Sum – Bytes Downloaded (GB) and Sum – Bytes Uploaded (GB)
- Filter: App = YouTube
- Visualization: stacked/grouped bar chart
The result is a single bar chart showing YouTube data consumption broken down by location, sorted from highest to lowest — instantly highlighting which sites are driving the most bandwidth usage, instead of having to scroll through hundreds of individual hostnames.
Why this approach is useful
- No need to create one filter/dimension per site — a single Custom Field handles it all
- Easy to maintain: adding a new site just means adding one more "starts with" rule
- The same "Locations" field can be reused across other widgets/dashboards (e.g., total bandwidth by location, top apps by location, threat activity by location)
- Works well for any org where device naming follows a structured convention, not just YouTube-specific use cases
Hope this helps others who have a structured hostname naming convention and want to aggregate traffic by site/location without heavy manual filtering.
Happy to answer any questions!
A sample dashboard with this widget is attached below — feel free to import it into your own tenant via Advanced Analytics → Import from File and adapt the "starts with" rules to your own hostname convention.