

This dashboard helps you understand how Netskope is protecting your environment by quantifying risk reduction in $ as an impact to revenue and profit margin. The dashboard provides insights into two dimensions: Data Loss Prevention (DLP) Risk Reduction and Malware Risk Reduction.
For more details about how to further customize this dashboard based on your own environment, please check the customization guide here: https://community.netskope.com/t5/Advanced-Analytics-Dashboard/Reduction-of-Risk-Dashboard-Customization/ba-p/7391#M103.
Section 1: DLP Risk Reduction Calculation
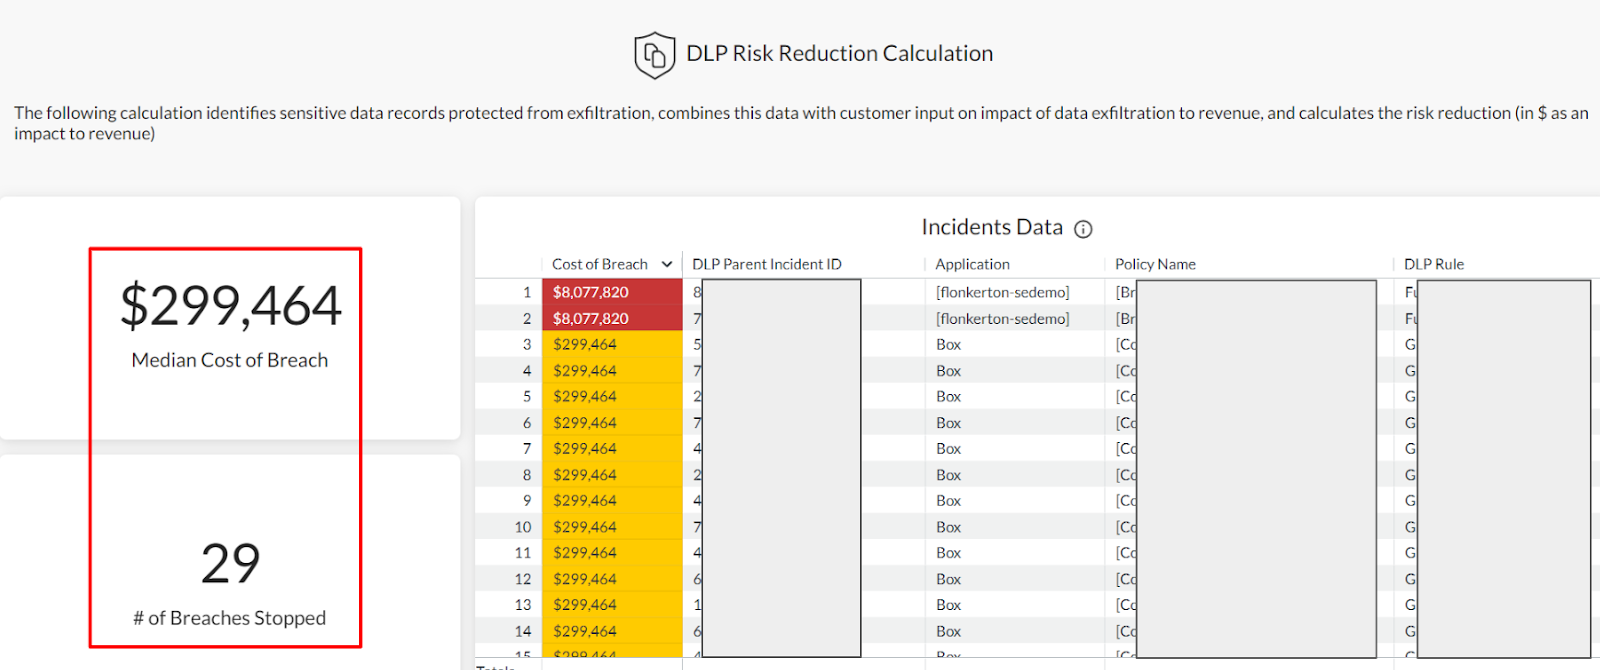
This section provides visibility into data exfiltration attempts stopped/controlled by your Data Loss Prevention (DLP) policies and the corresponding $ in risk reduction. On the right hand side, the “Incidents Data” table gives a detailed view into Data Loss Prevention (DLP) incidents in your environment (e.g. Incident ID, Policy, Rule, User, etc.).

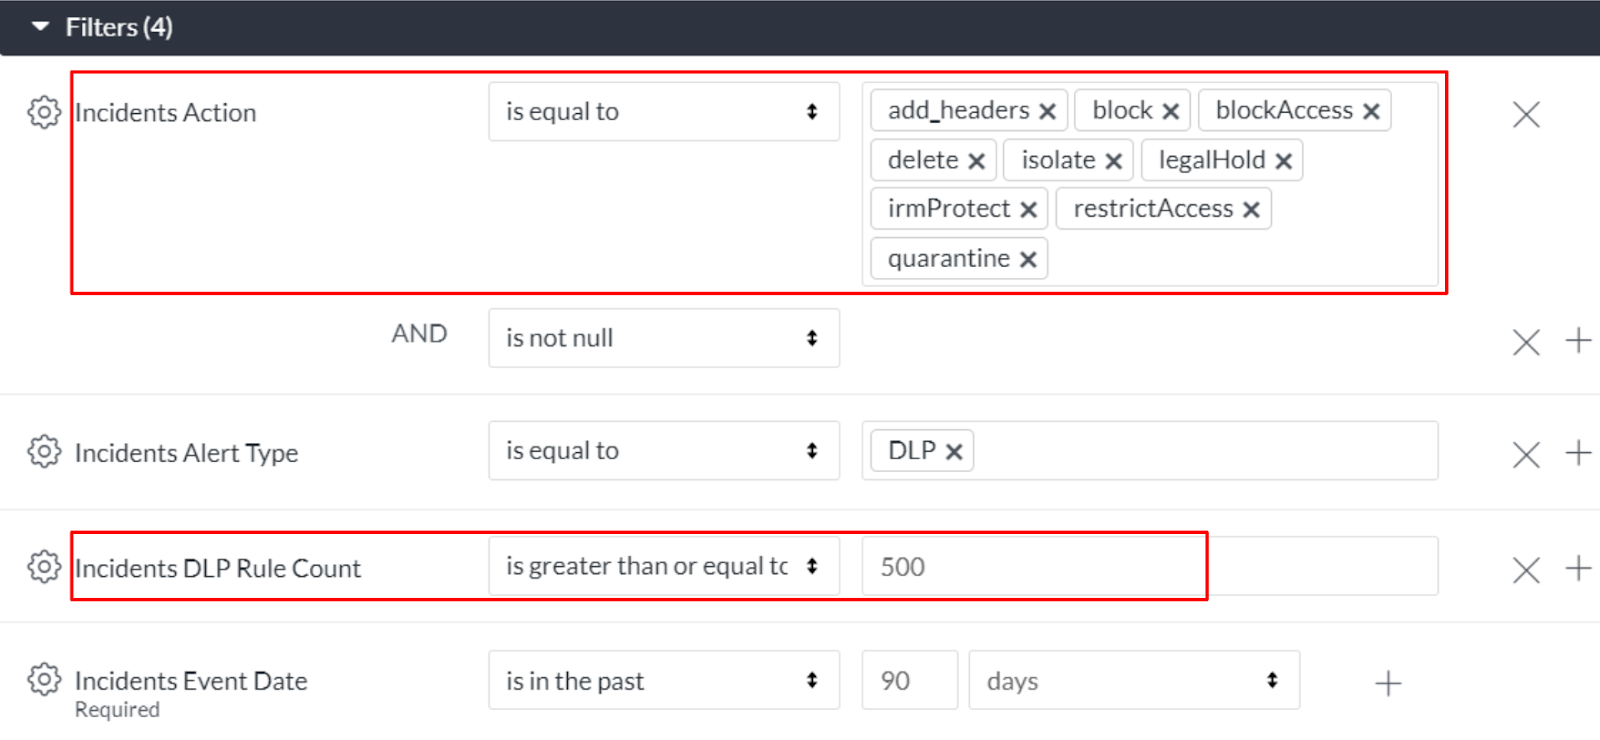
Please note that only incidents with “control” actions are captured here. If an incident is only alerted, it will not show up here. Also, we are only looking for incidents with 500 or more unique Data Loss Prevention (DLP) rules triggered.
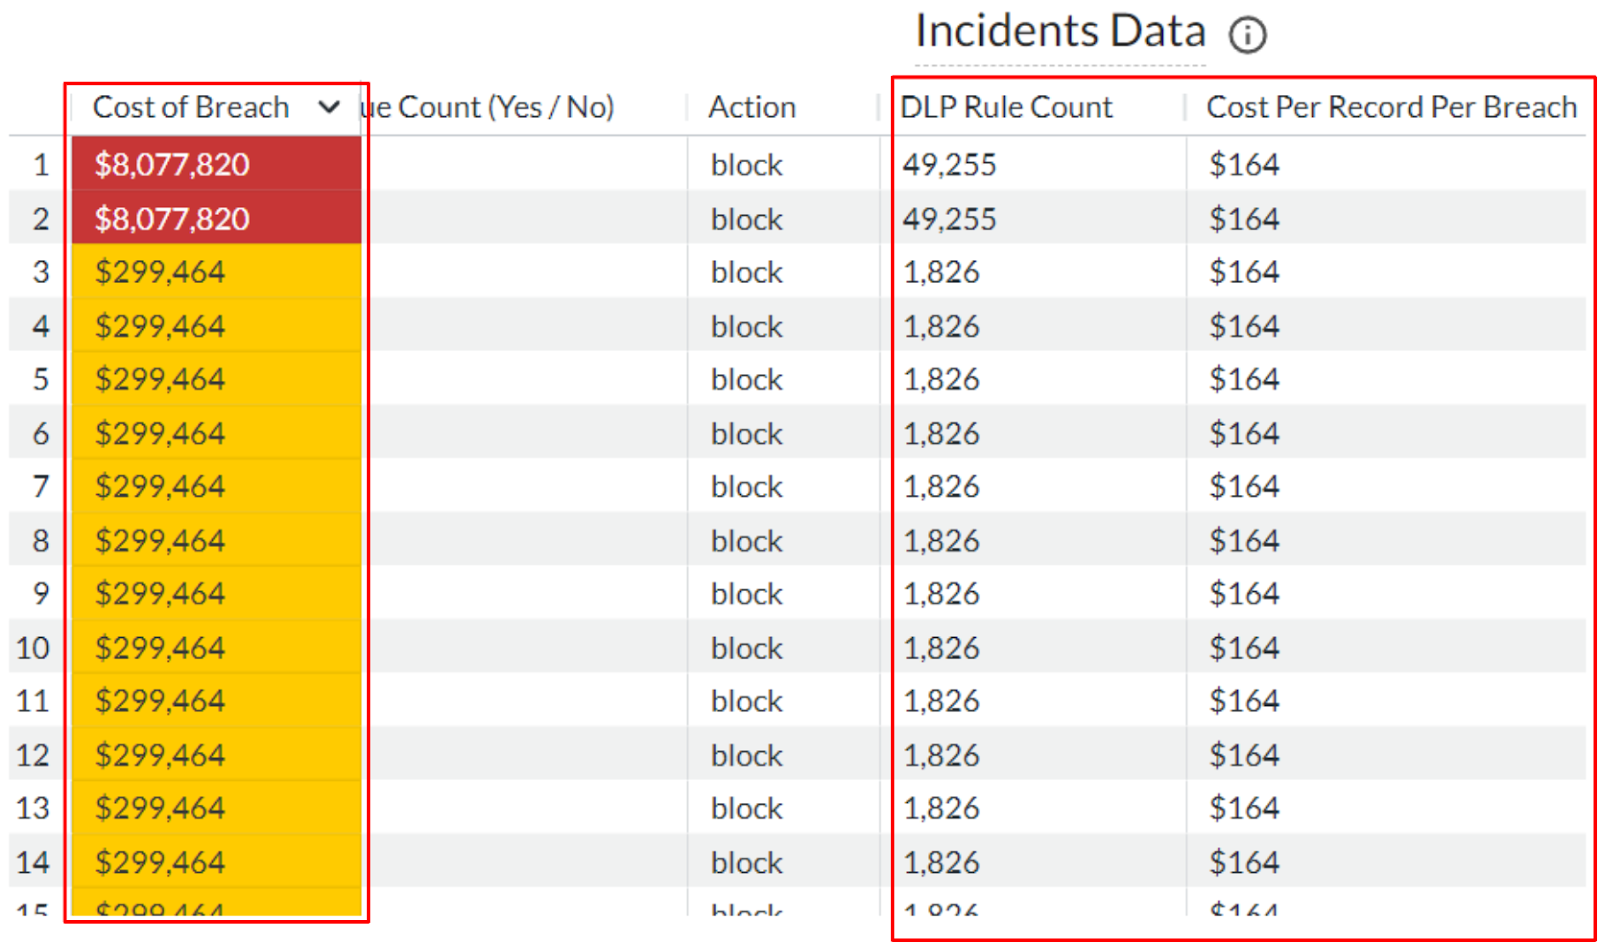
The main takeaway of this table is the “Cost of Breach” of each incident which is calculated by “DLP Rule Count” times “Cost Per Record Per Breach.” It measures the risk reduction in $ as an impact to revenue and profit margin, i.e. the potential $ loss (caused by data loss) that Netskope helped you avoid. You might see the same incident being listed multiple times. This is because all DLP rules are being shown here, and there can be multiple Data Loss Prevention (DLP) rules triggered by a single incident.
On the left hand side, the dashboard provides the median value of “Cost of Breach” together with the number of breaches that Netskope stopped.
Explanations of all calculation logics and supporting reference documents are also provided at the bottom of this section. If you have any questions, e.g. how was “Cost of Breach” calculated, please check here for answers.

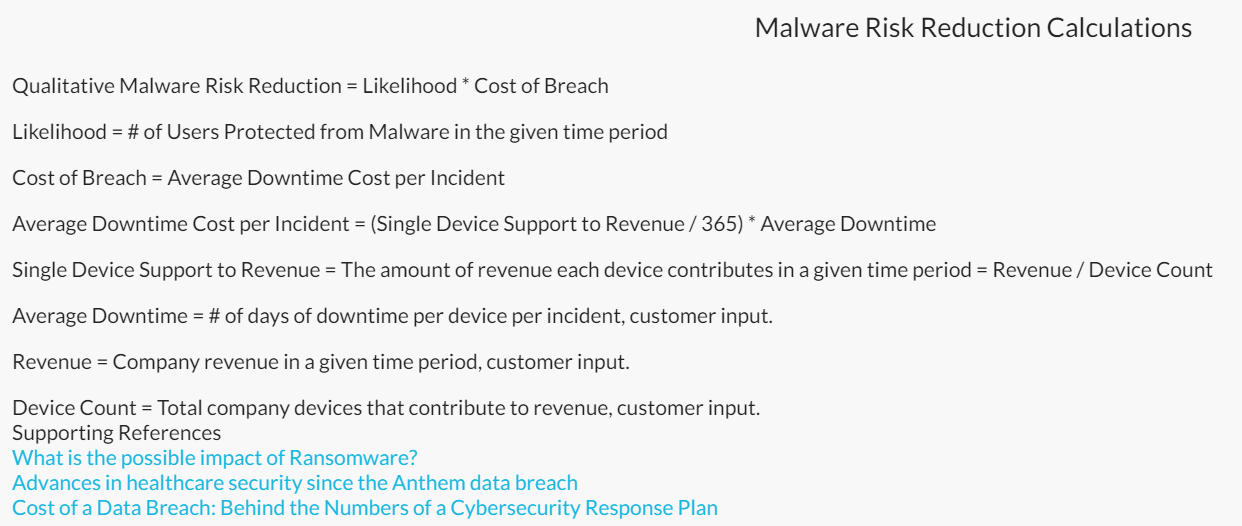
Section 2: Malware Risk Reduction Calculation
This section provides visibility into how Netskope is protecting your organization from malware and the corresponding $ in risk reduction. If a device in your environment is not protected from malware, it will be down for an amount of time (hours, days, or even weeks). In this case, this device cannot be used to contribute to your revenue. This is how the assessment in this section works. Please note that this does not account for the time spent by your security or IT teams to restore the impacted devices.
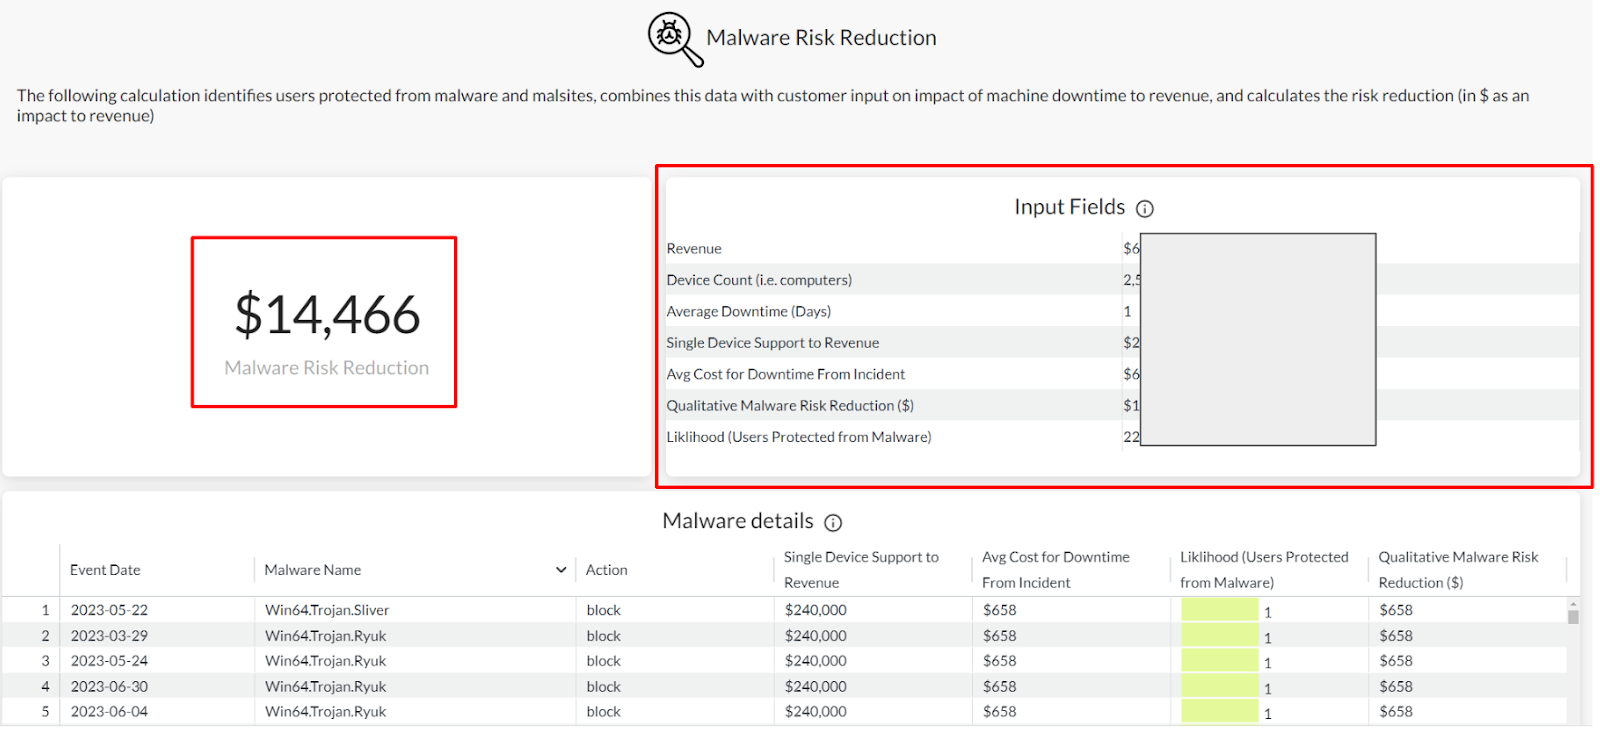
On the upper right side, the “Input Fields” table lists all factors included in our assessment (e.g. Device Count, Average Downtime, Avg Cost for Downtime, etc). The view on the upper left side shows the “Malware Risk Reduction” which is calculated by “Avg Cost for Downtime From Incident” times “Likelihood (Users Protected from Malware).” It measures the risk reduction in $ as an impact to revenue, i.e. the potential $ loss in revenue (caused by malware) that Netskope protected you from.
Explanations of all calculation logics and supporting reference documents are also provided at the bottom of this section. If you have any questions, e.g. how was “Likelihood” calculated, please check here for answers.
The dashboard is attached below. Please import and view it in your own environment. Feel free to let us know if you have any questions or need any help!


