

Hello Folks,
Below you can find a recap of questions asked at the office hours sessions last month and those sent in that we were not able to cover at the session. Feel free to comment and continue the discussion, as well as attend future sessions that can be found on the Community Events Calendar!
Q: I’m looking for visibility into YouTube usage in my organization. Can Advanced Analytics help me with this?
A: Sure! Please check the YouTube Activity Dashboard from our community. This dashboard will give you an overview and approximation of the time users spend on YouTube.
Q: My organization is interested in learning when users are downloading from corporate applications to personal machines without the client installed. Is this possible? How to make sure it’s NOT from a managed device (possibly looking at non-corporate IP ranges)?
A: In general, Netskope recommends that conditional access be used within the application management controls to lock out access, if that is supported. However if just visibility of these scenarios is required, the best way to do this is to filter out Netskope and Corporate IP addresses for Application Events where activity = Download and Access Method = “API Connector”. Please reference this post for an example dashboard created which filters out Netskope IP addresses (You would also have to add corporate IP addresses to this list).
Consider using Netskope Reverse Proxy for supported applications, consult your Netskope UI. To identify the Netskope IP ranges, access the Netskope UI → Settings → Security Cloud Platform → Enforcement → Scroll to the bottom of the page and click the “Netskope IP Ranges” button.
Q: If the unmanaged devices are connected to the business network, could you leverage GRE tunnels to steer the traffic so you can still apply real time protection policies?
A: Yes. If somebody brings an unmanaged device and plugs into your network (could be personal, business partner, or a device with no client installed) and you steer all office traffic from GRE tunnel, then it is under Netskope control. There could be limitations with encrypted traffic. If the unmanaged device does not have Netskope certificate, then the device will not be able to access applications successfully. This would have to be in an office-like location, out of scope for work from home.
Q: Can I create an Advanced Analytics report that details more traditional web transactions in a chronological fashion?
A: The Transaction Events Investigation Dashboard from our library will be a good starting point. The Recent Events widget from this dashboard will help you answer this question. You can also use the User filter on top to narrow down the results.
Q: How do I give access to dashboards but restrict the data that can be viewed by the end user?
A: There are 2 ways to do this: (1) Create a dashboard containing the data that is permitted to view. Then download and schedule it so the end user gets a pdf or csv export. Always test the output by yourself to be sure of what will be sent. (2) Use the “Share with Executives” feature to share a live version of the dashboard, but ensure dashboard level filters are removed so that other data cannot be searched using the filters. Please note: Drilling is disabled for “Share with Executive” views which prevents unauthorized views of detailed data. Here are helpful resources on each topic:
Q: Can I view web transaction logs in Advanced Analytics?
A: You should be able to see web transaction logs in Advanced Analytics (They became available at the end of 2022). If no such data is displayed, please contact your account team.
Q: What are the additional retention data plans that are available for Advanced Analytics?
A: Advanced Analytics supports retention periods from 7 days up to 13 months. Additional licensing may be required. More info can be found here: https://docs.netskope.com/en/netskope-help/admin-console/advanced-analytics/explore-page/advanced-analytics-data-retention/#:~:text=Netskope%20Advanced%20Analytics%20supports%20retention,grace%20period%20to%20run%20reports.
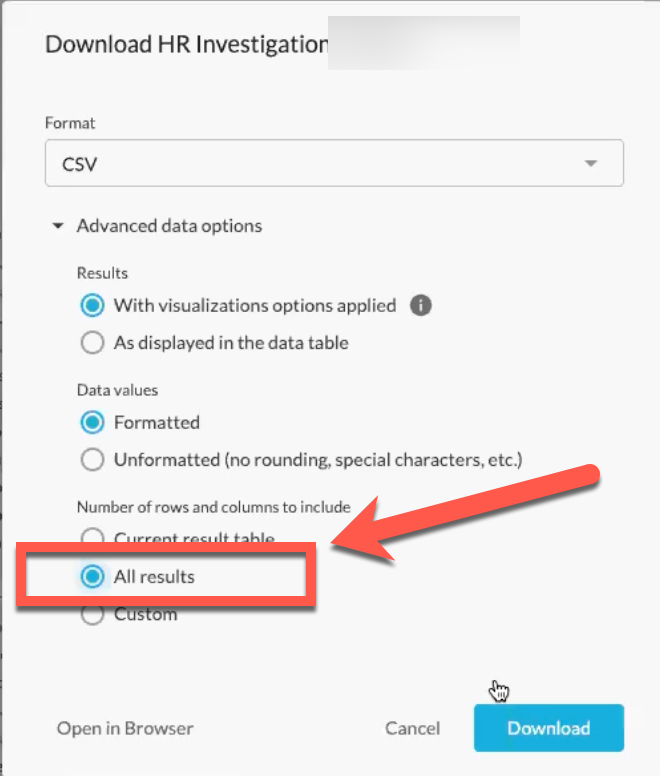
Q: Is it possible to download more than 5000 records of data in Advanced Analytics.
A: Yes. Using the CSV and Text formats it is possible to download more than 5k rows of data provided your data table is not using “table calculations”. Use the following option to do this:
Q: Is there documentation of what controls what shows up in Page Events?
A: Details about Page Events can be found here: https://docs.netskope.com/en/netskope-help/admin-console/skope-it/skope-it-pages/about-page-events-112502/page-events-faqs/#what-do-page-events-capture
Q: How do we trigger alerts only for new violations? This is for API Protection for Google Drive. If a file was detected with a violation (shared publicly or via a non-specified / untrustworthy domain), I’ll still get an alert even if it is shared internally now. How can we avoid this issue?
A: This situation described may indicate a need to tune policies so that internally shared objects do not trigger an alert, please address this topic with your Customer Success Manager (CSM) or account team.
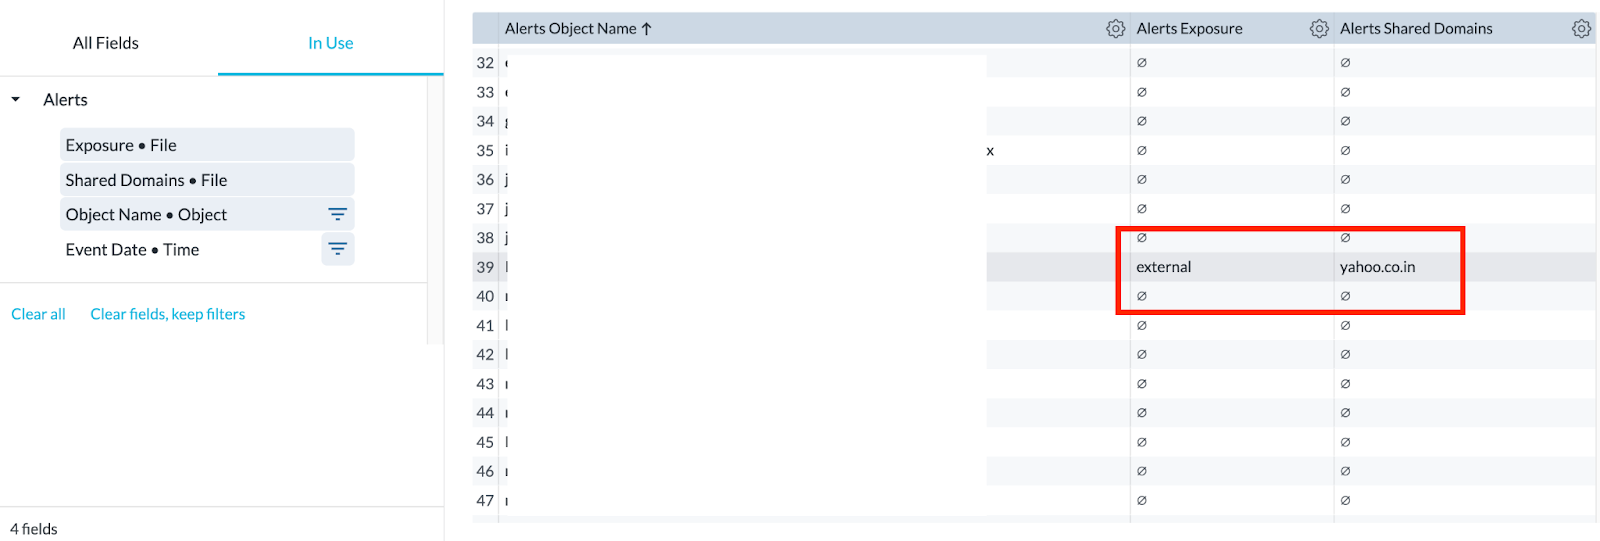
That said, you can use Advanced Analytics to triage your alerts, which helps you identify instances when alerts were triggered for external sharing. To do this, do the following:
- Open an Explore
- Select “Application Events” in the upper right hand side where it says “Data collection”
- Pull in Object Name, then add the Exposure and Shared Domains fields. You’ll then be able to check if a file was shared externally, and the corresponding domain. (It is also recommended to filter on Access Method = API Connector)
Q: Is there a way to use AA to get data on the amount of whitelisted URLs that have been used in the last X days?
A: Yes, here are some steps to follow to achieve this. Create a whitelist URL list. Whitelisted URLs are usually created in the URL lists. You cannot associate URL lists with a policy but with a custom category. To do this, create a custom category first, and then associate the custom category with the whitelist URL, then create policy that references the custom category. To see the usage on whitelisted URLs, open Advanced Analytics and use the Explore option to pull att traffic/users where “Policy Name” = <your recently created policy using the whitelist custom category> and action = allow.
Q: Can we see sites that have been configured to use Reverse Proxy if they are not using Client?
A: Yes. You will only see sites using Reverse Proxy if they are not using Client.
Q: Is there a recommendation for a good heatmap visual to display risk types (email exfil, cloud storage uploads, etc.) and their impact/volume?
A: Map visuals are supported by Advanced Analytics. You can use the Map or Static Map for this. However, in this case it may make more sense to use a simple table with conditional (color) formatting. Please reference this post for more details about the visual configuration.
Q: I want to create a Sankey chart to show my data flow. Can you show me how to create it from scratch?
A: Sure. Here is a video to walk you through reading and creating Sankey diagrams: https://www.youtube.com/watch?v=4-2yh_u3_9k&list=PLoCX2twqHg72m7Cds9C_FKV5_9G2ZjnYH&index=16&t=4s
Additionally here are written instructions around this topic:
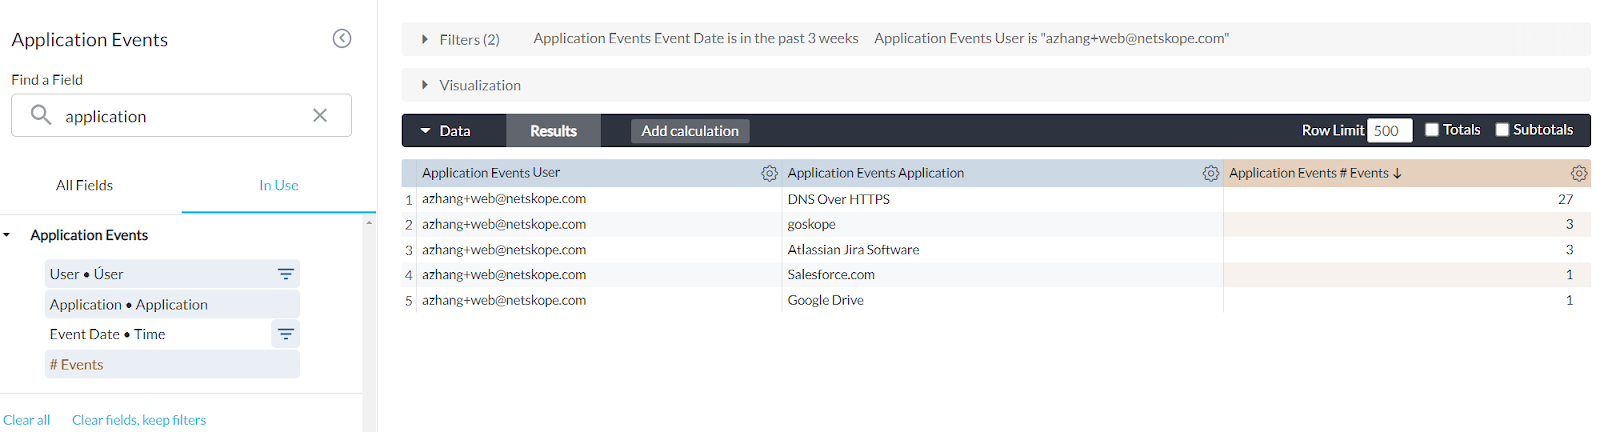
To start, please pick your preferred data collection and enter the visual (widget) edit mode. Basically, a Sankey chart shows relationships (e.g., data upload) between two or more subjects. So, it must contain at least TWO dimensions and ONE measure. We are using User and Application as two dimensions and # Events as the measure here.
Expand the visualization sections. In the visualization tool bar, click the 3-dot button and select Sankey in the drop-down menu. You will then get the Sankey chart. The chart shows you the number of events moving from the user (left) to corresponding applications (right). The band width here reflects the number of events. A wider band represents a higher number of events.
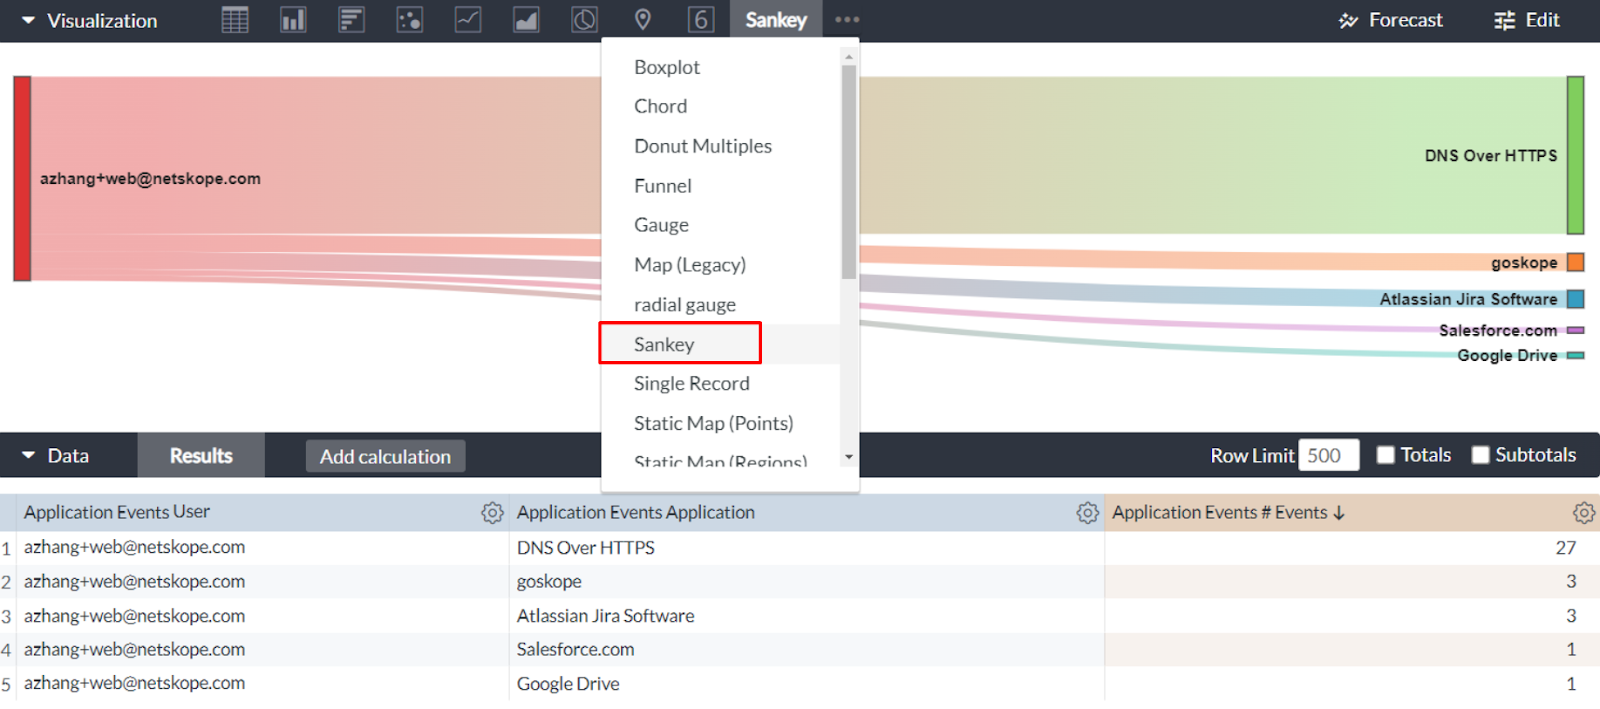
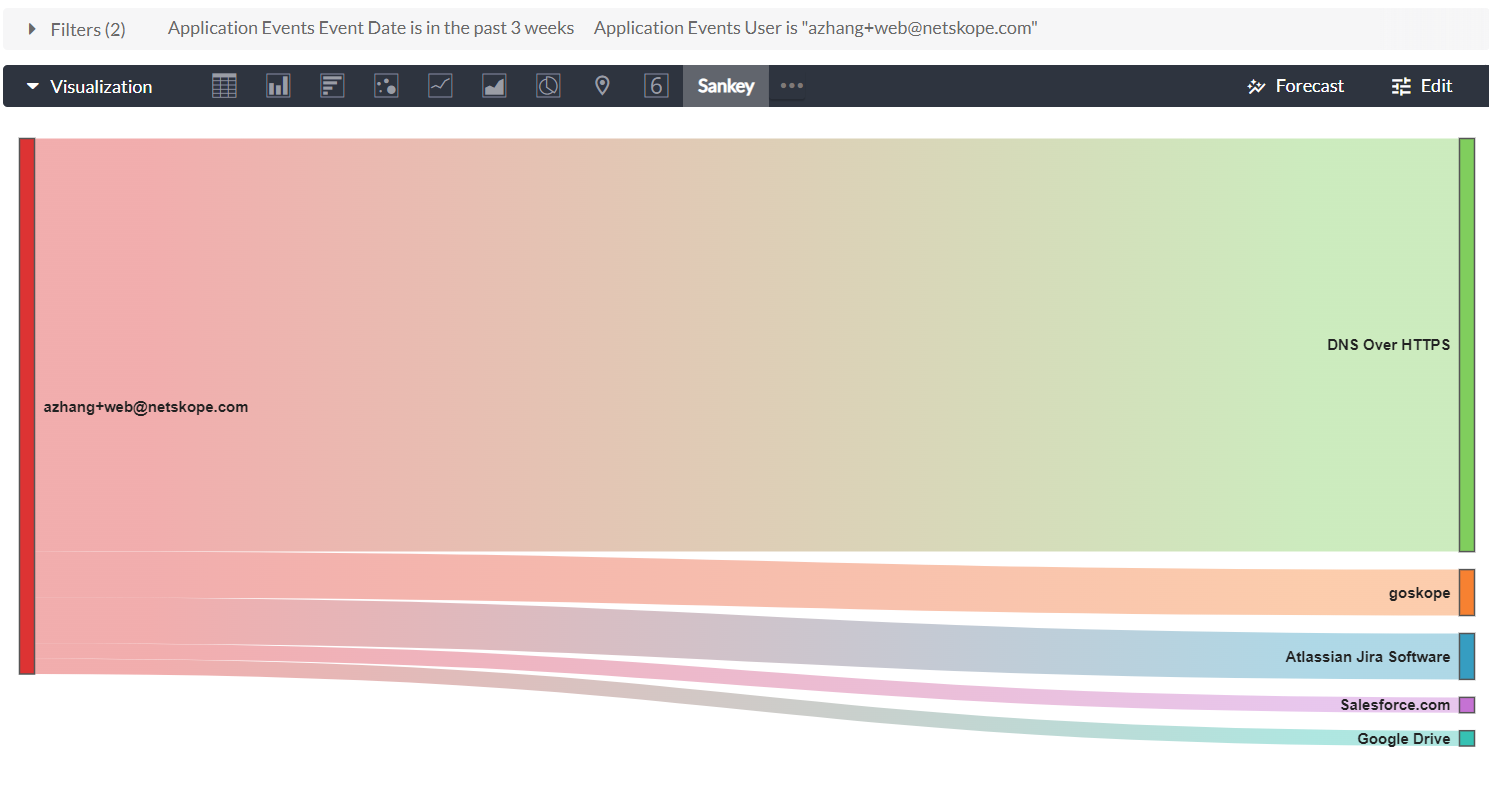
A Sankey chart is good to present insights to leadership, as it reflects quantifiable metrics between things. However, it cannot handle too much data. To avoid data cutoff which may cause misinterpretation, we recommend limiting it to 2-4 dimensions or less and limiting rows of data to approximately 20-30.
Q: How can I leverage Advanced Analytics to help with software license management?
A: The Software/App License Usage Monitoring Dashboard in our community will help you with this. This dashboard helps you understand how much your organization is using a particular application, and what kind of usage is detected (i.e. activities). This information can help you understand if you are overusing (exceeding licensing agreement) or underusing an application (i.e. overpaying).
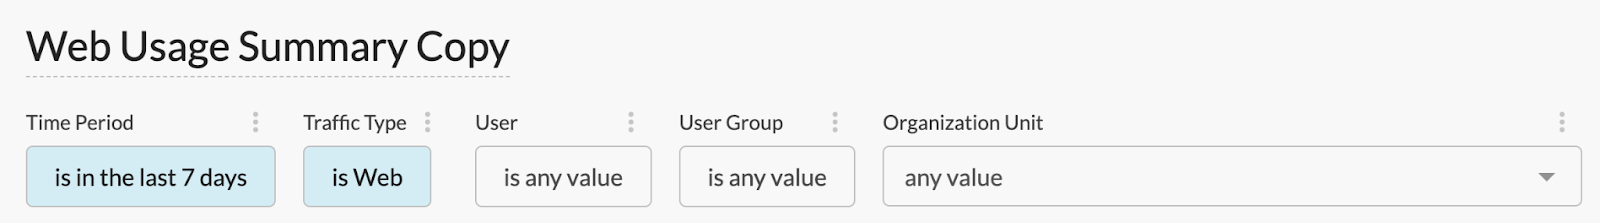
Q: How can I quickly tweak a template such as “Web Usage Summary” to get results for a particular individual, AD group, or list of users?
A: Dashboard level filters will help you with this. In the dashboard edit mode, click Add Filter, and then add User, User Group, and Organization Unit filters.
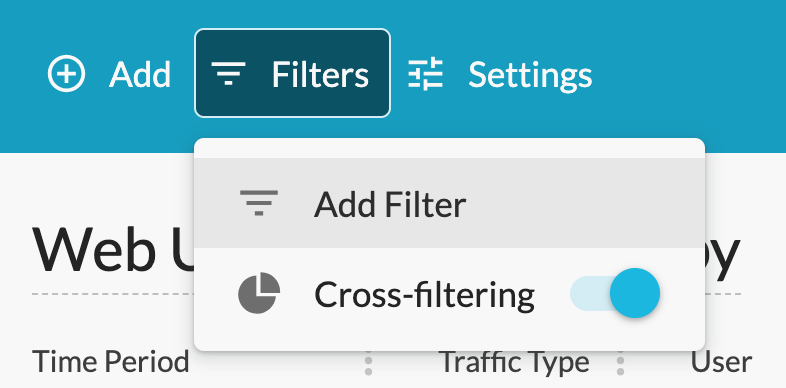
If any of the filters does not work, please check our troubleshooting video here: https://www.youtube.com/watch?v=Rs7PI_wgD-4
Q: How to get visibility and control of WhatsApp and iMessage sessions, especially in regulated industries, with Advanced Analytics?
A: We have 2 dashboards that can help you with this: Category Summary (apply Category = Chat, IM & Other Communication in the dashboard filters) and Application Activity Summary (apply Application = WhatsApp in the dashboard filters). Both can be found in our library.
Q: Can I leverage Advanced Analytics to get insights into data access, protection, and storage in my organization?
A: Yes. Please check the Risky Data Movement Dashboard from our community. The dashboard will help you understand the allowed data movement to unmanaged applications and non-corporate instances.
Q: Can traffic from virtual machines be tracked by Netskope?
A: Unless the virtual machines’ hostnames are named in a certain way, Netskope does not distinguish between real and virtual machines.
Q: I’m very interested in the usage of AI applications in my organization. Can I leverage Advanced Analytics on this topic?
A: Absolutely! Please check the AI Usage Dashboard in our library. This dashboard helps you better understand how users are using AI applications in your organization. Some questions answered include: How many users are using AI in the organization? What are the top AI apps/sites in use? What activities are being detected in AI apps? How is AI use being controlled? More discussions on this topic can also be found in our community blog: AI Usage Using Gen AI Category.
Q: I’m looking for some resources regarding data security posture management with Netskope and best practices & policies to apply. Can Advanced Analytics help me with this?
A: We have 2 great starting points: Cloud Risk Assessment - QBR Dashboard from our library and NG-SWG Operationalization Dashboard from our community.
Q: What is the best use of Advanced Analytics to detect Insider Threats?
A: Netskope UEBA policies are responsible for flagging anomalous user behavior. Advanced analytics dashboards take the UEBA alert information and help customers understand top risky users and trends overall. Specifically, use the Insider Threat Dashboard in the library to identify top risky users in your organization. Please reference this helpful video on how to interpret and customize this dashboard.


