

Check out the Disabled Client Dashboard! We’ve created this dashboard in response to several use cases related to disabled devices in the environment. This dashboard allows you to explore the following questions:
- How many devices are disabled?
- What percentage of the devices in the environment are disabled?
- Why are the devices disabled?
- How many users are disabling their devices? Who are these users?
- How long have the devices been disabled?
Here are the main sections of the dashboard:
Number and Percentage of Currently Disabled Devices
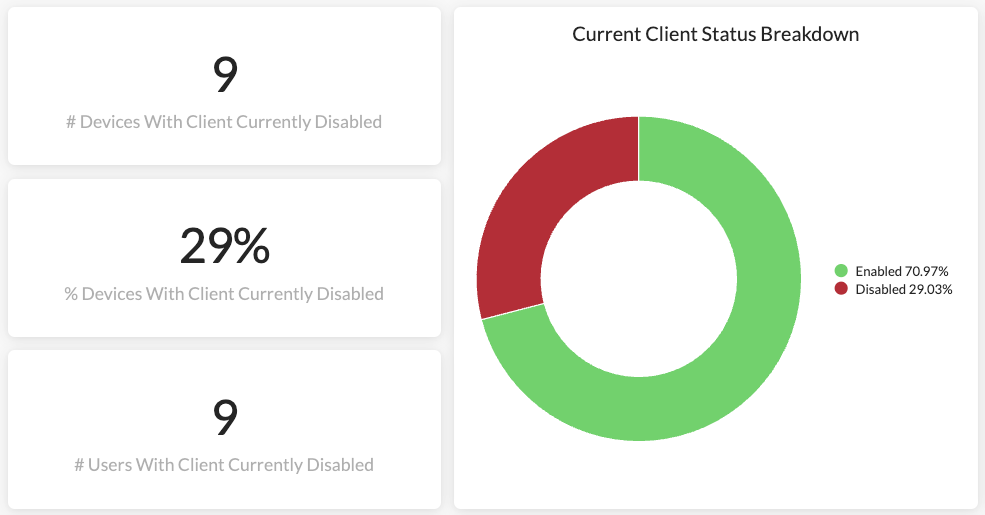
These widgets show the number and percentage of currently disabled devices in your environment. They also indicate how many users have disabled devices, helping you understand the current client status.
Number of Users by Status Change Reason
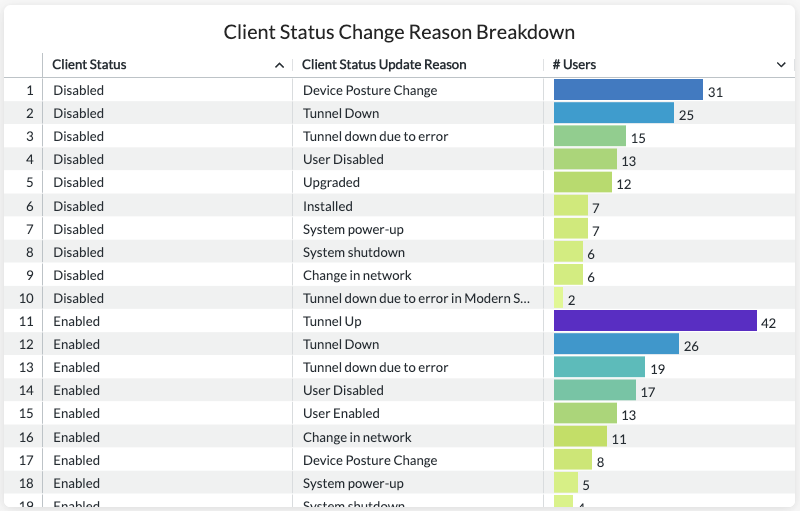
The “# Users by Status Change Reason” widget helps you understand the reasons behind device status changes in your environment, highlighting the reasons with the largest number of users. For example, the screenshot shows that the most common reason for client disablement is "Tunnel Down." This widget displays all past client status change reasons, not just current ones, giving an overview of the common reasons for device disabling and enabling.
User Who Have Currently and Previously Turned Off Their Clients
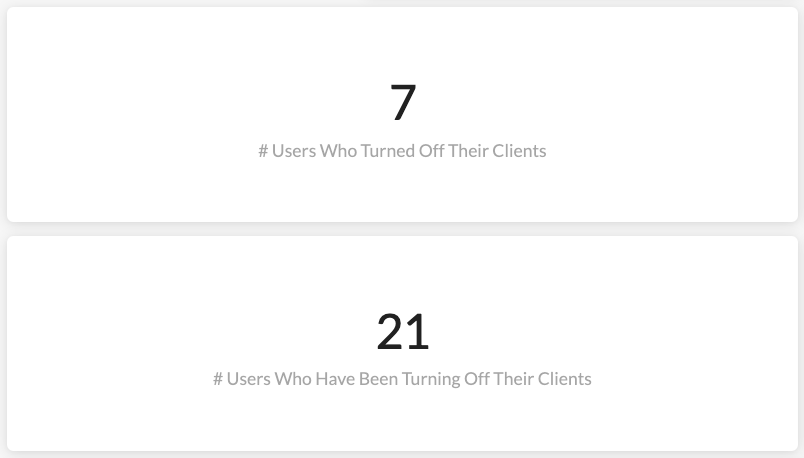
The “# Users Who Turned Off Their Clients” and “Users With Currently Disabled Clients” widgets show how many users have currently disabled their devices and identify who these users are. These devices are currently disabled by their users. Use cases include checking the status of devices belonging to terminated users to ensure they cannot disable their clients. Before preventing users from disabling their clients, these widgets help verify that their clients are not currently disabled, as we cannot make any settings changes to devices that are already disabled.
The “# Users Who Have Been Turning Off Their Clients” and “Users Who Have Been Turning Off Their Clients” widgets show how many users have disabled their devices in the past and identify who these users are. The devices counted are not necessarily currently disabled, but have been disabled before. The last column in the table indicates how many times each user has turned off their devices within a specified period, helping to identify suspicious activity. For example, from the screenshot, we can see that a user has disabled their client 45 times in the past 30 days. This frequent activity might warrant reaching out to understand the situation.
Client Disabled Duration
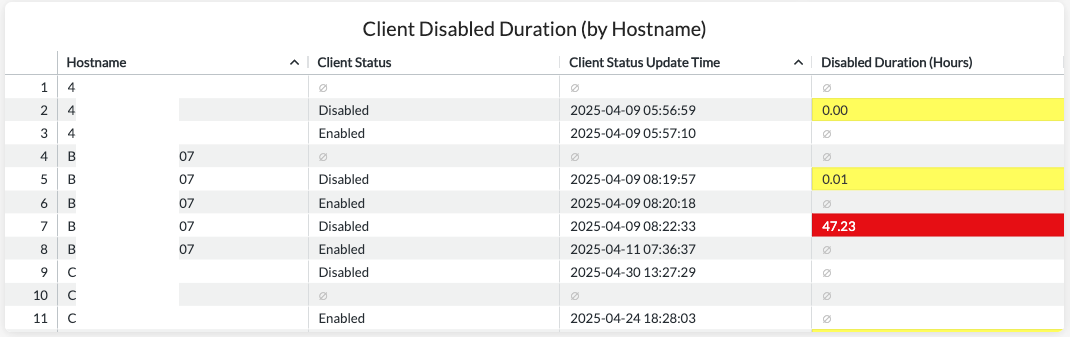
The Client Disabled Duration widgets provide visibility into disabled duration for hostnames and users. We have scaled the data in the disabled duration columns, marking relatively long disabled durations in red, medium durations in orange, and short durations in yellow.
The “Client Disabled Duration (by Hostname)” and “Client Total Disabled Duration (by Hostname)” widgets display the duration for which devices have been disabled in your environment, showing both individual disabled periods and total disabled time for each hostname. These widgets help you identify unusually long disabled durations for each hostname.
The “Client Disabled Duration (by User)” and “Client Total Disabled Duration (by User)” widgets show the disabled duration for each user, helping you spot users with unexpectedly long disabled times.
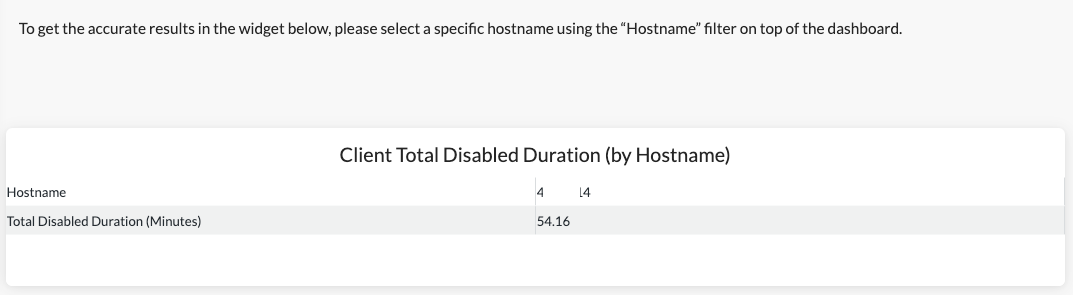
Special attention should be paid to the "Client Total Disabled Duration (by Hostname)" and “Client Total Disabled Duration (by User)” widgets. To ensure accurate results, select a specific hostname or user using the Hostname/User filter at the top of the dashboard. Otherwise, the results may be inaccurate.
The dashboard is attached below. Feel free to view it in your own environment and share any comments/feedback.


