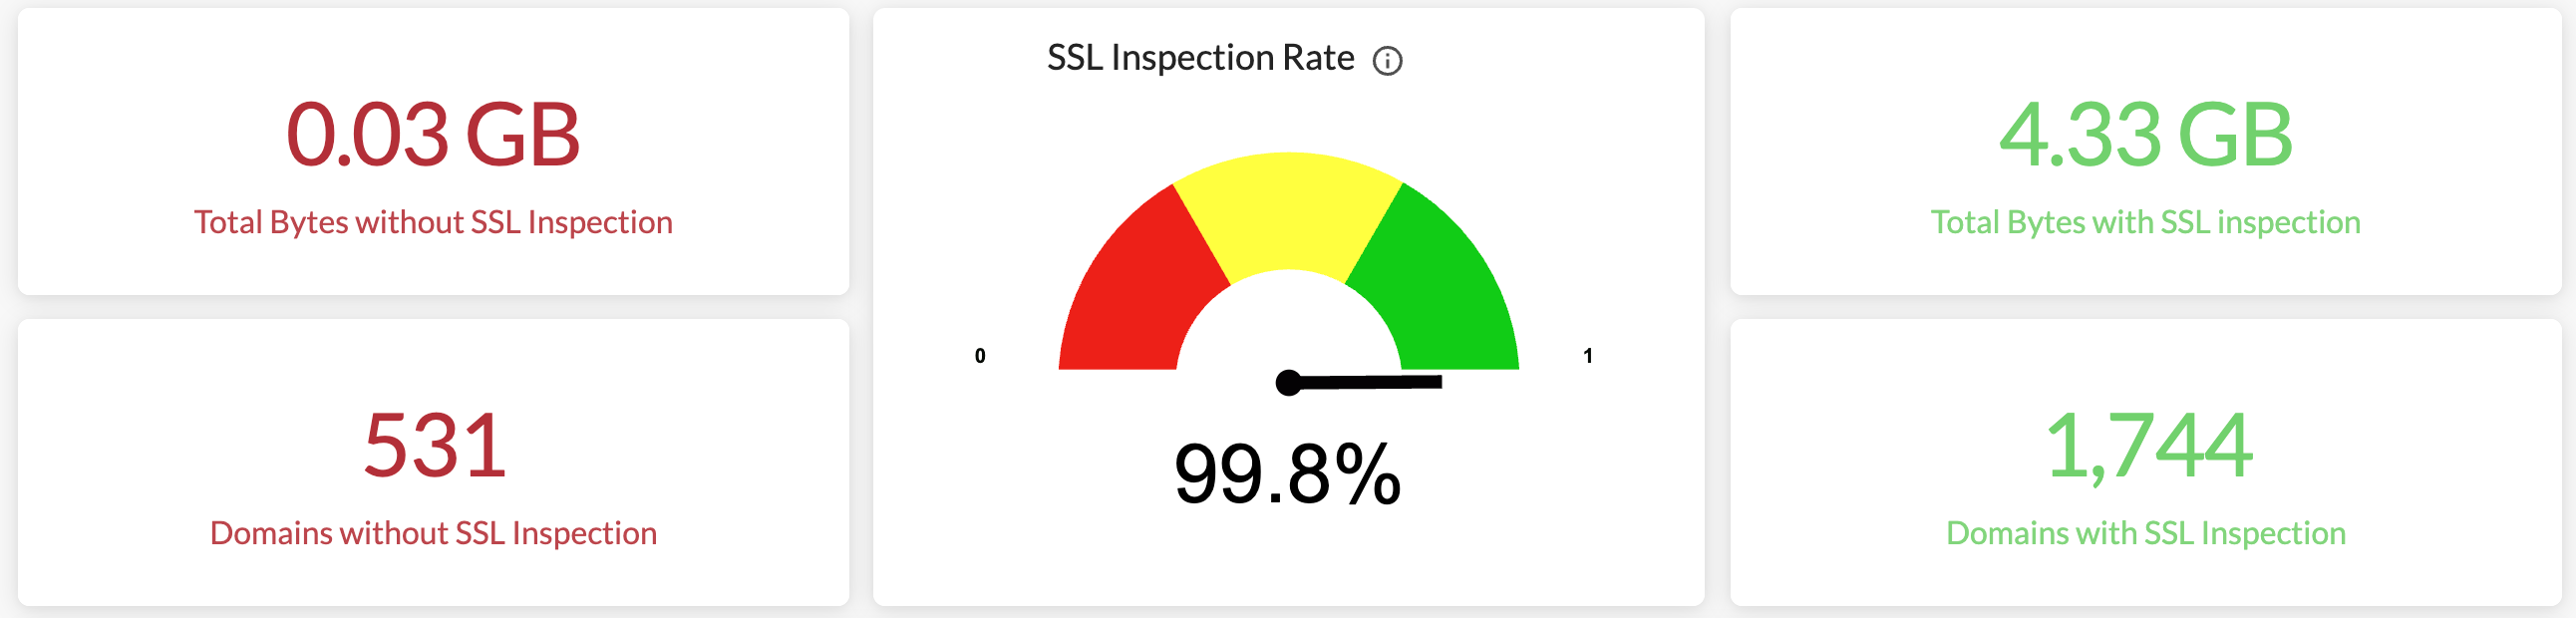
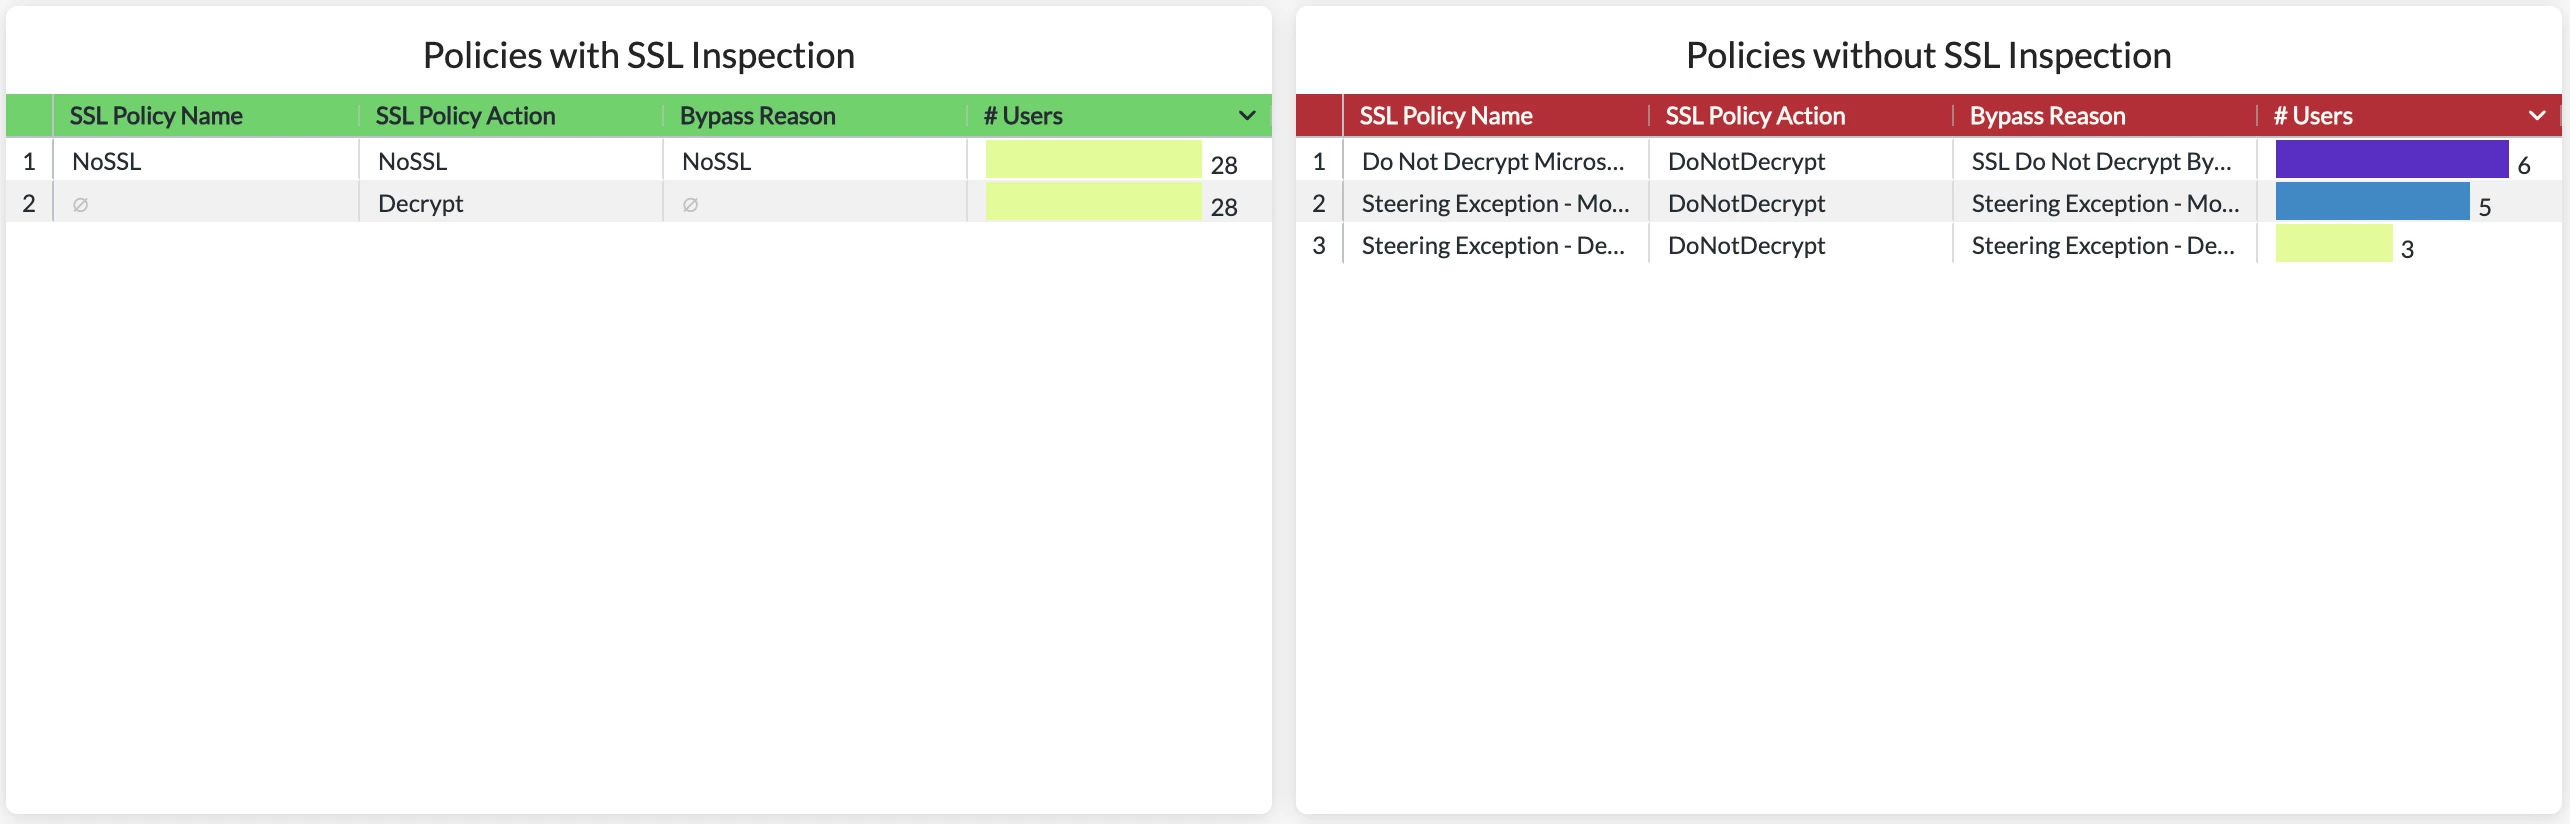
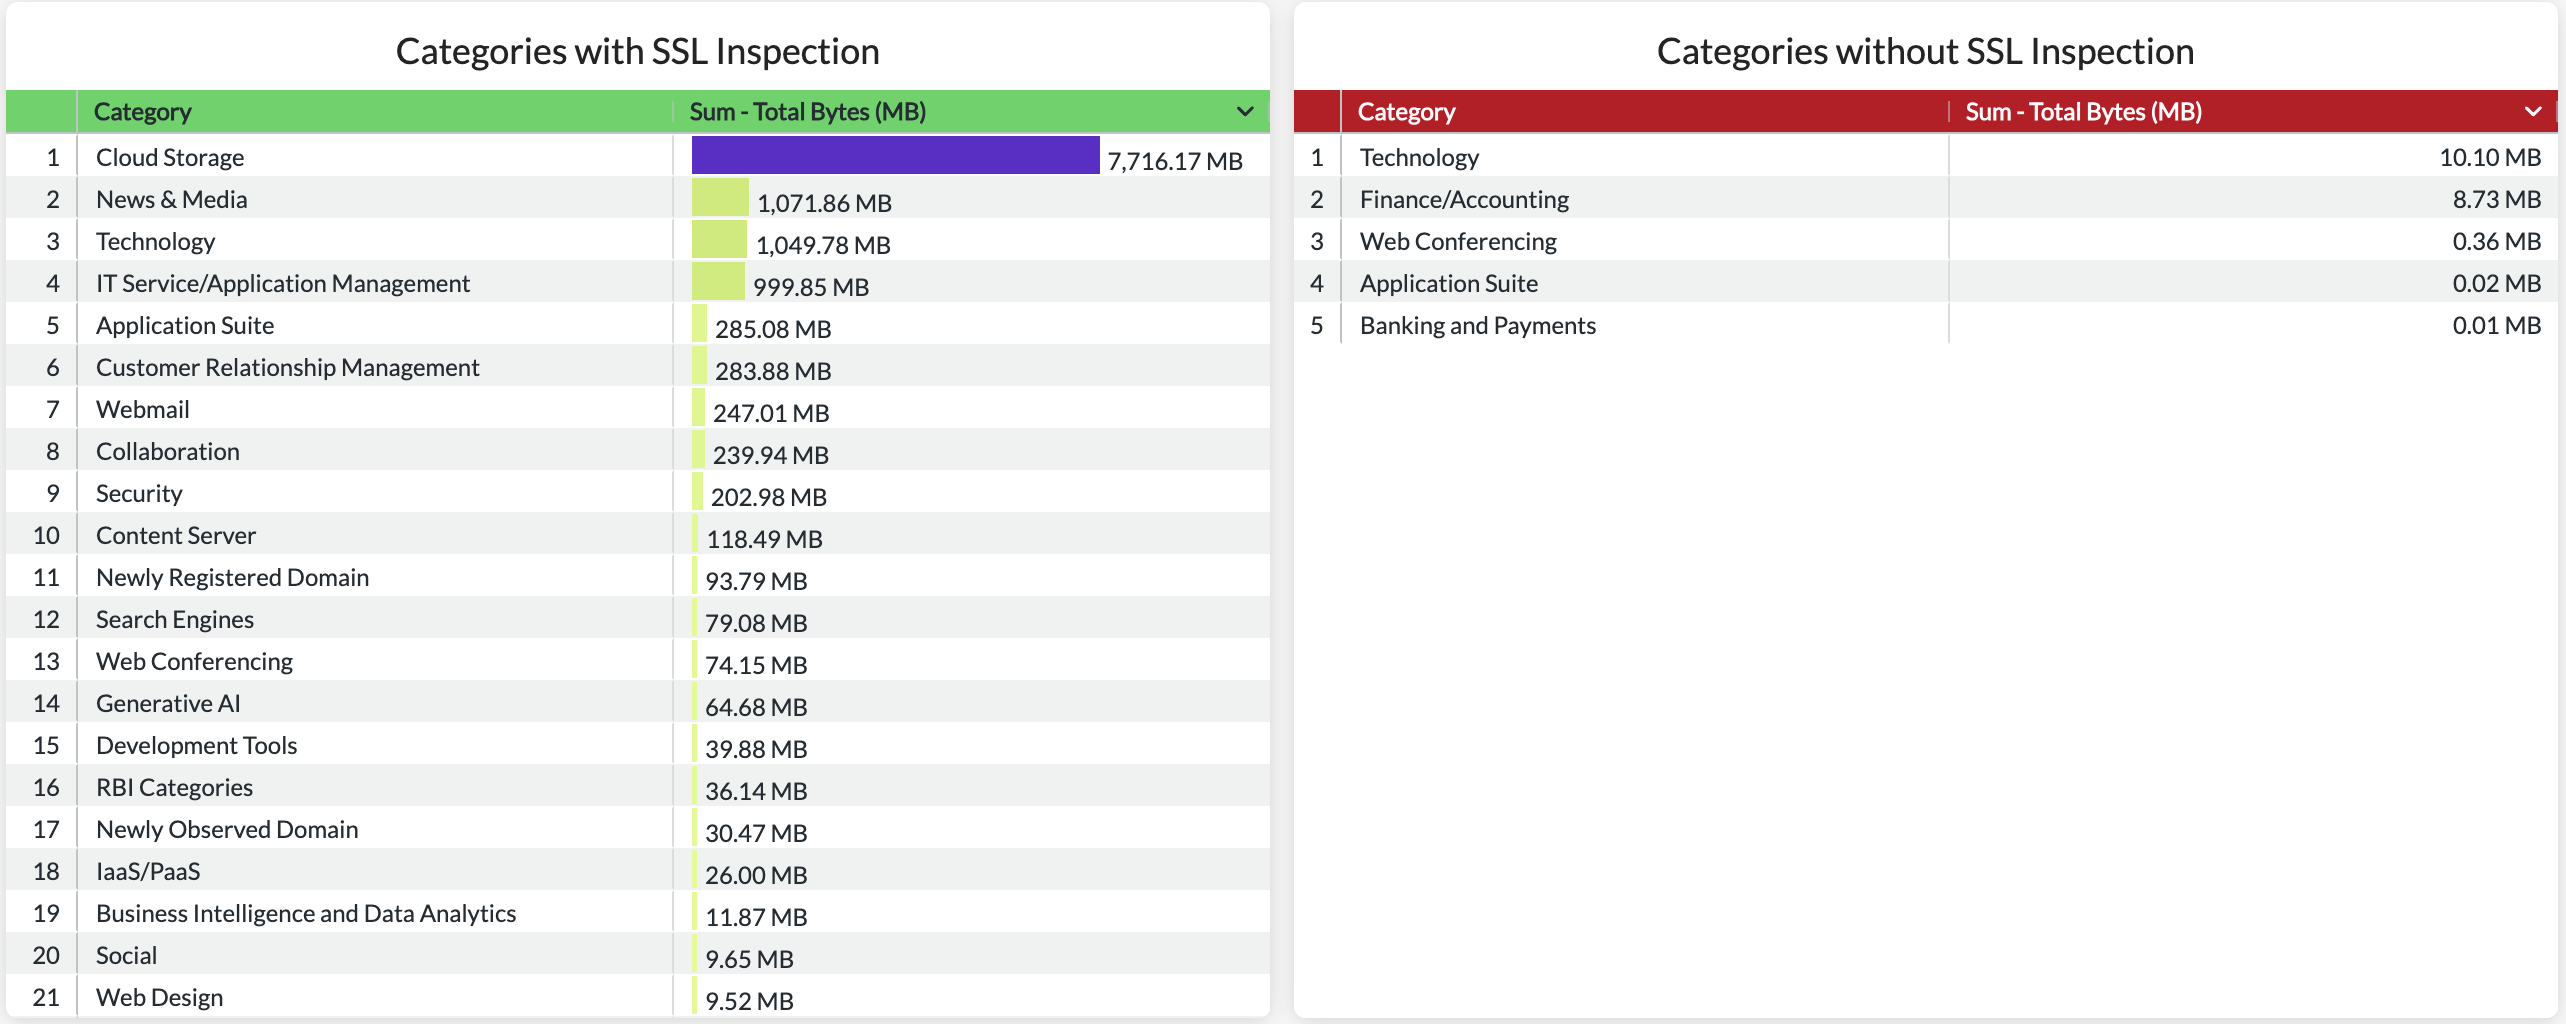
Check out this new SSL Traffic Insights dashboard that offers comprehensive visibility into all HTTP traffic. This dashboard displays whether traffic is encrypted or not and identifies the categories, applications, and hostnames that are not being decrypted, allowing you to focus your attention on those areas.


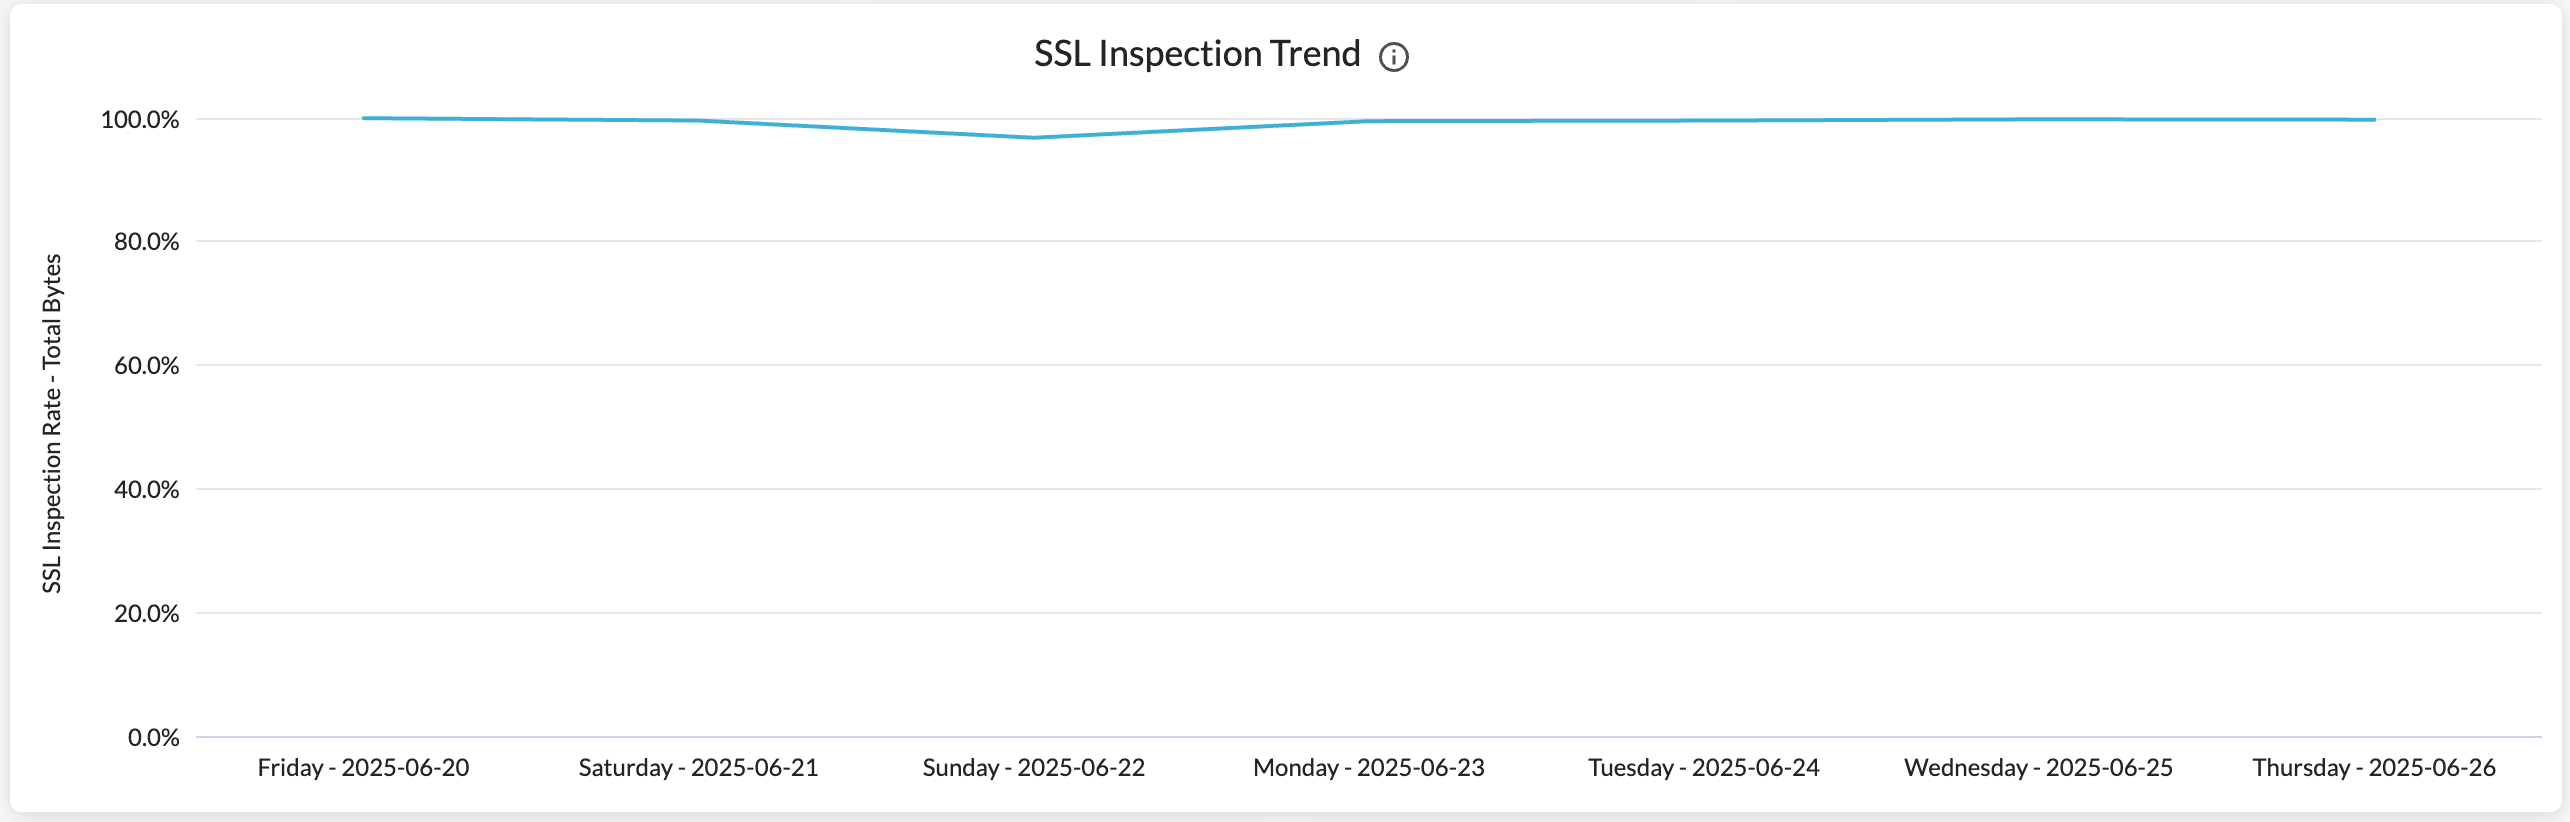
The dashboard also includes a trendline feature. This will help you identify any sudden spikes or gradual decreases in traffic inspection, enabling you to review and address them proactively.


when trying to upload, it says, the file cannot be imported since it contains {transaction_event} widgets.


Great dashboard & insights! Thanks for sharing.

Some recommendations:

  • It would be great to add a widget showing SSL DND policies in use. When there is a low SSL inspection rate, this will help users identify which DND policies are the major contributors.
  • For all the tables, it would be great to add a new column for user count. This will help users gauge the impact of the SSL inspection/bypass.

Hi ​@arjun98854 

The issue appears because the Transaction Events data collection is not enabled properly or the ingestion is paused. Please reach out to your Netskope account team for help. 

Feel free to let me know if you have any other questions.

Best,

Aaron


Great dashboard & insights! Thanks for sharing.

Some recommendations:

  • It would be great to add a widget showing SSL DND policies in use. When there is a low SSL inspection rate, this will help users identify which DND policies are the major contributors.
  • For all the tables, it would be great to add a new column for user count. This will help users gauge the impact of the SSL inspection/bypass.

I will add those in the dashboard and will add the updated version of it.

Thanks for the input. Appreciate that !!


Reply