Hello Folks,
Below you can find a recap of questions asked at the office hours sessions last week and those sent in that we were not able to cover at the session. Feel free to comment and continue the discussion, as well as attend future sessions that can be found on the Community Events Calendar!
Q: How do I leverage Advanced Analytics for threat hunting activities?
A: Check out some blogs recently posted by Netskope’s internal security team including:
Q: I’m new to Advanced Analytics. How and where can I start my journey?
A: Netskope Advanced Analytics - Getting Started will help you get started in about 5 minutes. For a more indepth getting started guide, check out our recent webinar Getting Started with Advanced Analytics.
Q: How can I leverage Advanced Analytics to properly measure policy effectiveness?
A: To measure your policy effectiveness, we recommend starting with the DLP Policies Dashboard in the library. The dashboard provides visibility into the policies generating alerts, including policies triggered, actions taken, and users triggering these alerts, etc. The DLP Incidents Monitoring Dashboard in our community can also be helpful. Feel free to download and upload it to your own environment for more details.
Q: I’m trying to show the business value of our Netskope investment to my leadership. Are there any dashboards that can be used in this case?
A: Of course! We recommend using the NG-SWG Operationalization Dashboard in our community. The primary purpose of this dashboard is to help you maximize the ROI of your Netskope investment by highlighting ways to ensure you are using Netskope to its full potential. The specific focus of this dashboard is operationalization of the NG-SWG product. Please download and upload it to your own environment for more details.
Q: There is a visual about POP utilization in the NG-SWG Operationalization Dashboard. How should I read and use that visual?
A: The “NewEdge POP Utilization” map helps you identify if there are any PoPs being used that should not be in use. If you see utilization of PoPs in restricted zones, contact your account team to review your Global Traffic Management (GTM) settings. More information can be found in the dashboard.
Q: There is a section about SSL/TLS Inspection in the NG-SWG Operationalization Dashboard. How can I use it?
A: This section helps you understand how much of the traffic you sent to Netskope will be allowed for decryption. More details can be found in the dashboard.
Q: How can I report on risky cloud storage applications with the biggest downloads?
A: The Category Summary Dashboard in our library can help you with this. The dashboard is filtering based on the “Cloud Storage” category by default, so you can directly check the “Top 10 Applications by Bytes Uploaded/Downloaded” widget for cloud storage applications with the biggest downloads. To filter on “risky” applications, simply set the “Sanctioned” filter on top of the dashboard to “No.”

Q: I’m very interested in the usage of AI applications in my organization. Can I leverage Advanced Analytics on this topic?
A: Absolutely! Please check the AI Usage Dashboard in our library. This dashboard helps you better understand how users are using AI applications in your organization. Some questions answered include: How many users are using AI in the organization? What are the top AI apps/sites in use? What activities are being detected in AI apps? How is AI use being controlled? More discussions on this topic can also be found in our community blog: AI Usage Using Gen AI Category.
Q: I’d like to know more about the usage of Netskope Private Access (NPA) in my organization. Are there any recommended dashboards to start with?
A: We recommend starting with the Private Application Overview Dashboard in our library. By providing visibility into the usage of private applications and access publishers, this dashboard will help you better deploy your NPA solutions.
Q: What type of malware are you seeing that tries to work around the Netskope Proxy networks?
A: Killing security software has always been something that malware does and something we see most malware samples that we look at doing. Specifically targeting Netskope has not yet become a common place, but will as we continue to gain popularity.
Q: Are there any risk reduction templates to showcase how Netskope reduces my organization’s risk when compared with other industry peers?
A: Absolutely! The Industry Benchmarks Dashboard in our library is a great starting point. It helps you compare your organization to your industry peers using risk scores. The lower the score, the better. This dashboard also provides an in-depth investigation of your risk scores from 3 dimensions: threat activities, application risk, and user risk. Please note that this dashboard is read-only.
Q: Can I create reports for a particular group of users from my organization?
A: Yes. In this case, we recommend starting with the User/Organization Unit Summary Dashboard in the library. By adjusting the User Group filter and the Organization Unit filter, you can see activities by particular user groups.
Q: Are there any visuals that can be used to show client or publisher details?
A: Yes. The Private Application Overview Dashboard in our library provides visibility into the usage of private access publishers.
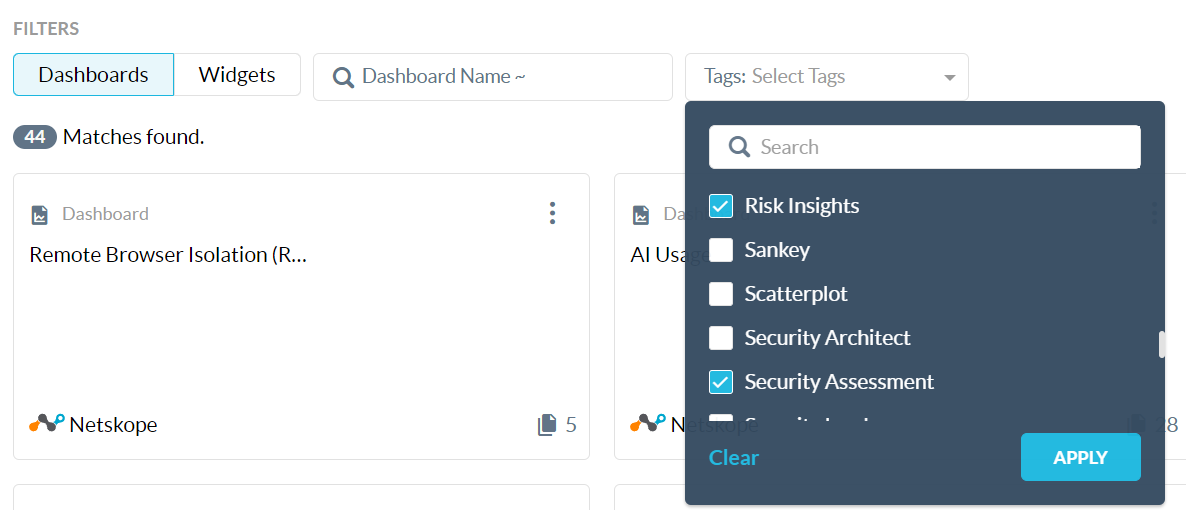
Q: How can I get actionable insights with Advanced Analytics about my environment, security posture, and risk exposure.
A: Netskope library is always a great starting point for this type of question. Also, the “tag” feature will help you locate any dashboards you need. If you’re interested in security posture and risk exposure, try “Risk Insights” and “Security Assessment.”