


Hello Folks,
Below you can find a recap of the topics discussed during the September Advanced Analytics office hours and those sent in that we were not able to cover in the session. Feel free to comment and continue the discussion, as well as attend our future sessions that can be found from the Community Events Calendar!
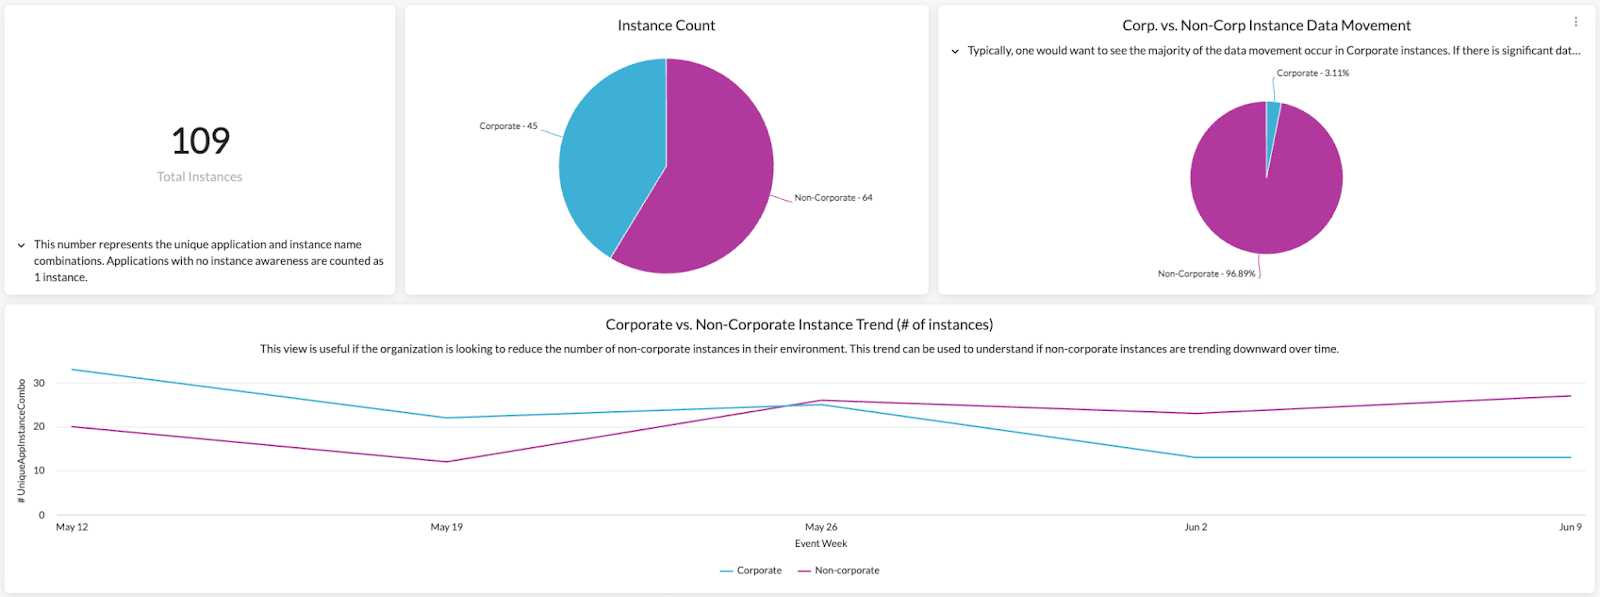
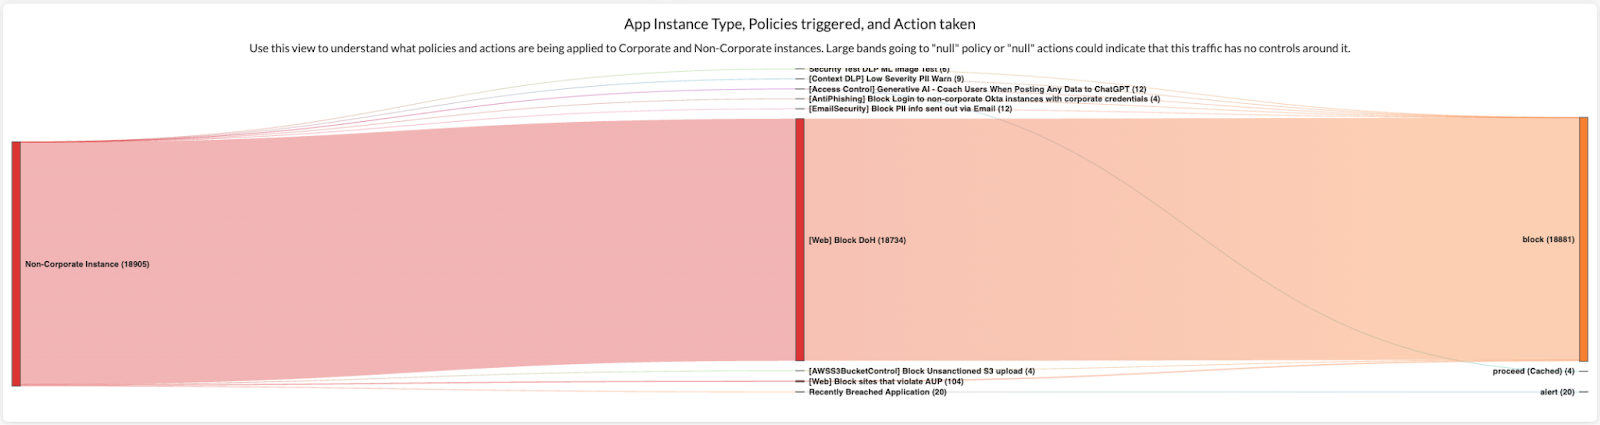
Q: How to monitor app instances using Advanced Analytics?
A: There are 2 recommended dashboards for instance monitoring. The App Instance Overview Dashboard focuses on uncovering non-corporate instances in your environment. The dashboard helps you monitor and investigate non-corporate/personal/unauthenticated app instance usage and the corresponding data movement, policy violations, & actions taken.
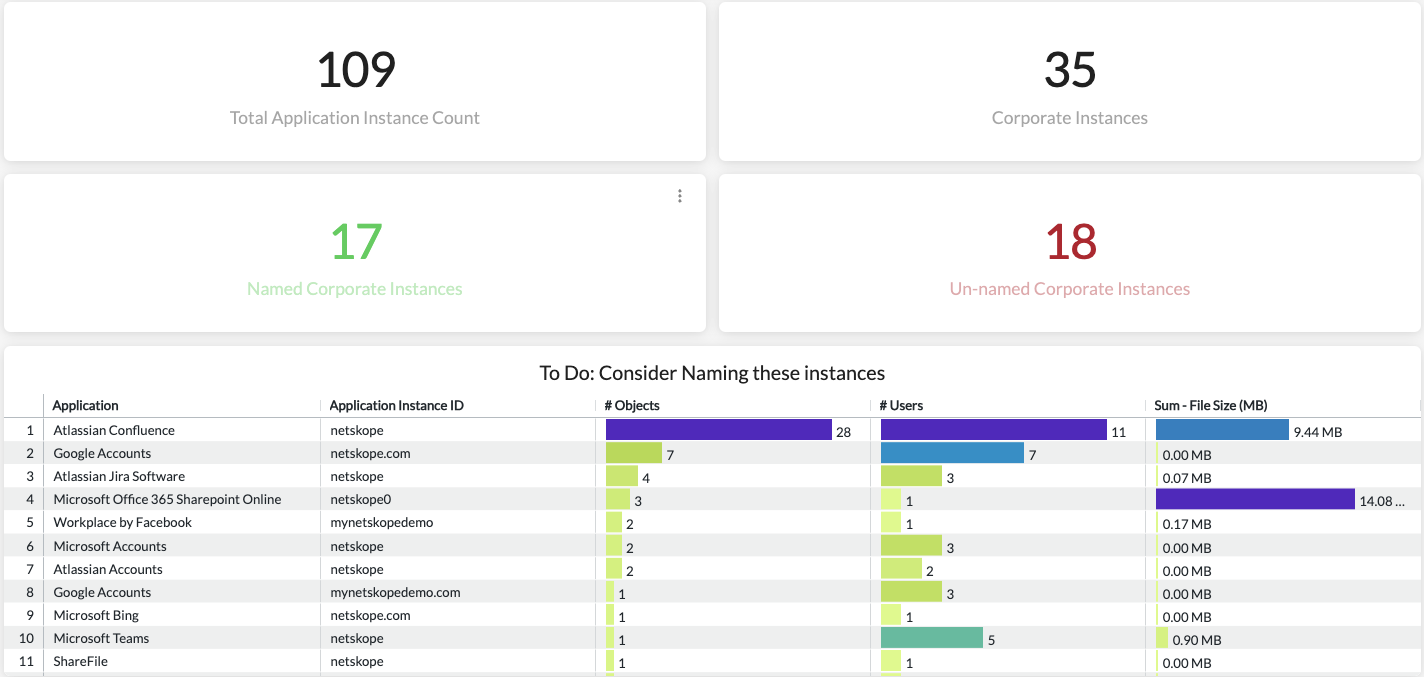
The other dashboard is the Tag Applications and Instances Dashboard that focuses on instance naming. Use this dashboard to identify unnamed app instances in your environment and name them through the Netskope UI.
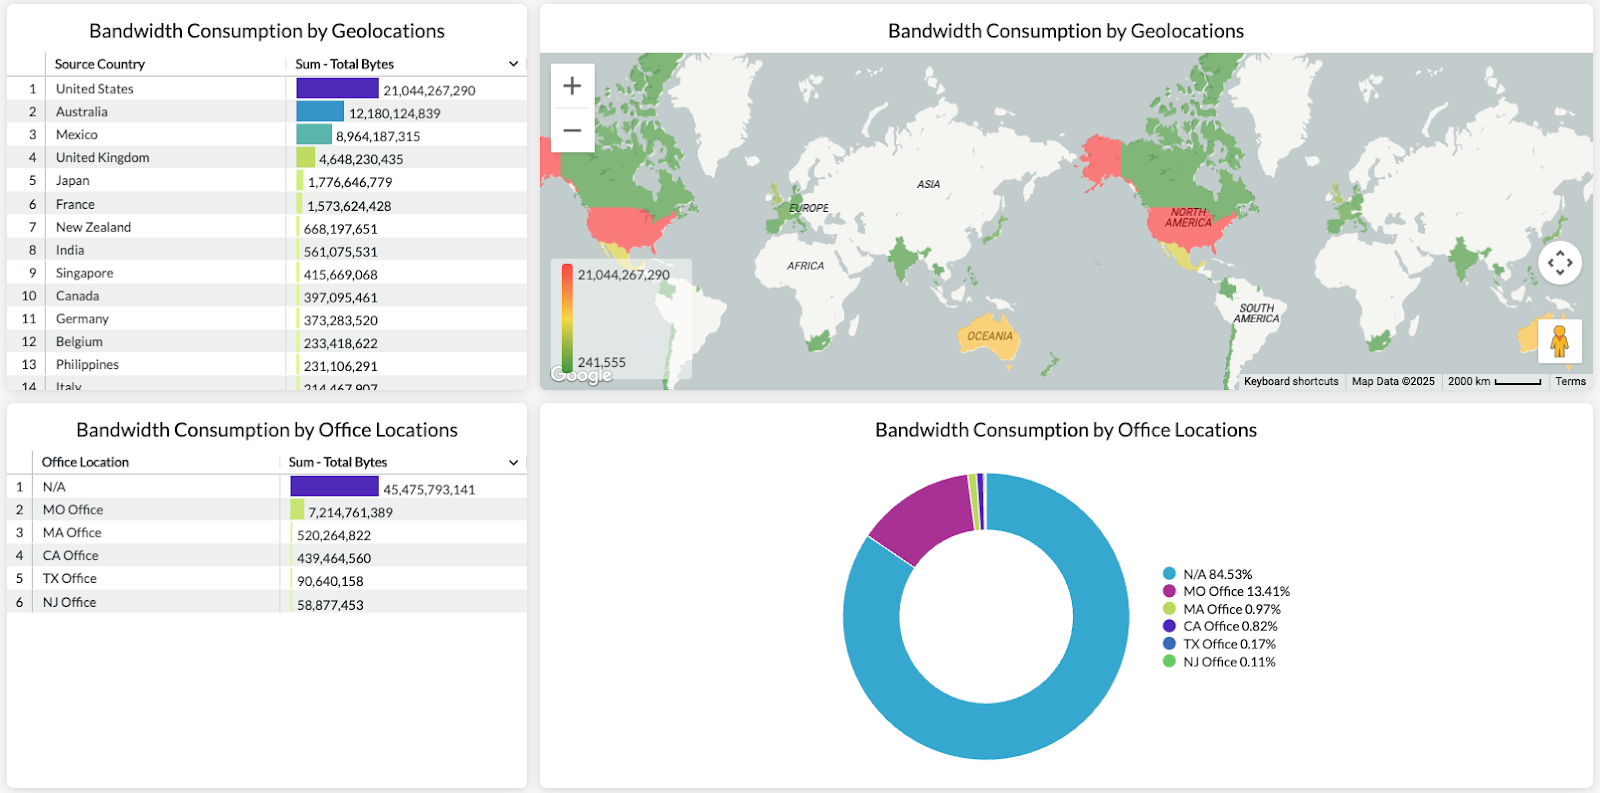
Q: How to generate an internet bandwidth utilization report using Advanced Analytics?
A: The Transaction Events data collection can help. Our Bandwidth Consumption Dashboard shows you how to monitor bandwidth usage in your environment using the Transaction Events data collection based on 3 trend use cases:
- Uncover malicious/suspicious sites with high bandwidth usage
- Monitor bandwidth usage by geolocation; avoid overusing your license in particular regions
- Monitor bandwidth usage by office locations; consider upgrading/adding internet circuits
Looking to better investigate bandwidth issues? Digital Experience Management (DEM) can help. Learn more about Netskope One DEM.
Q: What are the recommended dashboards for DLP policy violation monitoring? We’re also looking to surface false positive DLP incidents.
A: To measure your DLP policy effectiveness and identify policies that need to be tuned, we recommend starting with the DLP Policies Dashboard in Netskope Library. The dashboard provides visibility into DLP policies triggered, alerts generated, users triggering the alerts, and actions taken by the policies.
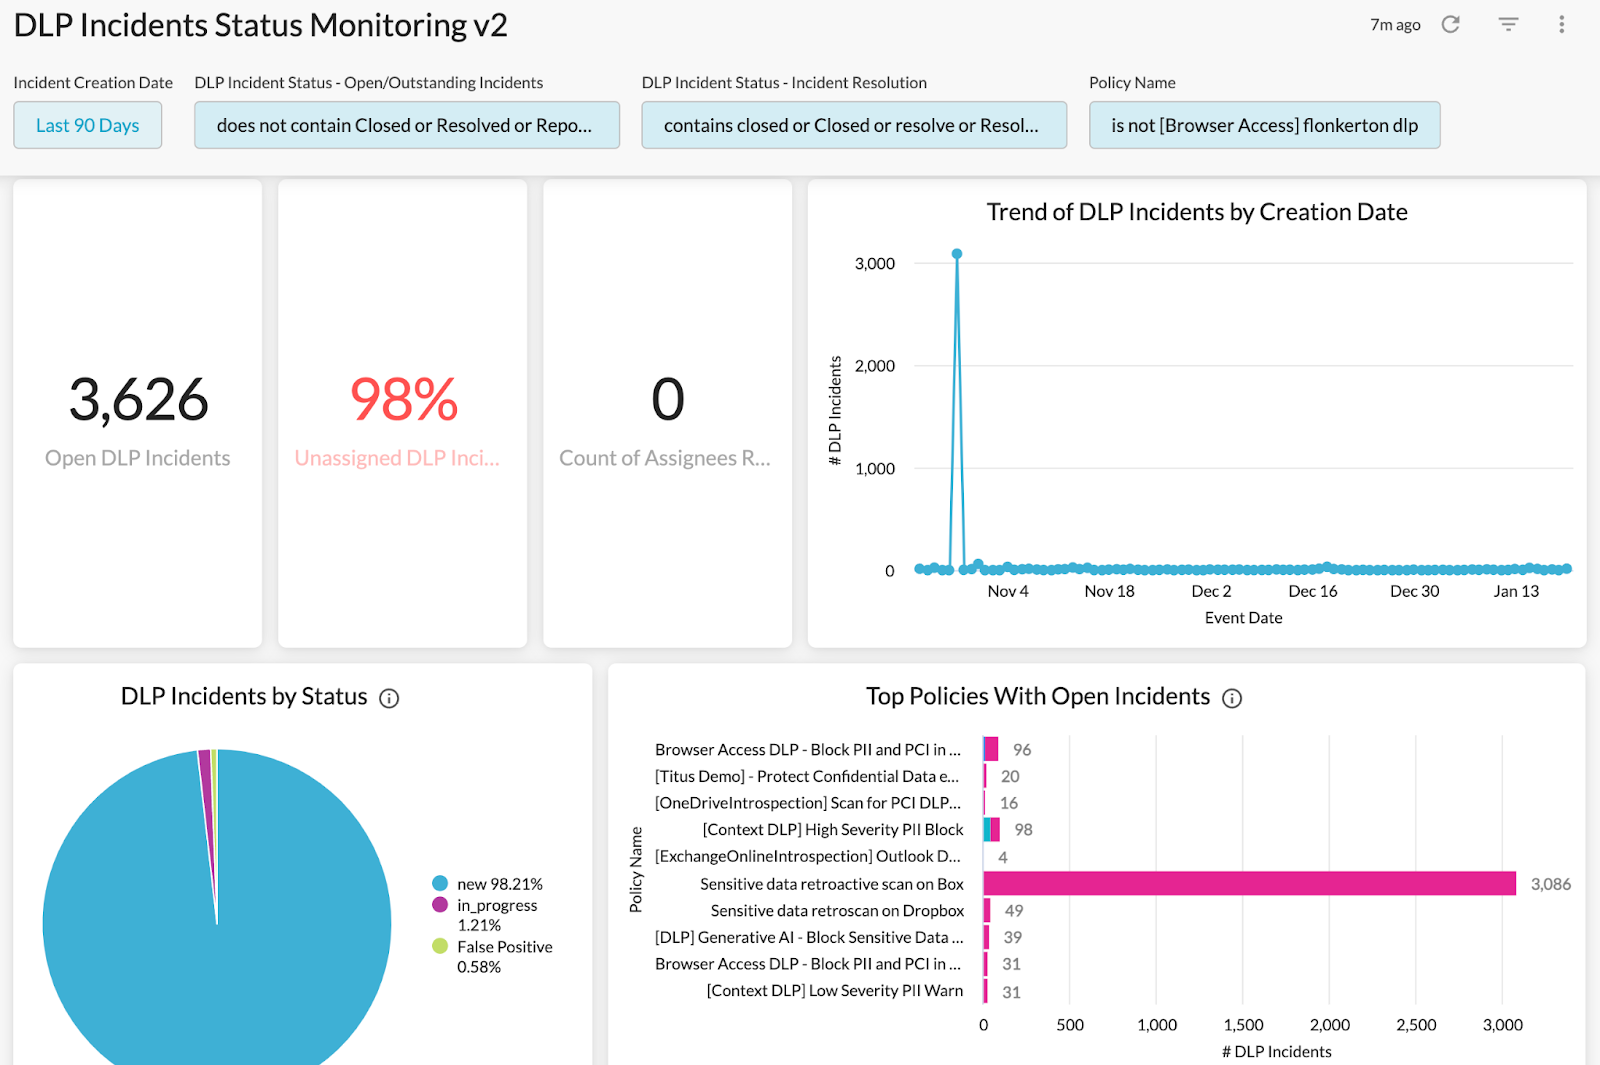
To investigate DLP incidents, the DLP Incidents Status Monitoring Dashboard is a great starting point. The dashboard provides granular visibility into the DLP incidents in your environment, including incident status, incident resolution time, and policy details. Use this dashboard to investigate DLP incidents and monitor the incident response progress in your organization.
Q: How to uncover shadow IT, especially risky app usage, in our organization?
A: The Application Risk Management Dashboard is a great starting point to uncover risky app usage. The dashboard helps you better understand:
- What risky & unmanaged apps are being used in your environment
- If there is any sensitive data movement to these risky & unmanaged apps
- If there are any non-corporate app instances in use and the corresponding user activities
Q: How to export data in Advanced Analytics?
A: There are multiple ways to export data in Advanced Analytics.
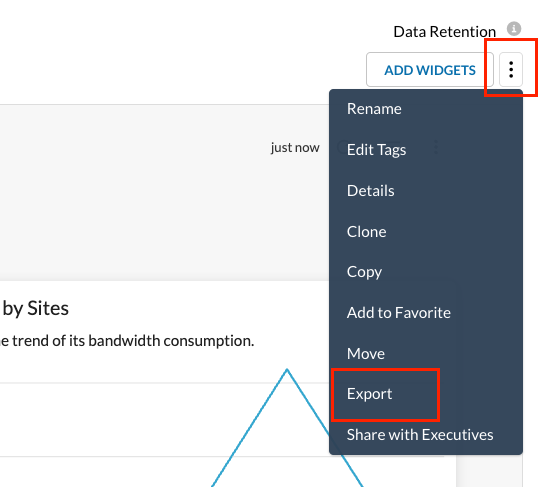
To export the entire dashboard, simply click the “Export” button. This allows you to export the dashboard template that can be imported to different tenants.
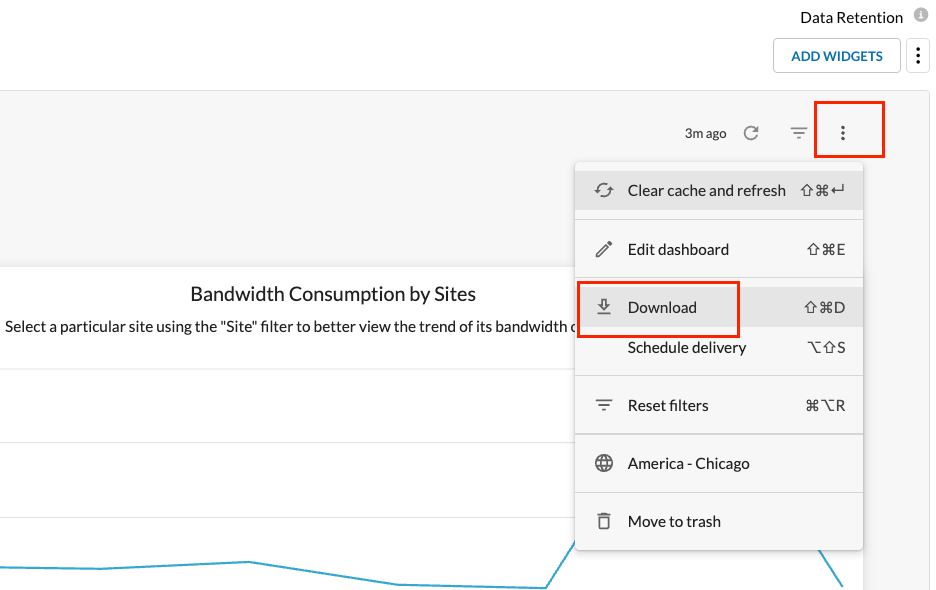
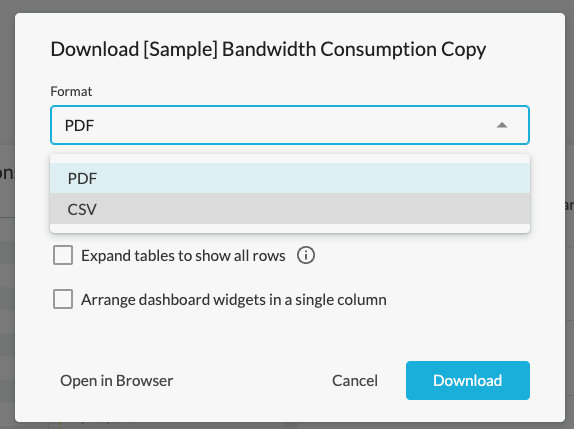
To export the dashboard as a CSV or PDF, the “Download” feature can help.
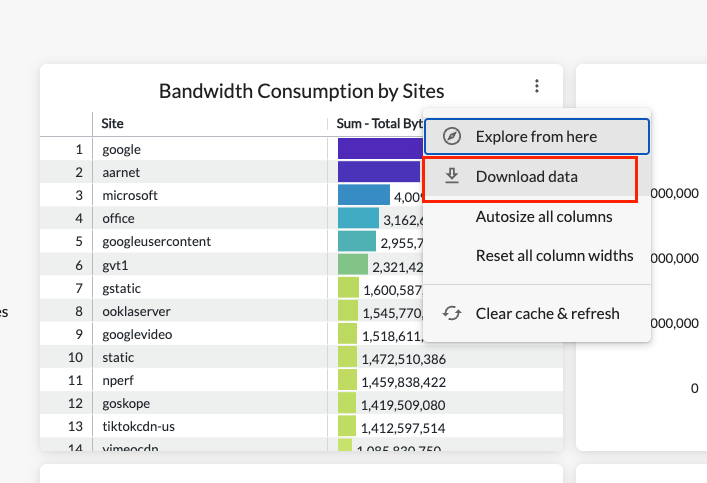
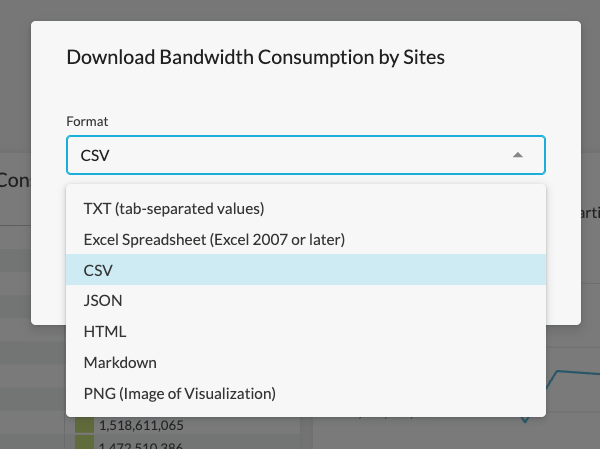
To export data from a particular widget, the “Download data” option can help. It allows you to export the data in multiple formats such as CSV, TXT, & PNG.
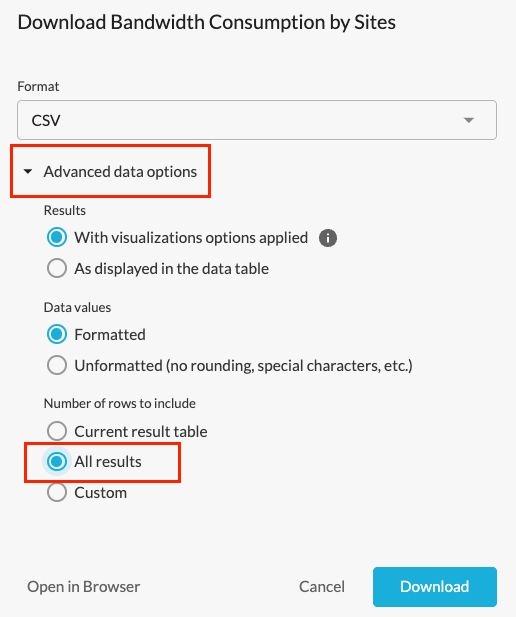
By expanding the “Advanced data options” list in the download menu, you can choose to download current results, all results, or custom results.
Q: How to get actionable insights into departing users in our organization?
A: The Employee Flight Risk Dashboard Dashboard is a great starting point. The dashboard predicts when employees are planning to leave the company based on multiple metrics, including:
- Visits to career sites
- Visits to competitor job sites
- Uploads of resume data to webmail
- Suspicious data movement from corporate to unsanctioned apps
- Bulk downloads of data to corporate apps
Looking to investigate suspicious activities from particular users? The User/Organization Unit Investigation Dashboard can help. This dashboard provides both high-level and detailed visibility into user activities, which helps you identify and monitor suspicious/risky user activities, e.g. corporate files uploaded to non-corporate instances, in your environment.
Q: How to monitor threat hunting using Advanced Analytics?
A: If you are looking to uncover cloud threats such as malware & malicious sites detected in your environment, the Threat Protection Dashboard is a great starting point. If you are interested in insider threats such as risky user behaviors & sensitive data movement, the Insider Threat Dashboard is a great option. Both dashboards can be found in Netskope Library.
Resources shared in the session
Netskope Community - Advanced Analytics: https://community.netskope.com/p/advanced-analytics
Training Resources Post: https://community.netskope.com/dashboard-gallery-38/advanced-analytics-training-resources-5713?tid=5713&fid=38
CASB Health Check Dashboard V2.7:
https://community.netskope.com/dashboard-gallery-38/casb-health-check-dashboard-6075
NG-SWG Health Check Dashboard V2.8:
https://community.netskope.com/dashboard-gallery-38/ng-swg-health-check-dashboard-6104
Security Health Check (Self-Service) Dashboard V2:
Application Risk Management Dashboard:
https://community.netskope.com/dashboard-gallery-38/application-risk-management-6132
Application Instance Overview Dashboard:
https://community.netskope.com/dashboard-gallery-38/application-instance-insights-5749
Tag Applications & Instances Dashboard:
https://community.netskope.com/dashboard-gallery-38/tag-your-applications-and-instances-5733
Bandwidth Consumption Dashboard:


