

Hello Folks,
Below you can find a recap of questions asked at the May office hours session and those sent in that we were not able to cover during the session. Feel free to comment and continue the discussion, as well as attend future sessions that can be found on the Community Events Calendar!
Q: I’d like to learn more about AI usage.
A: The AI Usage Dashboard can help. This dashboard shows the AI usage in your environment and helps you to see what, if any, controls are in place to control AI traffic. You can use the Application filter at the top of the dashboard to dive into a specific application.
The AI Usage with App Instances dashboard would also help. This dashboard provides additional visibility into the App Instances used to access AI Apps/Sites in the environment, which helps identify if the Corporate Instances are used for AI Usage.
Q: Is there info from Advanced Analytics that I can extract from SkopeIT events and web transaction logs?
A: Yes. Most of the data from Skope IT is synced to Advanced Analytics, which also integrates data from the DLP and UBA engines. Advanced Analytics provides a more visualizable and user-friendly interface compared to directly downloading all the data from Skope IT.
Q: How do you determine shared credentials?
A: Determining shared credentials involves detecting unauthorized sharing of user credentials that violate corporate security policies. By aggregating information and alerts for users sharing a specific credential into a single detection alert, the process enhances anomaly detection. In advanced UEBA, all users involved in the anomaly are assigned the same UCI deduction. This approach reduces the number of alerts requiring investigation, thus accelerating the investigation process and improving overall security efficiency. Check the link for additional information: Rule-Based Policies.
Q: How are compromised credentials detected?
A: Compromised credentials are detected through continuous monitoring of sources like hacker dump sites, where stolen usernames and passwords can be identified before they become publicly known. Since many users tend to reuse passwords across multiple applications, credentials compromised in unsanctioned apps can potentially expose accounts in your sanctioned apps. This highlights the importance of detecting and addressing compromised credentials promptly. The Netskope Compromised Credentials dashboard informs you about known compromised credentials for the accounts used by your employees.
Q: How to leverage the compromised credentials feature in threat protection?
A: To leverage this feature in threat protection, notify stakeholders, such as risk and compliance teams, as soon as compromised credentials are detected. Reset affected passwords and enhance security protocols to prevent unauthorized access. Monitor and control unauthorized applications and data sprawl to manage Shadow IT. Additionally, use the insights gained from detecting compromised credentials to strengthen overall security measures and prevent future breaches.
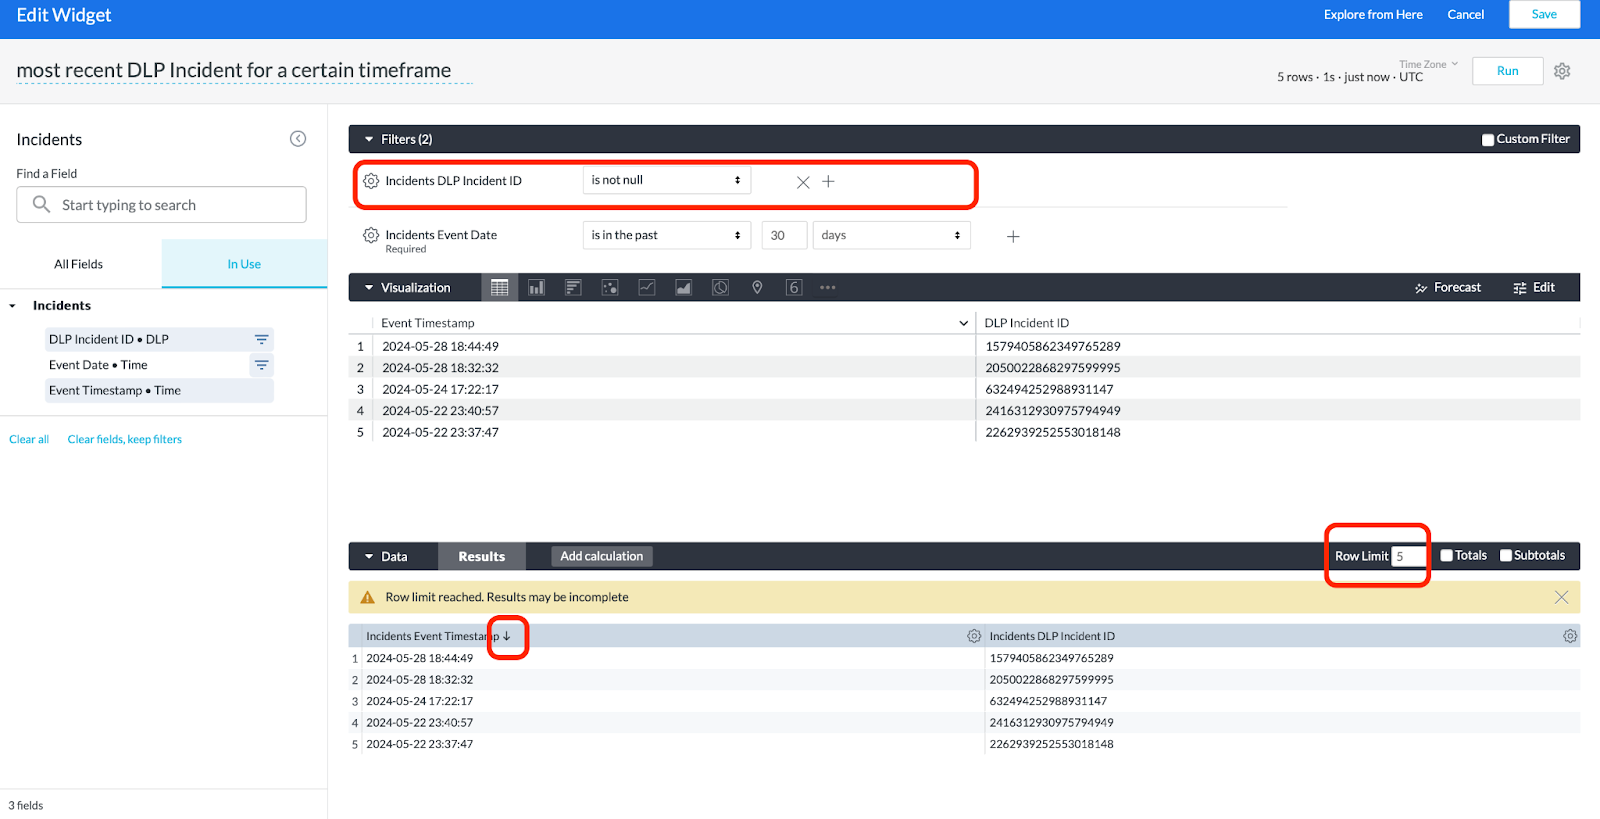
Q: In advanced analytics, is there a way to show just the most recent DLP Incident for a certain timeframe (e.g. 1 day) to help reduce the number of “duplicate/redundant events” we see?
A: Yes. After adding the DLP Incident ID and Event Timestamp columns, you can use the DLP Incident ID as a filter by selecting "is not null." This ensures that all entries have a corresponding Event Timestamp with a non-null DLP Incident ID. Next, sort the entries by Event Timestamp to view the most recent DLP Incident IDs. Adjust the row limit to eliminate any redundant data.
Q: Is there a time lag between when a DLP incident is triggered and when it shows up in Advanced Analytics? I have a scheduled report that sends me an email report of all DLP incidents triggered in the last 6 hours however sometimes I notice afterwards that DLP incidents triggered in the last 1-2 hours may be missing.
A: Yes, there is a time lag between when a DLP incident is triggered and when it appears in Advanced Analytics. This delay is typically because Advanced Analytics relies on a GCP database that processes data in batch jobs, which runs every hour. As a result, DLP incidents may take at least an hour to show up in a dashboard. Therefore, incidents triggered within the last 1-2 hours might not be displayed in your scheduled reports.
Q: How to get web transaction data pulled from a user into here?
A: In Advanced Analytics, we collect data such as page events and transaction events, which can be used to view web traffic. A great example of utilizing this data is the SSL Inspection Dashboard in Netskope library. This dashboard can help you explore SSL traffic inspected vs. bypassed in your organization. For more information, you can take a look at this article in Advanced Analytics Knowledge Portal: Advanced Analytics Transaction Events.
Q: I keep seeing duplicate data. How can I get rid of the redundancy?
A: There are a couple of scenarios to consider.
Case 1: Sometimes, including a Timestamp field in the columns can cause duplications. In such cases, try removing the Timestamp field from your analysis.
Case 2: If duplications are arising due to including both CCI Application Category and Other Category in the columns, you can use the Aggregate feature to create a list of unique values.
Links shared in the session:
Training Resources Post:
Updated AI Usage Dashboard:
https://community.netskope.com/dashboard-gallery-38/ai-usage-with-app-instances-5724
Application Risk Management Dashboard: https://community.netskope.com/dashboard-gallery-38/application-risk-management-6132
CASB Health Check Dashboard:
NG-SWG Health Check Dashboard:
https://community.netskope.com/dashboard-gallery-38/updated-ng-swg-health-check-dashboard-6104
E.g. Transaction Event Fields Intro:
Enhanced Report Intro:
Employee Flight Risk Dashboard:
https://community.netskope.com/dashboard-gallery-38/employee-flight-risk-dashboard-6157


