


Hello Folks,
Below you can find a recap of the topics discussed during the September Advanced Analytics office hours and those sent in that we were not able to cover in the session. Feel free to comment and continue the discussion, as well as attend our future sessions that can be found from the Community Events Calendar!
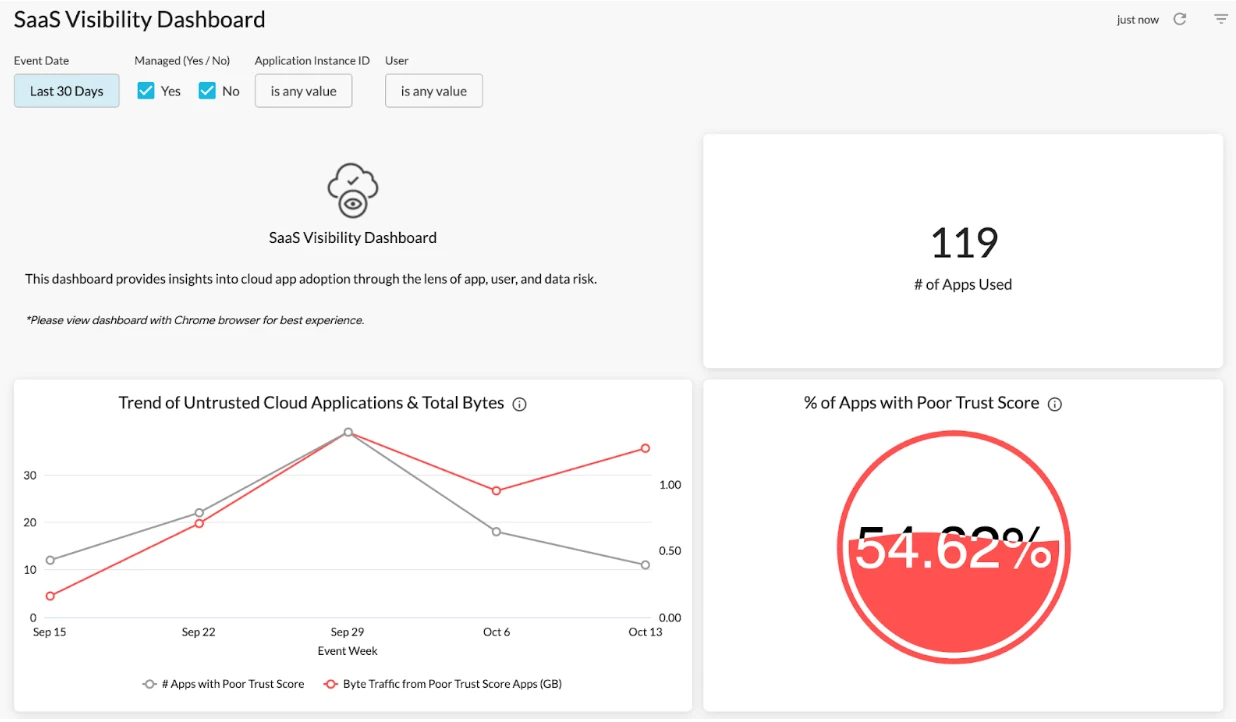
Q: Is there a dashboard to monitor SaaS app usage and identify suspicious data movement or data leak?
A: For overall SaaS app usage, the SaaS Visibility Dashboard in Netskope Library is a great starting point. It provides insights into SaaS app adoption through the lens of app, user, & data risk. Use this dashboard to monitor risky apps being used, suspicious data movement to non-corporate instances, and user identities detected.
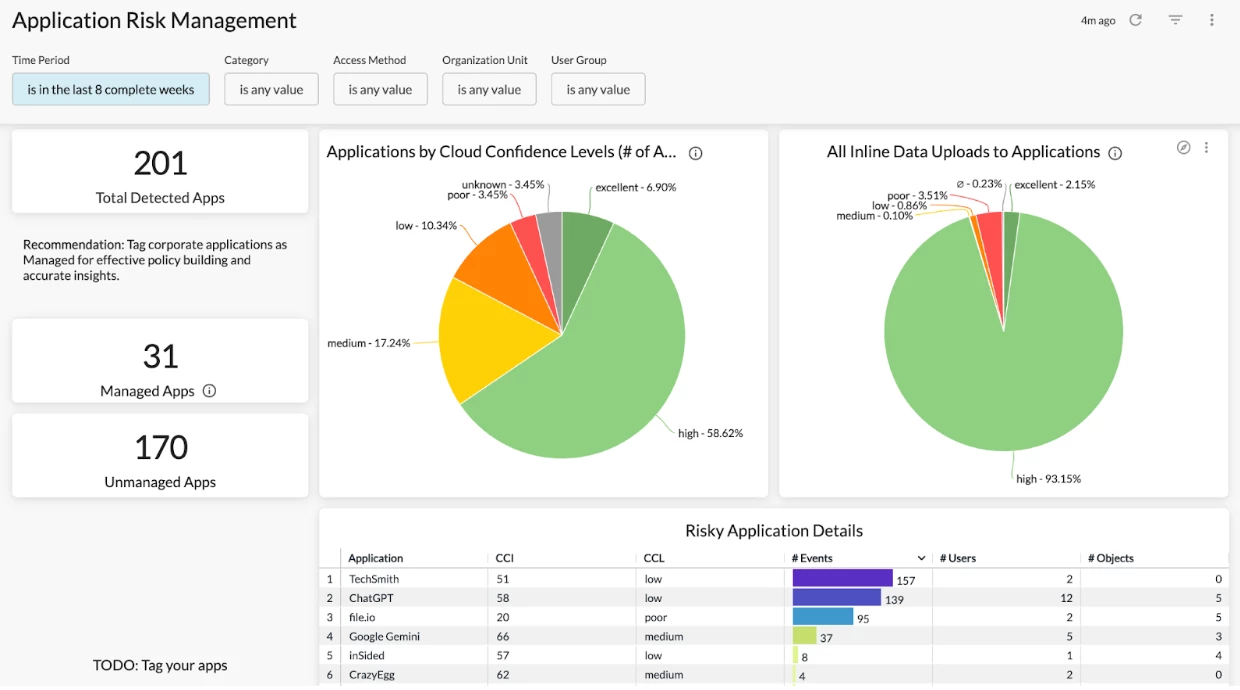
If you are looking to drill into suspicious/risky SaaS app usage, the Application Risk Management Dashboard is a great option. This dashboard helps you better understand:
- What risky & unmanaged apps are being used in your environment
- If there is any sensitive data movement to these risky & unmanaged apps
- If there are any unsanctioned or non-corporate app instances in use and the corresponding user activities
Q: How to investigate risky user behaviors in our environment?
A: If you are not sure where to start your investigation and are looking for indicators of suspicious user behaviors, the User Behavior Analytics (UBA) Dashboard is a good starting point. The dashboard helps you monitor anomalous user behaviors, e.g. shared credentials, in your environment by providing high-level overviews of the UBA alerts triggered and detailed visibility into each UBA alert type.
If you are looking for comprehensive visibility into risky user behaviors, the User/Organization Unit Investigation Dashboard will be a great option. This dashboard provides both high-level and detailed visibility into user activities from 3 dimensions: cloud app usage, DLP policy violations, & web traffic. Use this dashboard to identify and monitor suspicious/risky user activities, e.g. PCI files uploaded through non-corporate instances, in your environment.
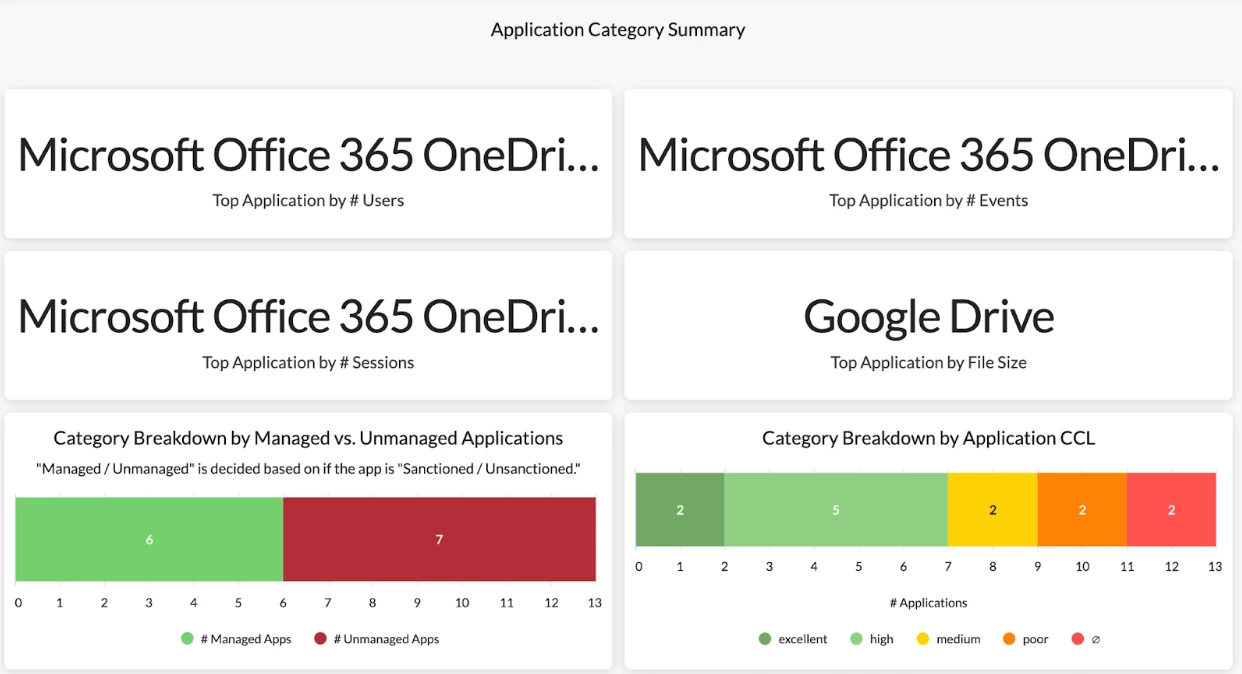
Q: Is there a dashboard to monitor cloud app usage by app categories?
A: The Application Category Dashboard in Netskope Library is a good starting point. This dashboard provides detailed visibility into application usage by different categories in your environment, including:
- Top used applications in each category, both managed and unmanaged
- Risky application usage and data movement
- Application instance awareness
- Policies and alerts triggered by applications in each category.
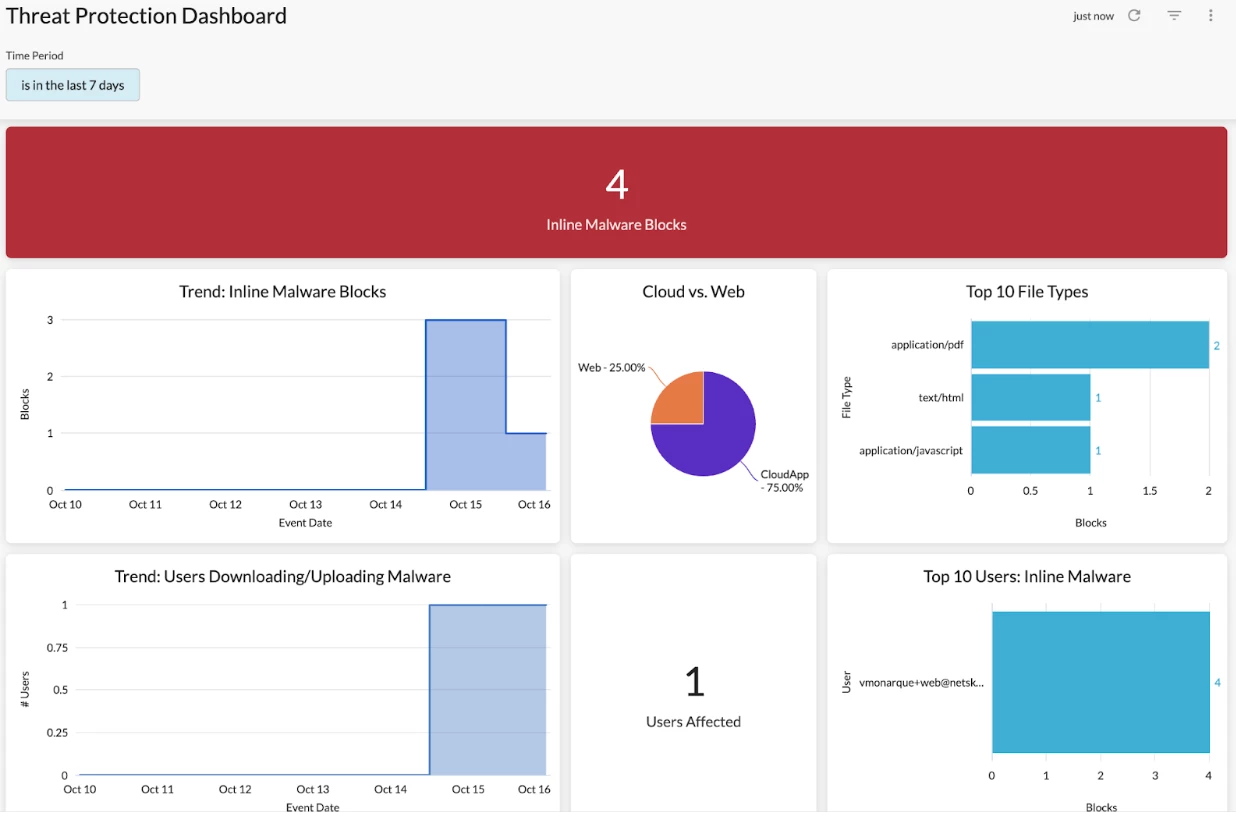
Q: What data fields are recommended for cyber attack detection? Any existing dashboards?
A: We recommend starting with the Alerts data collection since it provides explicit visibility into cyber attacks detected by your real-time protection policies such as malware, malicious sites, & compromised credentials. The Threat Protection Dashboard in Netskope Library is a great starting point.
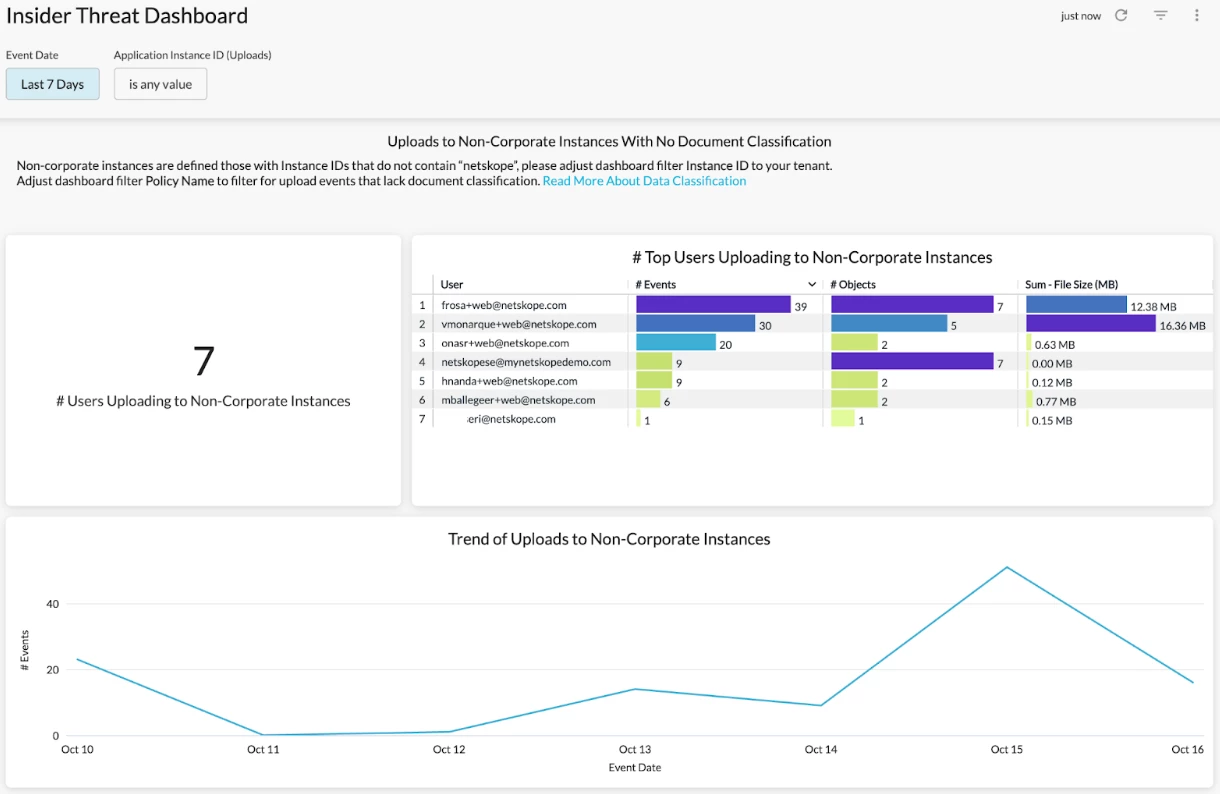
If you are interested in insider threat, e.g. intentional risky behaviors, the Insider Threat Dashboard is a great option.
Q: We’re trying to gauge app license usage in our organization. Can Advanced Analytics help us identify unused/dormant apps?
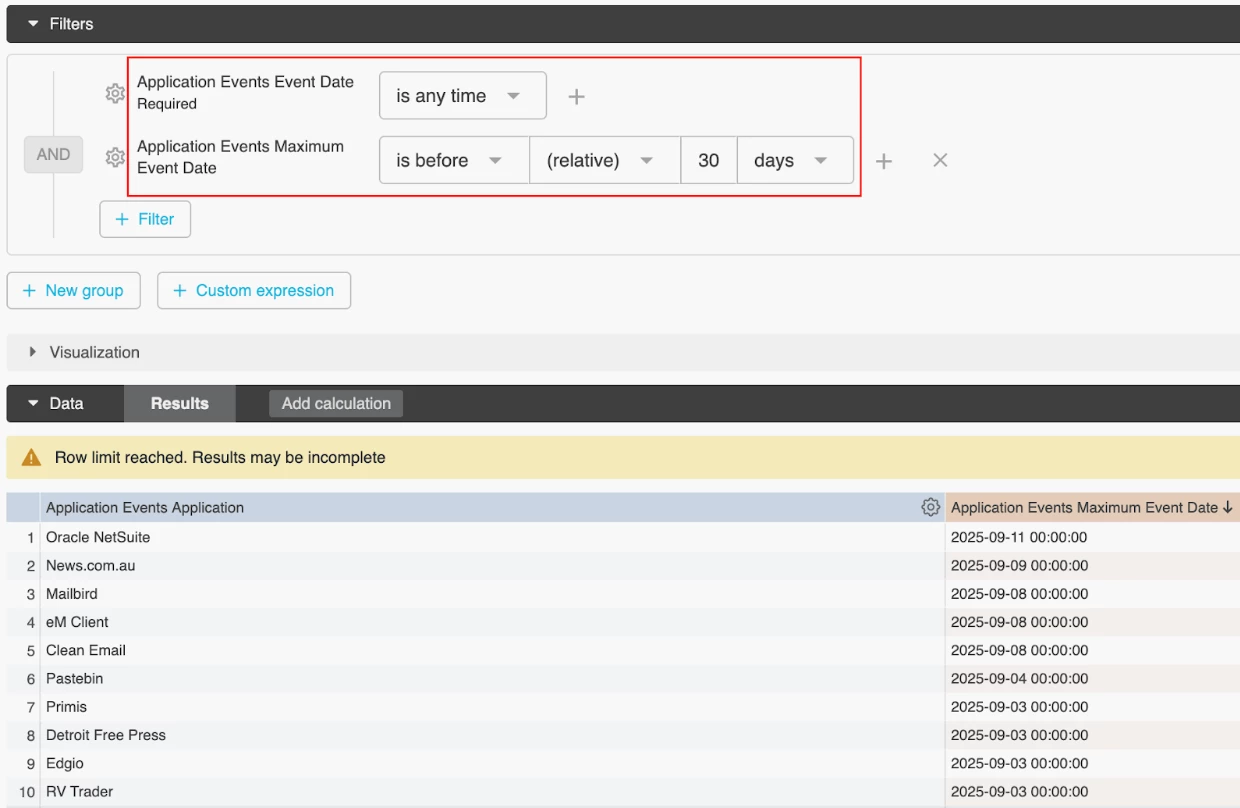
A: Yes. Let’s start with a sample use case: “how to identify apps that were not used in the last 30 days?” The “Maximum Event Date” field can help. This field indicates the “last seen” date of each app detected. By applying this field as a filter “Maximum Event Date is before 30 days” (“last seen” date is before 30 days ago), apps that were not used in the last 30 days will be returned. Don’t forget to change the default “Event Date” filter to “is any time,” otherwise a query error will show up.
Q: Looking to learn more about merging data in Advanced Analytics.
A: Merge Query allows you to merge data from different data collections. Step by step instructions can be found in this case study.
Q: What are the recommended dashboards to monitor security issues/concerns on a weekly basis?
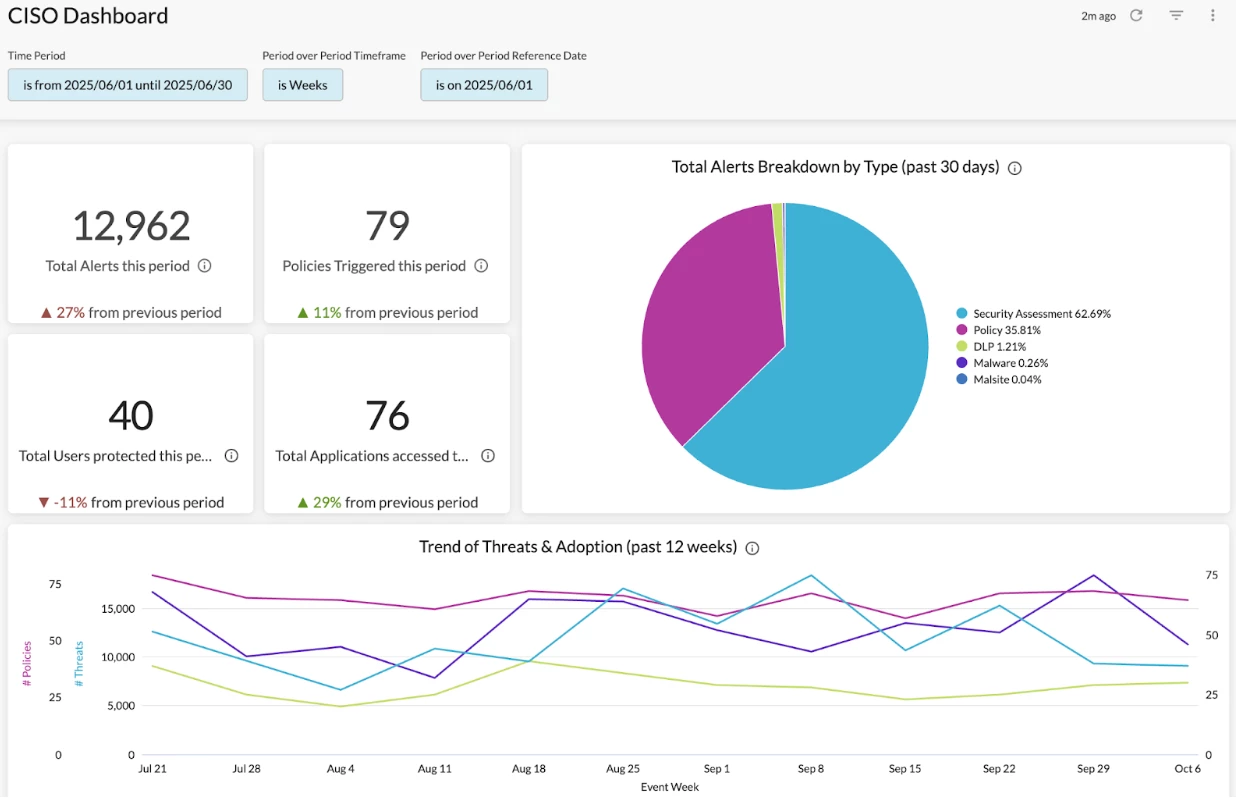
A: The CISO Dashboard in Netskope Library is a great option. This dashboard provides high-level visibility into security concerns in your environment, including overall policy violations, threat alerts, DLP alerts, blocked traffic, & risky app usage. The period-over-period comparison allows you to easily monitor how the alert data is changing week over week.
Resources Shared in the Session
Netskope Community - Advanced Analytics: https://community.netskope.com/p/advanced-analytics
Training Resources Post: https://community.netskope.com/dashboard-gallery-38/advanced-analytics-training-resources-5713?tid=5713&fid=38
Application Risk Management Dashboard:
https://community.netskope.com/dashboard-gallery-38/application-risk-management-6132
Application Instance Overview Dashboard:
User/Organization Unit Investigation Dashboard:
Case Study - Merge Query:
https://community.netskope.com/discussions-37/case-study-merge-query-8104
Data Flow Investigation Dashboard V2:
https://community.netskope.com/dashboard-gallery-38/data-flow-investigation-dashboard-v2-7986
Data Flow Investigation Dashboard V2 - Control & Monitor:


