



The Netskope Client Log Bundle
When a user reports that “the internet is slow,” an app won’t load, or the Netskope Client shows a red dot, the Netskope Client log bundle is usually the most reliable way to find out why. It’s one ZIP file, saved from the Netskope Client’s “Save Logs” option or collected remotely from the tenant, that shows what the Client was doing on that endpoint. The core debug logs (nsdebuglog.log and its rolled-over nsdebuglog_old.log) show which traffic was tunneled and which was bypassed, whether the tunnel to the Netskope data plane came up, and why the Client picked a particular POP. That last point often explains unexpected latency or routing to a distant data center. Around these sit nsconfig.json and nsbypass.json, which confirm the configuration and bypass list the tenant actually pushed to the device, so you can quickly rule misconfiguration in or out. npadebuglog.log shows the private apps, ports, DNS settings and publishers delivered for NPA, and processInfo.log can reveal conflicts with antivirus or other security software running on the same machine. If inner and outer packet captures were taken during the issue, they’re included in the bundle too. Together, these files let admins work through the most common Client problems: connectivity and performance slowdowns, steering and bypass misconfigurations, private access failures, deployment and enrollment issues, and software conflicts. The catch is timing. The Client uses circular logging to keep a small footprint, so on a busy machine the evidence can be overwritten quickly.
The Hidden Cost of Manual Log Collection and Analysis
Anyone who has supported the Netskope Client knows that getting the log bundle is sometimes harder than reading it. A typical manual collection goes like this. The user raises a ticket. The admin replies and asks for logs. The user may not know where the Netskope Client icon is, or that “Save Logs” exists. Even after finding it, they have to choose a save location, name the file, find it again and attach it to the ticket, usually hours later or the next day. If the Client has crashed, the tray icon may not be available at all, and the user has to dig the logs out of hidden system folders. Every round trip costs time, and because the Client uses circular logging, the evidence can be overwritten while everyone waits. The admin often has to ask the user to reproduce the issue and start over. Multiply that by dozens of tickets a week and log collection becomes one of the biggest drains on a support team’s time. The automation in this blog removes the user from that loop. An admin runs one Slack command with the ticket number, and the workflow does the rest. It validates the ticket, confirms it’s a Netskope Client issue, finds the reporter’s device in the asset inventory, and calls the Netskope REST API to trigger log collection on that endpoint remotely. When the bundle is ready, the workflow downloads it, attaches it directly to the ticket and confirms back in Slack. The user doesn’t have to click anything, the admin doesn’t have to chase anyone, and the logs are captured while the issue is still fresh.
Getting the bundle is only half the battle. A single bundle can hold thousands of lines across nsdebuglog.log, nsdebuglog_old.log, npadebuglog.log, nsconfig.json, nsbypass.json and more. The relevant clue, such as a failed tunnel handshake, an unexpected bypass, a gateway fallback, a publisher that isn’t reachable or a competing security agent, may be one line buried in that noise. Finding it means knowing which file to open, which keywords to search for, how to match timestamps against when the user saw the problem, and how to compare the active configuration with what the tenant intended. That expertise takes time to build and often sits with a few senior engineers. Even for them, a thorough review of one bundle can take 30 minutes or more. This workflow hands the first pass to AI. Once the bundle is attached, it’s sent to Claude along with the ticket’s description and the user’s comments, so the model sees both the symptoms and the evidence. Claude acts as a Netskope support expert. It reads the bundle against the user’s complaint, identifies the likely root causes, explains the reasoning behind each one and suggests a fix. The analysis is posted back to the ticket, so admins start with a short list of likely causes instead of a blank screen and a 50 MB ZIP file. Engineers still make the final call, but triage drops from tens of minutes to a few, and newer team members get expert-level guidance from day one.
The Technical Stack
- Tines: Runs the whole automation. Webhook, Trigger, HTTP Request, Event Transformation and Record actions handle each step, store state between them and keep credentials secure.
- Tines Email Webhook: Receives the “logs ready” email from Netskope, which tells the workflow that the bundle can be downloaded.
- Tines Records: Saves the ticket, user and hostname while log collection runs in the background, so the bundle is matched to the right ticket when it arrives.
- Slack: Where the admin starts the workflow, using a slash command with the ticket number. It also receives status updates, errors and the final notification.
- Jira Service Management: The ticketing platform where users raise Netskope Client issues. It provides the ticket details, user comments and the linked device (through JSM Assets), and stores the collected log bundle as an attachment and the AI analysis as an internal comment.
- Netskope REST API: Gets the user’s Client details, remotely triggers log collection on the endpoint and downloads the log bundle once it’s ready. The automation needs a v1 API token (for clients and userconfig) and a v2 API token with access to the following endpoints:
- /devices/support/update
- /devices/getclientlogs
- Anthropic Claude (Files and Messages API): Analyzes the log bundle alongside the ticket description and comments, and returns likely root causes with suggested fixes.
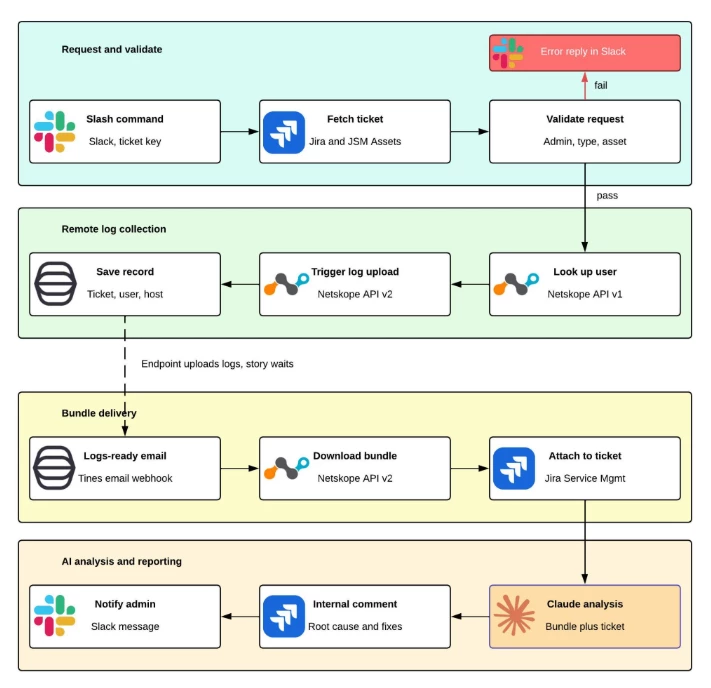
Visualizing the Automation
Automation in Action
- The user raises a ticket. The user opens a ticket in Jira Service Management (or any ticketing platform) about a Netskope Client issue. They select Netskope Client as the issue category and link their device as an asset on the ticket. The user and asset details can be obtained from the ticket. If your ticketing platform does not support having ‘Affected asset’ details, you can use the user’s email address to look up their devices with the following Netskope API:
POST https://{NETSKOPE_TENANT}/api/v1/clients?token={API_V1_TOKEN}&query=user%20eq%20%27{USER_EMAIL_ADDRESS}%27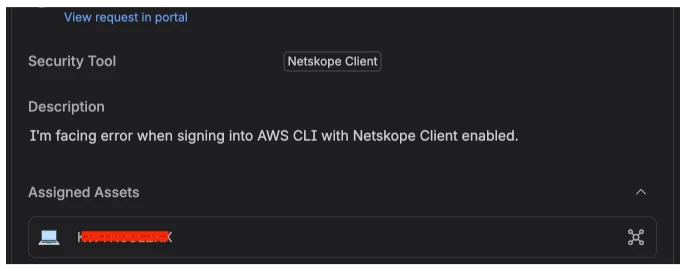
- The admin starts the analysis from Slack. After reviewing the ticket, the admin runs a Slack slash command with the ticket number (e.g. /collectlogs TKT-12345). The command sends the request to a Tines webhook, which starts the automation.

- The automation validates the request. It first checks that the person who ran the command is an authorized admin, and that the ticket number is in the right format. It then pulls the ticket from Jira and confirms the ticket category is Netskope Client. If any check fails, the automation stops and sends the requester an error message in Slack, such as “Unauthorized user,” “Invalid ticket number” or “This ticket is not a Netskope Client issue.”
- The automation identifies the user’s device. It reads the asset linked to the ticket from JSM Assets to get the device’s hostname. It also takes the reporter’s email from the ticket. If no asset is linked, the admin gets a “No asset found” error in Slack. Follow the procedure mentioned in Step 1 to obtain device details from Netskope using a user’s email.
GET https://api.atlassian.com/jsm/assets/workspace/{WORKSPACE_ID}/v1/object/{OBJECT_ID} - The automation looks up the user in Netskope. Using the reporter’s email, it calls the Netskope REST API to get the user’s Client UserKey and enrolled device details, which the log collection request needs.
POST https://{NETSKOPE_TENANT}/api/v1/userconfig?token={API_V1_TOKEN}&email={USER_EMAIL_ADDRESS}&configtype=agent - The automation triggers remote log collection. It calls the Netskope API to request a log bundle from that user’s device. The notification email address in the request is set to a Tines email webhook, so the automation is told when the logs are ready. The ticket number, user email and hostname are saved as a Tines Record, and the admin gets a Slack message saying collection has started.
POST https://{NETSKOPE_TENANT}/api/v2/devices/support/update

HEADERS:
Authorization: Bearer {API_V2_TOKEN}
accept: application/json

PAYLOAD:
{
  "userid": "USER_EMAIL",
  "userkey": "USERKEY_FROM_STEP_5",
  "hostname": "HOSTNAME",
  "log_status": 1,
  "admin_user_email": "EMAIL_ADDRESS_OF_MONITORED_INBOX"
} - The Netskope Client uploads its logs. The Netskope Client on the endpoint picks up the request the next time it checks in with the tenant, gathers its logs and uploads the bundle. The user doesn’t have to do anything.
- Netskope reports that the logs are ready. Netskope sends a “logs ready” email to the Tines email address. The automation pulls the user email and hostname out of the email and matches them to the saved Record to find the right ticket.
- The automation downloads the log bundle. It calls the Netskope API to download the bundle (as base64) and decodes it back into the original ZIP file.
POST https://{NETSKOPE_TENANT}/api/v2/devices/getclientlogs

HEADERS:
X-ExperimentalApi: opt-in
accept: application/zip
Authorization: Bearer {API_V2_TOKEN}

PAYLOAD:
{
  "orgkey": "ORGKEY_FROM_TENANT_WEBUI",
  "email": "USER_EMAIL_ADDRESS",
  "host": "HOSTNAME"
} - The automation attaches the bundle to the ticket. It uploads the bundle to Jira and attaches it to the original ticket, so it’s in one place for anyone working the case. The admin gets a Slack confirmation.
- Claude analyzes the logs. The automation collects the ticket’s description and all user comments, and sends them to Claude with the log bundle. Claude is instructed to act as a Netskope support expert: compare the logs against the user’s complaint, identify the likely root causes and suggest a fix for each. Use the ‘id’ returned by the Files API as {ATTACHMENT_ID} in the Messages API call.
POST https://api.anthropic.com/v1/files

HEADERS:
x-api-key: {ANTHROPIC_API_KEY}
anthropic-version: 2023-06-01

PAYLOAD: (multipart/form-data)
file: {DECODED_LOG_BUNDLE}.zip
POST https://api.anthropic.com/v1/messages
HEADERS:
anthropic-version: 2023-06-01
x-api-key: {ANTHROPIC_API_KEY}
content-type: application/json
TIMEOUT: 1000 seconds
PAYLOAD:
{
"model": "claude-sonnet-5-5",
"max_tokens": 125000,
"system": "You are a Netskope Support Expert and your role is to analyze the Netskope Log bundle obtained from users who are having trouble with their Netskope Client. You will receive the Jira ticket description and comments by users along with the log bundle. Using the data given, interpret the log bundle and find out what is the root cause for the user’s issue. Since this is an API call, remember that the admin cannot interact with you, so only provide responses. Give clear points on all possible reasons for the Client problem along with a clear explanation and provide a potential solution for each.",
"messages": [
{
"role": "user",
"content": [
{
"type": "text",
"text": "Description: {ADD_DESCRIPTION_HERE}\n Comments: {ADD_COMMENTS_HERE}"
},
{
"type": "container_upload",
"file_id": "{ATTACHMENT_ID}"
}
]
}
],
"tools": [
{
"type": "code_execution_20250825",
"name": "code_execution"
}
]
} - The results are posted back. Claude’s analysis is added to the ticket as an internal comment that only support staff can see. A final Slack message tells the admin the analysis is ready to review.
Conclusion
Troubleshooting the Netskope Client doesn’t have to mean chasing users for log files or spending an hour digging through nsdebuglog.log. This automation combines Tines, Jira, the Netskope REST API and Claude, so collecting and analyzing logs takes one Slack command. Logs are captured while the issue is still fresh, attached to the right ticket automatically and returned with a first-pass analysis of likely root causes and suggested fixes. Admins spend less time on routine work and more on solving problems, and users get faster resolutions without lifting a finger. The workflow is modular, so you can adapt it to your own ticketing platform, chat tool or AI model. Try it in your environment, make it your own, and share your improvements with the community.