


Hello Folks,
Below you can find a recap of the topics discussed during the June Advanced Analytics office hours and those sent in that we were not able to cover in the session. Feel free to comment and continue the discussion, as well as attend our future sessions that can be found from the Community Events Calendar!
Q: What visibility does Advanced Analytics provide into generative AI application usage (e.g., data being sent to AI tools)?
A: To monitor overall AI usage and uncover risky user activities, the AI Usage Dashboard in Netskope Library is a great starting point. The dashboard provides comprehensive visibility into AI app usage and site visits in your environment. Key metrics include AI app overview & usage trend, detailed user activities, instance awareness, policy actions, and web traffic generated in AI sites.
Q: How to monitor security posture and risk exposure for unvetted AI apps in use?
A: The AI Usage Dashboard mentioned above also works here. By applying the filter “Sanctioned = No,” we can customize the dashboard with a focus on unvetted/unsanctioned AI apps only.
If you are looking to gauge overall AI risk in your environment, the AI Risk Assessment Dashboard in Netskope Library is a great option. This dashboard helps you understand how “risky” your AI usage is based on our AI application risk attributes.
Q: How to create a custom DLP report with App Instance visibility?
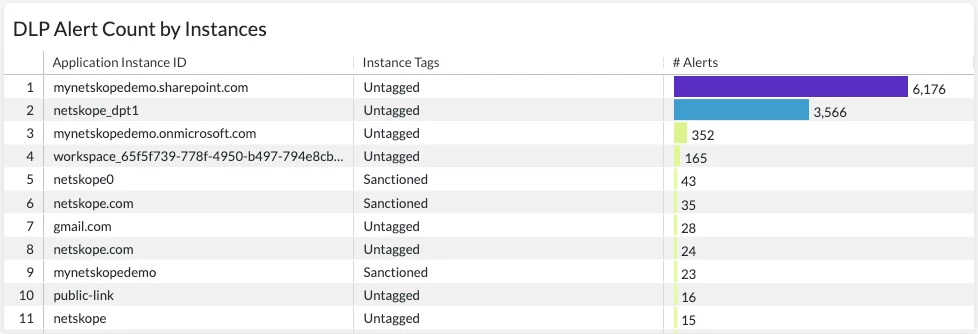
A: For DLP related use cases, the DLP Policies Dashboard in Netskope Library is a great starting point. The dashboard provides visibility into DLP policies triggered, alerts generated, users triggering the alerts, and actions taken by the policies.
We can leverage the "Instance ID” and "Instance Tag” fields to expand the dashboard with instance visibility. For example, the sample widget below shows the DLP alert count by Instance ID and Tag, which helps us understand if these alerts are triggered in corporate vs. non-corporate and sanctioned vs. unsanctioned/untagged instances.
Q: We’re looking to understand how many sessions and users are connected to NPA per publisher.
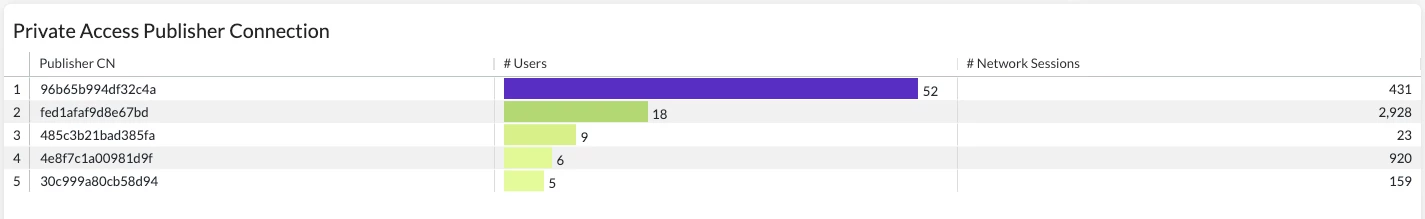
A: The Private Application Overview Dashboard in Netskope Library is a great starting point. The dashboard helps you monitor NPA usage in your environment by providing visibility into private apps detected, user info, publisher usage, traffic volume, and policies triggered.
We can customize the “Private Access Publisher Usage by Bytes” widget with “# Users” and “# Network Sessions” to understand how many users and sessions are connected to NPA for each publisher.
Q: We’re looking for some guidance about optimizing filters for Advanced Analytics.
A: There are two types of filters in Advanced Analytics: dashboard level filters and widget level filters. These two types of filters can exist at the same time, but dashboard level filters always take precedence over widget level filters. More details about filters can be found in this video.
Q: It's sometimes hard to understand what's the issue and how to fix it when troubleshooting an error in Advanced Analytics.
A: Typically, there are 4 types of errors in Advanced Analytics: incompatible data, incompatible visual type, query error, and server/platform error. This article will walk you through more details about these errors and how to resolve them.
Q: Can Advanced Analytics address insider threat use cases?
A: Yes, we recommend starting with the Insider Threat Dashboard in Netskope Library. The dashboard highlights top risky/suspicious users based on 3 typical insider threat metrics:
- Intentional Risky Behaviors: uploads to non-corp instances and behavior analytics alerts
- Potential Data Loss: coaching policy actions and DLP policy violations
- Cloud Threats: malware, malicious sites, and compromised credentials
Q: How to monitor data movement with geolocation visibility?
A: Our Data Flow Investigation Dashboard V2 can help. The dashboard provides both high-level and granular visibility into the data movement in your environment from 3 dimensions: geolocation data flow (web transaction), cloud application data flow (app events), and endpoint data flow (endpoint traffic).
Together with this, we also provide a supplemental Control & Monitor Dashboard that helps you monitor sensitive data movement in your environment and better understand how Netskope DLP is controlling the sensitive data movement.
Resources:
Netskope Community - Advanced Analytics: https://community.netskope.com/p/advanced-analytics
Training Resources Post: https://community.netskope.com/dashboard-gallery-38/advanced-analytics-training-resources-5713?tid=5713&fid=38
AI Guardrails Dashboard: https://community.netskope.com/dashboard-gallery-38/ai-guardrails-dashboard-8643
AI Gateway Dashboard: https://community.netskope.com/dashboard-gallery-38/ai-gateway-dashboard-8660
MCP Dashboard:
https://community.netskope.com/dashboard-gallery-38/agentic-broker-dashboard-for-securing-mcp-8762
Time Spent on YouTube:
https://community.netskope.com/dashboard-gallery-38/time-spend-on-youtube-5756
Why is my filter not working: https://community.netskope.com/video-library-20/netskope-advanced-analytics-why-is-my-filter-not-working-5805
User/Organization Unit Investigation Dashboard:
Data Flow Investigation Dashboard V2:
https://community.netskope.com/dashboard-gallery-38/data-flow-investigation-dashboard-v2-7986
Data Flow Investigation Dashboard V2 - Control & Monitor:


